. 2022 Mar 10;13(1):1244.
doi: 10.1038/s41467-022-28856-x.

Synthetic glycans control gut microbiome structure and mitigate colitis in mice

Affiliations

Synthetic glycans control gut microbiome structure and mitigate colitis in mice

Andrew C Tolonen et al. Nat Commun. .

Abstract

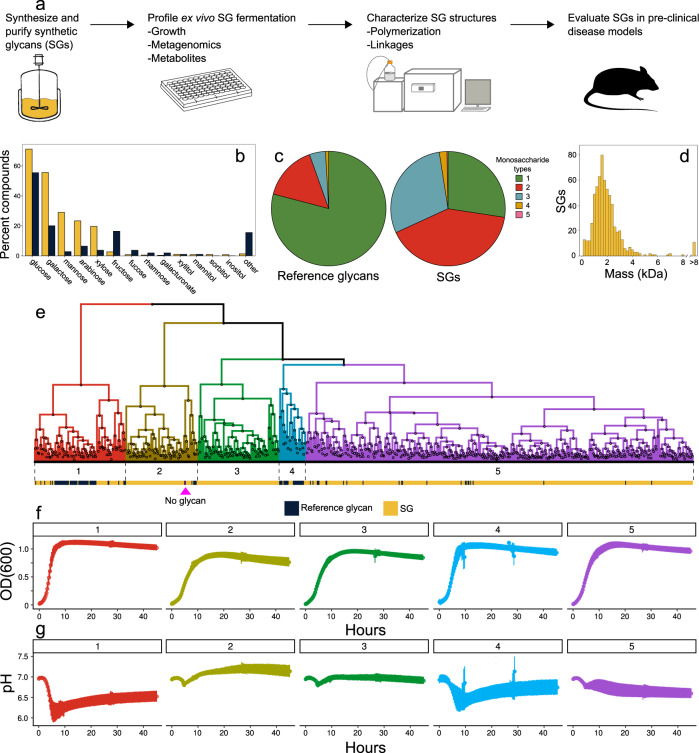
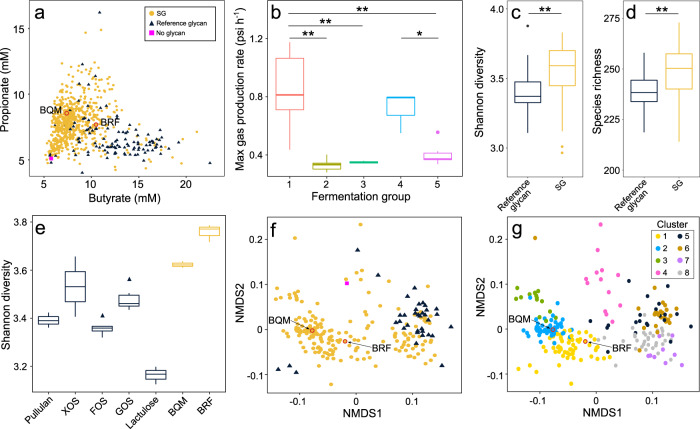
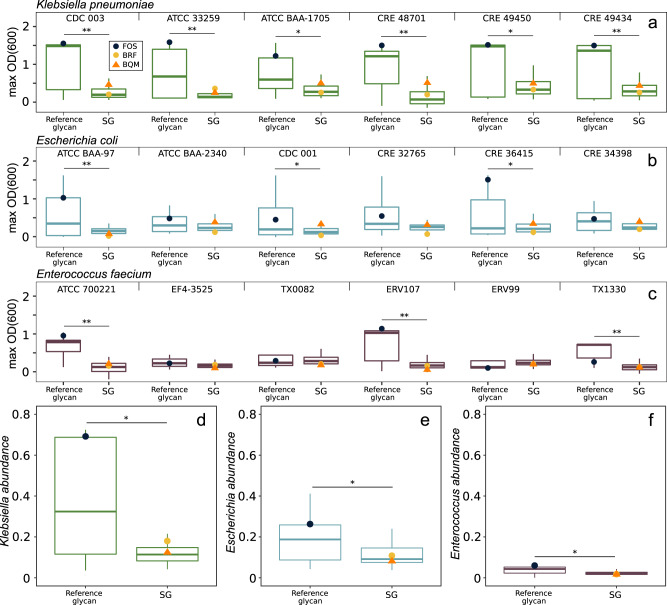
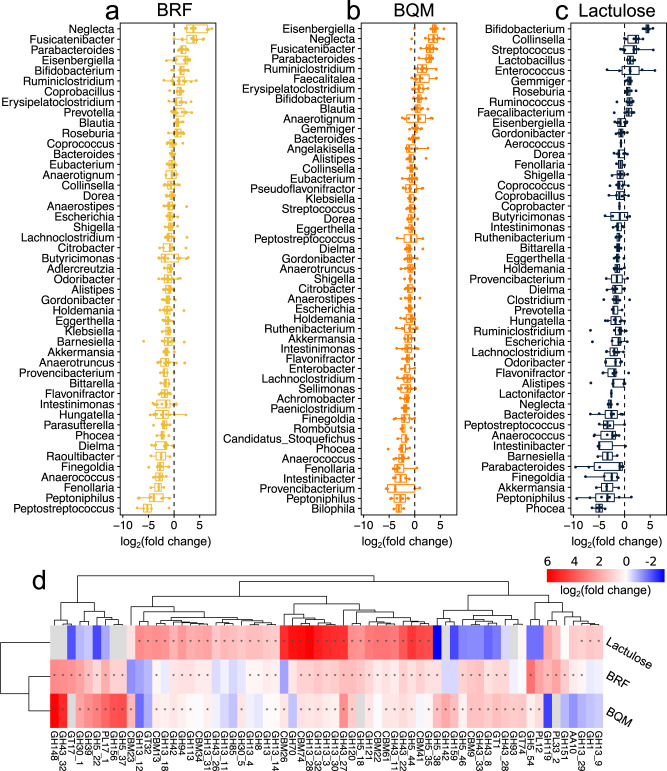
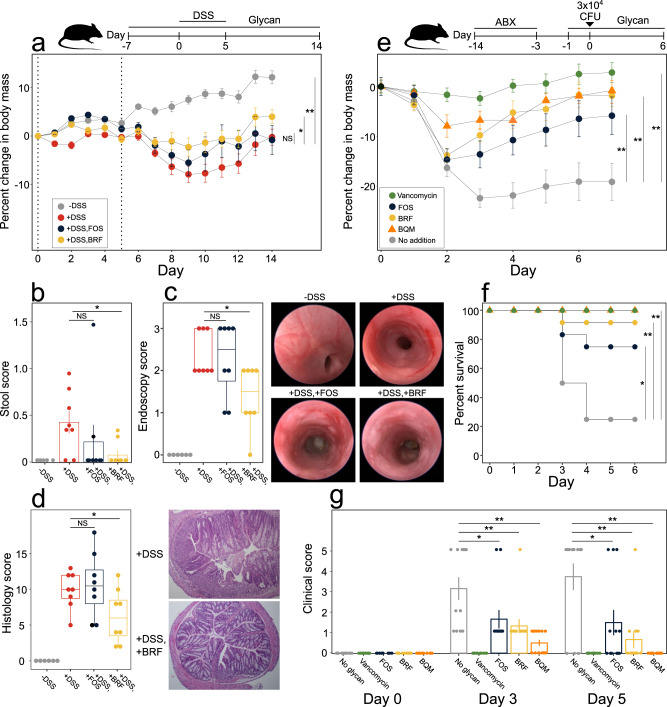
Relative abundances of bacterial species in the gut microbiome have been linked to many diseases. Species of gut bacteria are ecologically differentiated by their abilities to metabolize different glycans, making glycan delivery a powerful way to alter the microbiome to promote health. Here, we study the properties and therapeutic potential of chemically diverse synthetic glycans (SGs). Fermentation of SGs by gut microbiome cultures results in compound-specific shifts in taxonomic and metabolite profiles not observed with reference glycans, including prebiotics. Model enteric pathogens grow poorly on most SGs, potentially increasing their safety for at-risk populations. SGs increase survival, reduce weight loss, and improve clinical scores in mouse models of colitis. Synthetic glycans are thus a promising modality to improve health through selective changes to the gut microbiome.


Conflict of interest statement

P.J.T. is on the Kaleido Biosciences Scientific Advisory Board. R.K. and E.R. are employees of GlyXera. All other authors either are or were employees of Kaleido Biosciences.

Figures

Fig. 1
Fig. 1. Analytical pipeline and description of glycan compositions and fermentation dynamics.
a Schematic representation of the analytical pipeline. bf Monosaccharide compositions and fermentation dynamics of 653 SGs and 110 reference glycans. b Percentages of SGs (yellow) and reference glycans (indigo) containing various monosaccharide types. c Number of monosaccharide types composing each SG or reference glycan. d Distribution of weight average molecular weights of SGs measured by SEC. eg Growth (OD600) and pH dynamics of triplicate fecal cultures fermenting 5 g l−1 of a single SG or reference glycan in MM29 medium. e Hierarchical clustering of glycans into five fermentation groups based on twelve growth and pH parameters. Bars below the dendrogram show compound class: SG (yellow), reference glycan (indigo), or no glycan (magenta). Mean (f) growth and (g) pH curves (±SD) for each glycan fermentation group shown in e. Source data are provided as a Source Data file. SGs Synthetic Glycans, SEC size exclusion chromatography, OD600 optical density at 600 nm, SD standard deviation, kDa kilodalton.
Fig. 2
Fig. 2. Effects of glycans on fecal community metabolic output and taxonomic composition.
a Yields of two SCFAs, butyrate and propionate, from fecal cultures fermenting either an SG (yellow circles, n = 653), reference glycan (indigo triangles, n = 110), or no glycan (magenta square). b Maximum gas production rate (psi h−1) during fecal culture fermentation of glycans from each of the five fermentation groups in Fig. 1e–g. c Shannon diversity and d species richness of fecal cultures fermenting SGs (yellow, n = 190) versus reference glycans (indigo, n = 40). e Shannon diversity of fecal cultures fermenting BRF or BQM (yellow) is higher than reference glycans (indigo) for all comparisons except BQM versus XOS (Kruskal–Wallis followed by Dunn’s comparison test, p < 0.05). f NMDS of metagenomic data calculated based on a matrix of Bray–Curtis dissimilarities using species-level mapping of sequencing reads from fecal cultures grown on either an SG (yellow circles, n = 190), reference glycan (indigo triangles, n = 40), or no glycan (magenta square). g NMDS as in f colored by differences in taxonomic composition defined by eight K-means clusters based on species-level mapping of sequencing reads. Data for each glycan is the mean of (ad, f, g) three or (e) six replicate fecal cultures grown on 5 g l−1 of each SG or reference glycan for 45 h in MM29 medium. a, f, g BRF and BQM highlighted in red. be Box plots show median and interquartile ranges. Asterisks show significance (*p < 0.05, **p < 0.01) by b Tukey’s test or c, d two-sided Wilcoxon rank-sum test. Source data are provided as a Source Data file. SG Synthetic Glycan, SCFA short-chain fatty acid, XOS xylo-oligosaccharides, FOS fructo-oligosaccharides, GOS galacto-oligosaccharides, NMDS non-metric multidimensional scaling.
Fig. 3
Fig. 3. Enteric pathogen growth in pure culture and relative abundances in fecal communities grown on glycans.
Six strains of a Klebsiella pneumoniae, b Escherichia coli, or c Enterococcus faecium were cultured with 5 g l−1 of a single SG (n = 148) or reference glycan (n = 32) in CM3 medium. Data is the mean maximum growth (OD600) of triplicate cultures; strain names are shown above each plot. Fecal communities from a healthy donor were OD600-normalized to contain 8% of d K. pneumoniae CDC 003, e E. coli CDC 001, or f E. faecium ATCC 700221 and cultured in triplicate with 5 g l−1 of an SG (n = 45) or reference glycan (n = 17) for 45 h in MM29 medium. The relative abundances of the pathogens were quantified by 16S rRNA gene sequencing. Data points show FOS (indigo circle), BRF (yellow circle), or BQM (orange triangle) cultures. Box plots show median and interquartile ranges. Asterisks show significance (*p < 0.05, **p < 0.01) by two-sided Wilcoxon rank-sum test. Source data are provided as a Source Data file. SGs Synthetic Glycans, OD600 optical density at 600 nm, FOS fructo-oligosaccharides.
Fig. 4
Fig. 4. Changes in fecal community composition in response to glycans across human donors.
Differences in relative abundances of genera in ex vivo fecal cultures grown on (a) BRF, (b) BQM, or (c) lactulose relative to no-glycan controls. Data points show median log2FC in genus abundances for each donor; box plots show median and interquartile range across donors. Genera with significant changes (p < 0.05 after FDR correction) are shown. d Differences in CAZyme gene abundances in ex vivo cultures grown on different glycans (median log2FC versus no-glycan controls). CAZyme family/subfamilies with significant abundance changes (p < 0.05 after FDR correction) and log2FC > 1 on at least one glycan versus no-glycan controls are shown with hierarchical clustering based on Euclidean distance. Colors are FC with gray showing families not detected in the no-glycan control. Asterisks indicate significantly elevated abundance. ad Fecal cultures from healthy donors (ten donors for SGs, seven donors for lactulose) were grown in triplicate for 45 h in MM29 medium supplemented with 5 g l−1 glycan, as appropriate, and sequenced by metagenomics. Statistical significance for genus and CAZyme changes was determined by fitting a linear mixed-effect model on rank transformed genera/CAZyme abundance data with glycan treatment as fixed effect and subject as random effect. Source data are provided as a Source Data file. SGs Synthetic Glycans, FC fold change, FDR false discovery rate, CAZyme carbohydrate-active enzyme, GH glycoside hydrolase, CBM carbohydrate-binding modul, PL polysaccharide lyase, GT glycosyltransferase, AA auxiliary activity.
Fig. 5
Fig. 5. Structural features of SGs.
xCGE-LIF analysis of the DP of (a) BRF and (b) BQM. Triplicate measurements of each SG (red, green, purple) and oligo-maltose standards (gray) are shown relative to normalized migration time units (MTU’). The mean percent TPA at each DP is above the plots. SEC chromatograms of (c) BRF and (d) BQM showing distributions relative to molecular weight (MW) standards with insets showing polymerization parameters. Refractive index in millivolts and molecular weights in Daltons. ef Abundances (mole percent) of monosaccharides with different glycosidic linkages in (e) BRF and (f) BQM. Labels show all linkage types at >1% mole percent with residues linked only at 1- position as terminal “t-” residues. Bars show means and points show measurements for independent syntheses of each glycan. Source data are provided as a Source Data file. SGs Synthetic Glycans, xCGE-LIF multiplexed capillary gel electrophoresis with laser-induced fluorescence detection, DP degree of polymerization, TPA total peak area, SEC size exclusion chromatography, Mw weight average molecular weight, Mn number average molecular weight, PDI polydispersity index, Glcp glucopyranose, Glcf glucofuranose, Galp galactopyranose, Galf galactofuranose.
Fig. 6
Fig. 6. Glycan effects in mouse models of DSS colitis and C. difficile infection.
ad Mice were treated in drinking water with 2.5% DSS (days 0–5, dashed lines) and 1% (v/v) glycans (days 7–14), as appropriate. Treatment groups (eight animals per group): −DSS (gray), +DSS (red), +DSS, FOS (indigo), +DSS, BRF (yellow). Treatment group comparisons of (a) body weight, (b) stool score averaged over days 0–14, (c) day 14 endoscopy scores with representative images, and (d) day 14 histology scores with representative 100x magnified H&E stained distal colon micrographs. eg Mice were treated with antibiotics (days -14–3), infected with C. difficile (day 0), and treated with 50 mg kg−1 vancomycin daily (days 0–4) or 1% (v/v) glycans in drinking water (days 1–6), as appropriate. Treatment groups (12 animals per group): no glycan (gray), vancomycin (green), FOS (indigo), BRF (yellow circles), and BQM (orange triangles). Treatment group comparisons of (e) body weight, (f) survival, and (g) clinical scores. Data in (a, b, e, g) show treatment group means ± SEM. Box plots in (c, d) show median and interquartile range. Data points in (bd, g) show individual mice. a, e Statistics on body mass changes are based on area under the curve for all individual mice. Asterisks show significance (*p < 0.05, **p < 0.01) by (ae, g) two-sided Wilcoxon rank-sum test or (f) log-rank test. Source data are provided as a Source Data file. DSS dextran sodium sulfate, FOS fructo-oligosaccharides, ABX antibiotics, CFU colony forming units, SEM standard error of the mean, NS non-significant.

References

    1. Vatanen T, et al. Variation in microbiome LPS immunogenicity contributes to autoimmunity in humans. Cell. 2016;165:842–853. - PMC - PubMed
    1. Duscha A, et al. Propionic acid shapes the multiple sclerosis disease course by an immunomodulatory mechanism. Cell. 2020;180:1067–1080.e16. - PubMed
    1. Routy B, et al. Gut microbiome influences efficacy of PD-1-based immunotherapy against epithelial tumors. Science. 2018;359:91–97. - PubMed
    1. Dabke K, Hendrick G, Devkota S. The gut microbiome and metabolic syndrome. J. Clin. Invest. 2019;129:4050–4057. - PMC - PubMed
    1. Bajaj JS. The role of microbiota in hepatic encephalopathy. Gut Microbes. 2014;5:397–403. - PMC - PubMed

Publication types

Substances