. 2022 Mar 10;13(1):1248.
doi: 10.1038/s41467-022-28913-5.

Fusobacterium nucleatum reduces METTL3-mediated m6A modification and contributes to colorectal cancer metastasis

Affiliations

Fusobacterium nucleatum reduces METTL3-mediated m6A modification and contributes to colorectal cancer metastasis

Shujie Chen et al. Nat Commun. .

Abstract

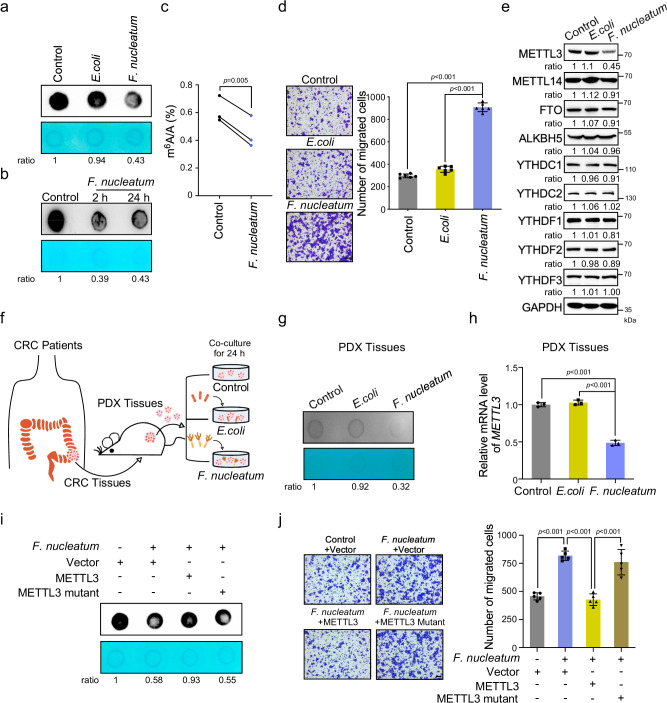
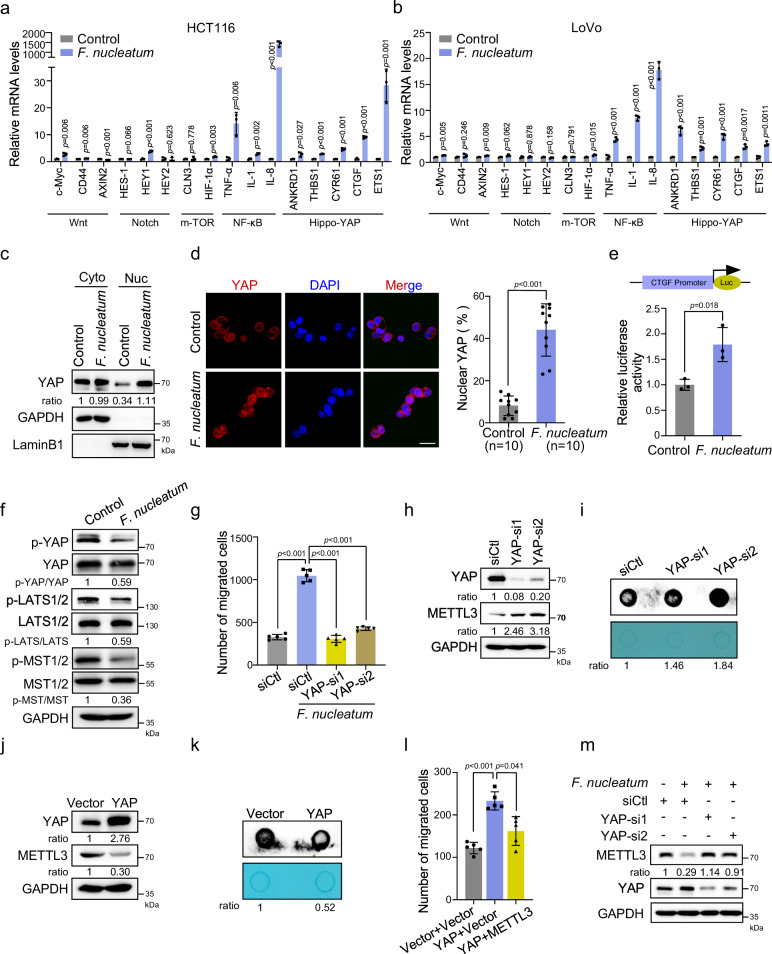
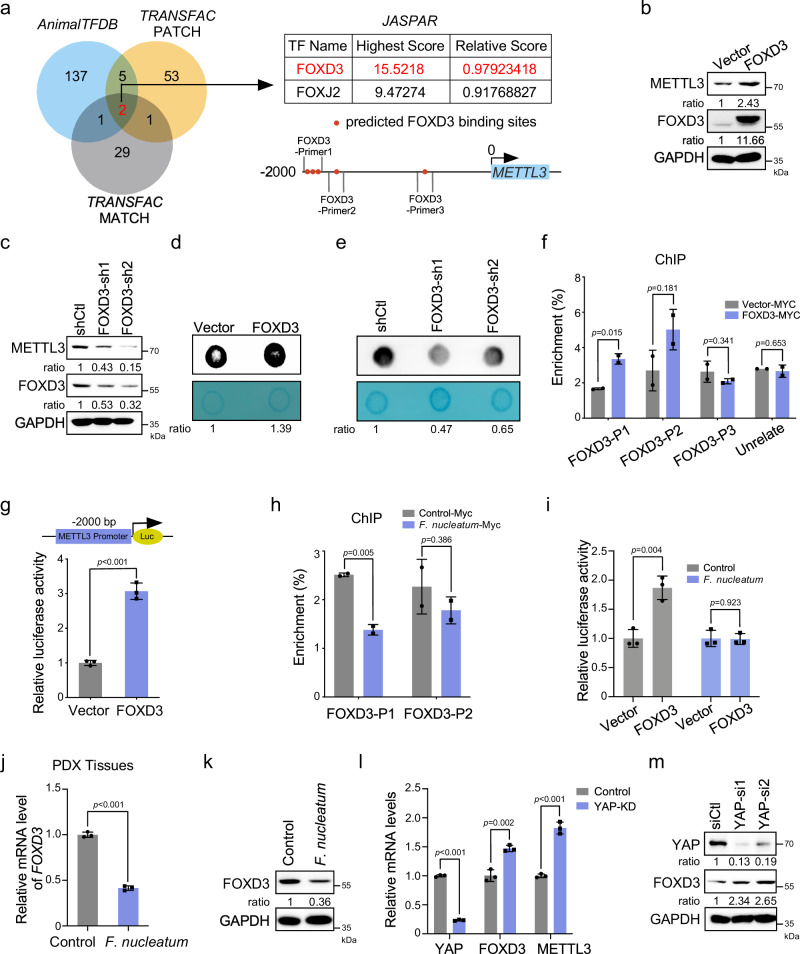
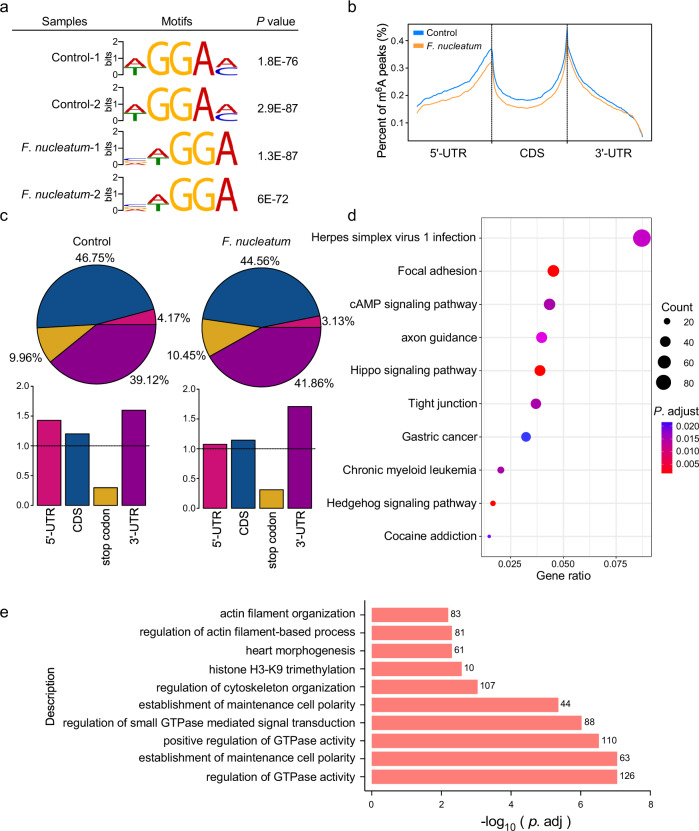
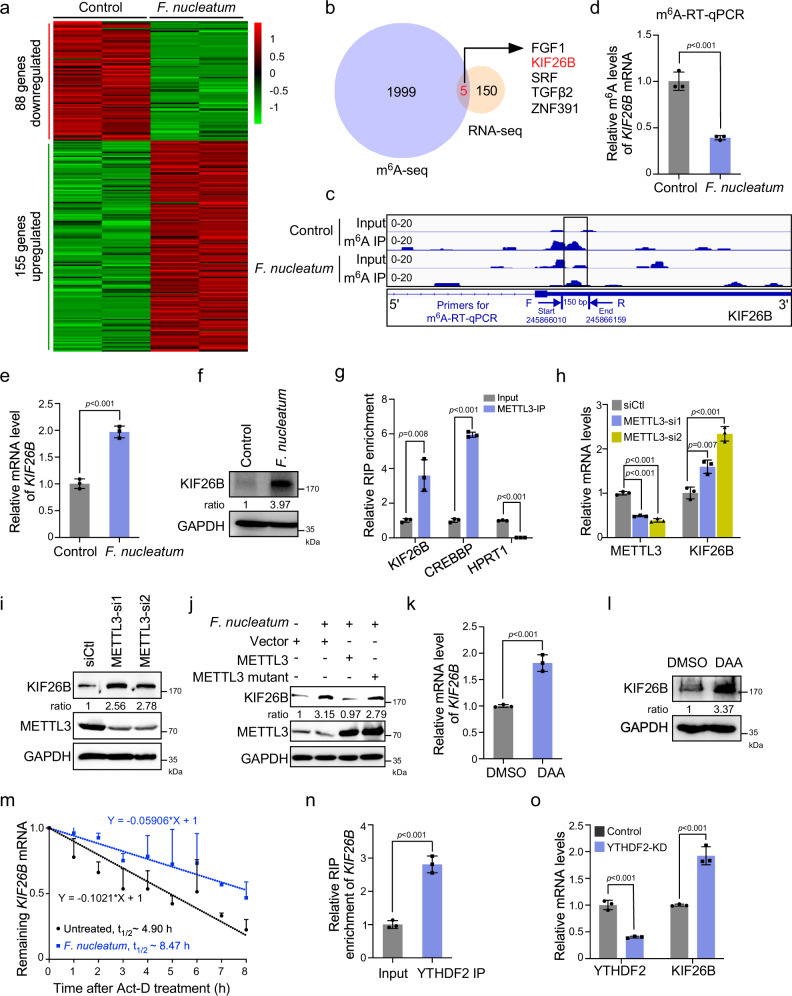
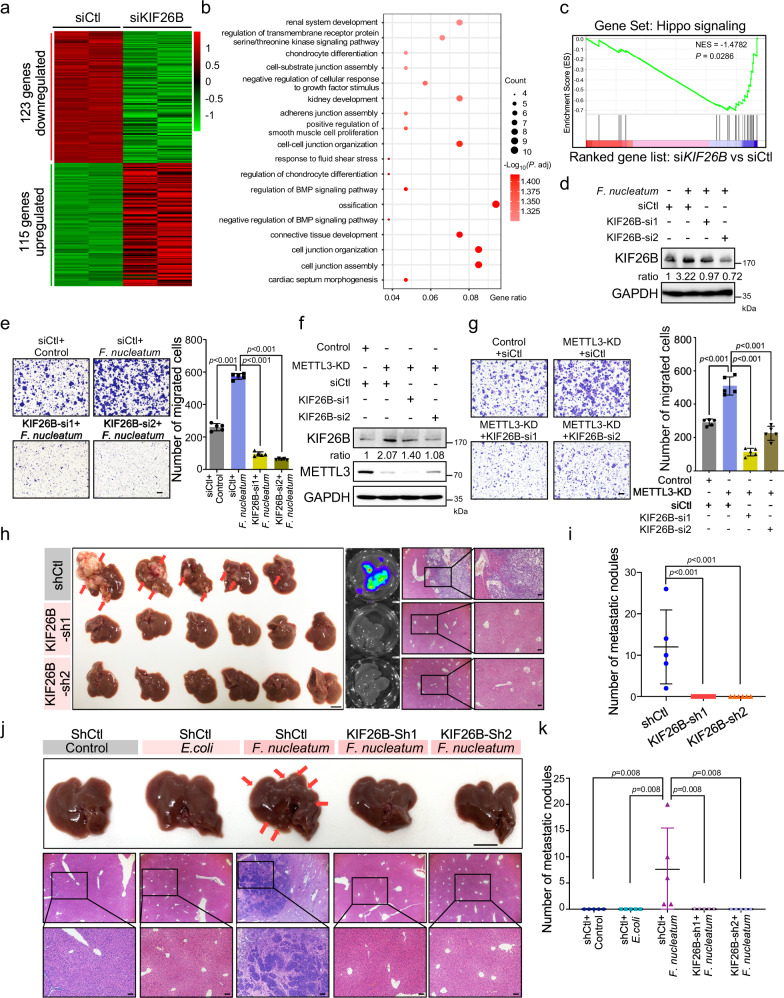
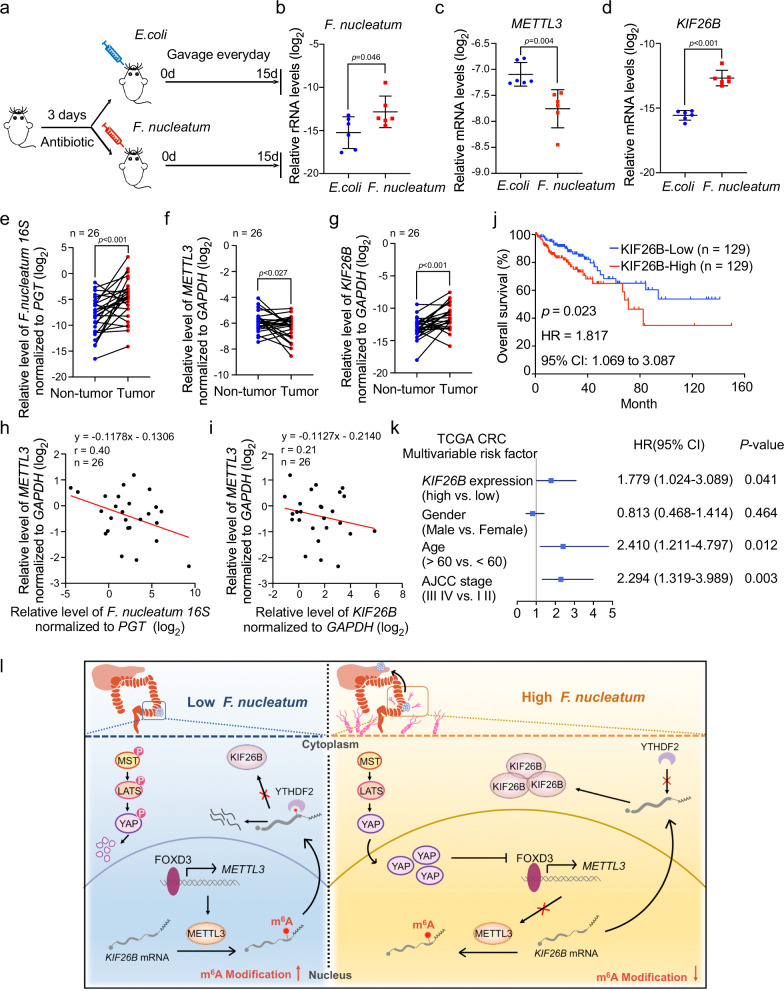
Microbiota-host interactions play critical roles in colorectal cancer (CRC) progression, however, the underlying mechanisms remain elusive. Here, we uncover that Fusobacterium nucleatum (F. nucleatum) induces a dramatic decline of m6A modifications in CRC cells and patient-derived xenograft (PDX) tissues by downregulation of an m6A methyltransferase METTL3, contributing to inducation of CRC aggressiveness. Mechanistically, we characterized forkhead box D3 (FOXD3) as a transcription factor for METTL3. F. nucleatum activates YAP signaling, inhibits FOXD3 expression, and subsequently reduces METTL3 transcription. Downregulation of METTL3 promotes its target kinesin family member 26B (KIF26B) expression by reducing its m6A levels and diminishing YTHDF2-dependent mRNA degradation, which contributes to F. nucleatum-induced CRC metastasis. Moreover, METTL3 expression is negatively correlated with F. nucleatum and KIF26B levels in CRC tissues. A high expression of KIF26B is also significantly correlated with a shorter survival time of CRC patients. Together, our findings provide insights into modulating human m6A epitranscriptome by gut microbiota, and its significance in CRC progression.


Conflict of interest statement

The authors declare no competing interests.

Figures

Fig. 1
Fig. 1. F. nucleatum reduces METTL3-mediated m6A modifications in human CRC cells and PDX tissues.
a mRNA dot blot analysis was performed to determine the m6A levels of HCT116 cells treated with F. nucleatum, E.coli DH5α, or PBS control for 24 h. b mRNA dot blot analysis was performed to determine the m6A levels of HCT116 cells treated with F. nucleatum for 2 or 24 h. c UHPLC Q-Exactive MS analysis was performed to determine the m6A/A ratio of the total mRNA in HCT116 cells treated with F. nucleatum or PBS control for 24 h. d HCT116 cells were pretreated with F. nucleatum, E.coli DH5α, or PBS control for 2 h and subjected to transwell assay (Left). The migrated cell were quantified by counting in six fields (Right). Scale bar, 100 μm. e Western blot was performed to determine the m6A modification-associated protein levels in HCT116 cells with indicated treatment. f Schematic illustration of the PDX model established with tumor tissues from CRC patients. The ex vivo model of PDX tissues treated with F. nucleatum, E.coli DH5α, or PBS control was shown. g, h The PDX tissues treated with F. nucleatum, E.coli DH5α, or PBS control for 24 h were subjected to mRNA dot blot analysis of m6A levels (g). Quantitative RT-PCR analysis was performed to detect the expression of METTL3 in PDX tissues (h). i The HCT116 cells were transfected with wild-type METTL3, or catalytic mutant (aa395–398, DPPW-APPA) METTL3, or control pcDNA3.1(+) plasmids and treated with F. nucleatum or PBS. mRNA dot blot analysis of m6A levels were performed. j The HCT116 cells with indicated treatments were applied for transwell migration analysis. Representative images of migrated cells were shown (Left). The migrated cells were quantified in five fields (Right). Scale bar, 100 μm. The methylene blue staining was used as a loading control in the mRNA dot blot assay. Data were from one representative of three independent experiments (a, b, e, g, i). Data were shown as mean ± SD. P values were shown. A two-tailed paired t-test (c), two-tailed Student’s t-test (d, h, j).
Fig. 2
Fig. 2. F. nucleatum inhibits METTL3 through modulating Hippo-YAP signaling pathway.
a, b Quantitative RT-PCR was performed to detect the variations of different pathway target genes in HCT116 cells (a) and LoVo cells (b) treated with F. nucleatum or PBS control for 2 h. c Western blot analysis of the levels of YAP in the cytoplasmic and nuclear fractions of HCT116 cells treated with F. nucleatum or PBS control for 2 h. GAPDH, cytoplasm marker. LaminB1, nuclear marker. d Immunofluorescence analysis of the YAP distribution in the indicated cells (Left). Cells were stained with a specific antibody against YAP (red), and nuclei were counterstained with DAPI (blue). The percentage of nuclear YAP were quantified by counting in ten fields (Right). Scale bar, 20 μm. e Dual-luciferase reporter assay showing the effects of F. nucleatum treatment on relative CTGF-promoter activity in the HCT116 cells. f Western blot was performed to detect the levels of YAP and phospho-YAP, LATS1/2 and phospho-LATS1/2, MST1/2 and phospho-MST1/2 in HCT116 cells treated with F. nucleatum or PBS control. g Transwell migration assay was performed in HCT116 cells with indicated treatment. The migrated cells were quantified by counting in five fields. h HCT116 cells with the indicated treatment were subjected to western blot analysis. i mRNA dot blot analysis was performed to determine the m6A levels of HCT116 cells after transfection with siRNAs targeting YAP. j HCT116 cells transfected with YAP overexpression or control pcDNA3.1(+) plasmids were subjected to western blot analysis of METTL3. k mRNA dot blot analysis was performed to determine the m6A levels of HCT116 cells after transfection with YAP plasmid or pcDNA3.1(+) control vector. l Transwell migration analysis of HCT116 cells transfected the indicated vectors. The migrated cells were quantified by counting in five fields. m Western blot analysis of METTL3 in HCT116 cells transfected with the indicated siRNAs. The methylene blue staining was used as a loading control in the mRNA dot blot assay. Data were from one representative of three independent experiments (c, f, hk, m). Data were shown as mean ± SD. P values were shown. Two-tailed Student’s t-test (a, b, d, e, g, l).
Fig. 3
Fig. 3. FOXD3 is a transcription factor for METTL3.
a Venn diagram showing two overlapping transcription factors appeared in three prediction sets (AnimalTFDB, TRANSFAC PATCH, and TRANSFAC MATCH). Schematic illustration of the potential binding sites of FOXD3 on the promoter of METTL3. Three pairs of primers were shown for the following ChIP analysis. b Western blot analysis of METTL3 in HCT116 cells transfected with FOXD3-myc-his vector or control vector. c Western blot analysis of METTL3 in FOXD3-knockdown HCT116 cells. d, e mRNA dot blot analysis was performed to determine the m6A levels of HCT116 cells transfected with FOXD3 plasmid (d) or FOXD3 shRNAs (e). f ChIP-qPCR analysis of FOXD3 binding to the predicted binding regions of METTL3 promoter in HCT116 cells. Ectopic FOXD3 was pulled down by the anti-MYC-tag antibody. g Dual-luciferase reporter assay showing the effects of FOXD3 overexpression on relative METTL3-promoter (−2000 bp ~100 bp) activity in the HCT116 cells. h ChIP-qPCR analysis of FOXD3 binding to the promoter of METTL3 in HCT116 cells treated with F. nucleatum or PBS control. i Dual-luciferase reporter assay showing the effects of FOXD3 on relative METTL3-promoter activity in the HCT116 cells treated with F. nucleatum or PBS control. j CRC PDX tissues were treated with F. nucleatum or PBS for 24 h and subjected to quantitative RT-PCR analysis of FOXD3 expression. k Western blot analysis of FOXD3 expression in HCT116 cells treated with F. nucleatum or PBS control. l Quantitative RT-PCR analysis of FOXD3 and METTL3 expression in HCT116 cells transfected with indicated siRNAs. m Protein levels of FOXD3 were detected in YAP-knockdown HCT116 cells. The methylene blue staining was used as a loading control in mRNA dot blot assay (d, e). The ChIP-qPCR results were presented as an enrichment of FOXD3 at METTL3 promoter relative to input (f, h). Data were from one representative of three independent experiments (be, k, m). Data were shown as mean ± SD. P values were shown. Two-tailed Student’s t-test (f, g, h, i, j, l).
Fig. 4
Fig. 4. Variations of m6A-regulated genes in CRC cells with F. nucleatum treatment.
a HCT116 cells were treated with F. nucleatum or PBS control for 2 h and subjected to m6A-sequencing. Predominant consensus motifs identified by DREME within m6A peaks of indicated HCT116 cells of two biological replicates with the lowest p value. The significance of the relative enrichment of each motif was computed using the Fisher’s Exact Test (P value). b Density distribution of m6A peaks across mRNA transcripts. Regions of the 5′ untranslated region (5′UTR), coding region (CDS), and 3′ untranslated region (3′UTR) were split into 100 segments, then percentages of m6A peaks that fall within each segment were determined. c Proportion of m6A peak distribution in the 5′UTR, CDS, stop codon, or 3′UTR region across the entire set of mRNA transcripts. d KEGG pathway analysis of a total number of 3589 genes with significant differential m6A peaks in F. nucleatum-treated cells compared with untreated cells. −log10 (p.adj) of the ten most enriched pathways are displayed. P. adjust, hypergeometric test with Benjamini–Hochberg adjusted. e Gene Ontology enrichment analysis of a total number of 3589 genes with differential m6A peaks in F. nucleatum-treated cells compared with untreated cells. −log10 (p.adj) of the ten most enriched gene functions related to the biological processes are displayed. P. adjust, hypergeometric test with Benjamini–Hochberg adjusted.
Fig. 5
Fig. 5. KIF26B is a downstream target of METTL3 by m6A-seq and RNA-seq.
a Heat map representing the differential gene expression patterns between F. nucleatum-treated and untreated HCT116 cells (fold change >2 or fold change <0.5, P < 0.05). b 155 genes with significant mRNA upregulation in RNA-seq and 2004 genes with significant m6A peaks downregulation in m6A-seq were subjected to Venn diagram analysis. Venn diagram showing the overlapping genes. c m6A RIP-seq data showed a significant decrease of m6A peaks around the stop codon of KIF26B mRNA upon F. nucleatum treatment. Squares marked a decline of m6A peaks in HCT116 cells cocultured with F. nucleatum. The region for m6A-RT-qPCR detection was annotated. d m6A RIP-qPCR analysis of KIF26B mRNA in the control and F. nucleatum-treated HCT116 cells. e, f HCT116 cells treated with F. nucleatum or PBS control were subjected to quantitative RT-PCR analysis (e) and western blot analysis (f) of KIF26B expression. g RNA Immunoprecipitation (RIP)-qPCR analysis of METTL3 binding with KIF26B mRNA, or CREBBP mRNA (positive control) or HPRT1 mRNA (negative control) in HCT116 cells. h, i HCT116 cells transfected with indicated siRNAs were subjected to quantitative RT-PCR analysis (h) and western blot analysis (i) of KIF26B expression. j KIF26B expression was detected by western blot in HCT116 cells with indicated treatment. k, l Quantitative RT-PCR (k) and western blot (l) analysis of KIF26B in HCT116 with 10 μM 3-deazaadenosine (DAA) treatment for 48 h. DAA is a methylation inhibitor. m HCT116 cells were pretreated with F. nucleatum or PBS for 2 h. The remaining KIF26B mRNAs were analyzed by quantitative RT-PCR at the indicated time points after actinomycin D treatment. n RIP-qPCR analysis of YTHDF2 binding with KIF26B mRNA in HCT116 cells. o KIF26B mRNA levels were detected in YTHDF2-knockdown HCT116 cells. Data were from one representative of three independent experiments (f, i, j, l, m). Data were shown as mean ± SD. P values were shown. Two-tailed Student’s t-test (d, e, g, h, k, n, o).
Fig. 6
Fig. 6. F. nucleatum accelerates CRC aggressiveness and metastasis by upregulating KIF26B.
a Hierarchical clustering showing the genes that were differentially expressed in KIF26B-knockdown HCT116 cells and control cells. (fold change >2 or fold change <0.5, P < 0.05). b Gene Ontology enrichment analysis of the 123 downregulated genes. P. adjust, hypergeometric test with Benjamini–Hochberg adjusted. c GSEA analyses of KIF26B-regulated gene signature versus Hippo signaling signature. P value was analyzed by a hypergeometric test. d, e HCT116 cells transfected with two siRNAs targeting KIF26B or control siRNAs were treated with F. nucleatum for 2 h. Western blot analysis (d) and transwell migration analysis (e) were performed. The migrated cells were quantified in five fields (Right). Scale bar, 100 μm. f Western analysis of KIF26B in HCT116 cells transfected with the indicated siRNAs. g The HCT116 cells with indicated treatments were applied for transwell migration analysis. Representative images of migrated cells were shown (Left). The migrated cells were quantified in five fields (Right). Scale bar, 100 μm. h, i Luciferase-labeled RKO cells were stably infected with lentivirus-based KIF26B shRNAs (n = 6) or control shRNAs (n = 5). The indicated cells were intrasplenically injected into nude mice to develop liver metastasis. Representative gross livers (left) (Scale bar, 1 cm), bioluminescence images (middle), and H&E stained liver sections (right, Scale bar, 20 μm) of the mice are shown (h). Liver metastatic nodules per mice were quantified (i). j, k SW620 cells were stably infected with lentivirus-based KIF26B shRNAs or control shRNAs. The indicated cells were cocultured with E. coli or F. nucleatum for 24 h and intrasplenically injected into nude mice. Representative gross livers (Scale bar, 1 cm) and H&E stained liver sections (Scale bar, 20 μm) of the mice are shown (j). Liver metastatic nodules per mice were quantified (k) (n = 5). Data were from one representative of three independent experiments (d, f). Data were shown as mean ± SD. P values were shown. Two-tailed Student’s t-test (e, g). Two-tailed Mann–Whitney test (i, k).
Fig. 7
Fig. 7. F. nucleatum is correlated with METTL3 and KIF26B expressions in CRC patients.
a C57BL/6 mice pretreated with 3-day antibiotics were administrated with F. nucleatum or E. coli everyday by gavage. Mice were sacrificed after the treatment for 15 days. b Quantitative RT-PCR analysis of F. nucleatum in colorectum tissues from the indicated mice (n = 6). c, d Quantitative RT-PCR analysis of METTL3 mRNA (c) and KIF26B mRNA (d) expression in colorectum tissues from the indicated mice (n = 6). e Quantitative RT-PCR analysis of F. nucleatum in human CRC tissues and matched adjacent non-tumor tissues. The CRC patients in this cohort all had lymph node metastasis (n = 26). f, g Quantitative RT-PCR analysis of METTL3 (f) and KIF26B (g) in human CRC tissues and matched adjacent non-tumor tissues. h, i The correlation between the relative levels of F. nucleatum 16S and METTL3 mRNA (h) or the correlation between the levels of METTL3 and KIF26B mRNA (i) in CRC tissues and adjacent non-tumor tissues (n = 26). The correlation was analyzed by linear regression. j Kaplan–Meier survival curves were analyzed and compared between patients with low (n = 129) and high (n = 129) levels of KIF26B in CRC patients from The Cancer Genome Atlas (TCGA) database. Subgroups with high- or low-KIF26B expression were sorted according to the TPM gene expression standard values. k Multivariable analysis was performed of CRC patients in the TCGA database. The center dots represent the Hazard ratio (HR). All the bars correspond to 95% confidence intervals. P value, multivariate cox regression analysis. The details were provided in the methods section. l Schematic diagram of the F. nucleatum-induced downregulation of METTL3-mediated m6A modifications contributes to CRC metastasis. Data of quantitative RT-PCR are presented as log2 value normalized to universal Eubacteria 16S (b), GAPDH (c, d, f, g), or PGT (e). Data were shown as mean ± SD. P values were shown. Two-tailed Mann–Whitney test (bd), Two-tailed paired t-test (eg), and log-rank test (j). AJCC American Joint Committee on Cancer, CI confidence interval, HR hazard rate.

References

    1. Bray F, et al. Global cancer statistics 2018: GLOBOCAN estimates of incidence and mortality worldwide for 36 cancers in 185 countries. CA Cancer J. Clin. 2018;68:394–424. - PubMed
    1. Siegel R. L., et al. Colorectal cancer statistics, 2020. CA Cancer J. Clin.70, 145–164 (2020). - PubMed
    1. Rubinstein MR, et al. Fusobacterium nucleatum promotes colorectal carcinogenesis by modulating E-cadherin/beta-catenin signaling via its FadA adhesin. Cell Host Microbe. 2013;14:195–206. doi: 10.1016/j.chom.2013.07.012. - DOI - PMC - PubMed
    1. Tsoi H, et al. Peptostreptococcus anaerobius induces intracellular cholesterol biosynthesis in colon cells to induce proliferation and causes dysplasia in mice. Gastroenterology. 2017;152:1419–1433 e1415. doi: 10.1053/j.gastro.2017.01.009. - DOI - PubMed
    1. Wang L. et al. A purified membrane protein from Akkermansia muciniphila or the pasteurised bacterium blunts colitis associated tumourigenesis by modulation of CD8(+) T cells in mice. Gut23, 107–113 (2020). - PMC - PubMed