. 2022 Mar 10;13(1):1251.
doi: 10.1038/s41467-022-28898-1.

Divergent trajectories of antiviral memory after SARS-CoV-2 infection

Adriana Tomic #  1 Donal T Skelly #  2   3   4 Ane Ogbe #  2 Daniel O'Connor #  5   6 Matthew Pace  2 Emily Adland  2 Frances Alexander  7 Mohammad Ali  2 Kirk Allott  8 M Azim Ansari  2 Sandra Belij-Rammerstorfer  9 Sagida Bibi  5 Luke Blackwell  5 Anthony Brown  2 Helen Brown  2 Breeze Cavell  7 Elizabeth A Clutterbuck  5 Thushan de Silva  10 David Eyre  3   11 Sheila Lumley  2   3 Amy Flaxman  9 James Grist  12 Carl-Philipp Hackstein  2 Rachel Halkerston  7 Adam C Harding  13 Jennifer Hill  5   6 Tim James  8 Cecilia Jay  2 Síle A Johnson  2   3   14 Barbara Kronsteiner  2   15 Yolanda Lie  16 Aline Linder  5   6 Stephanie Longet  7   17 Spyridoula Marinou  5   6 Philippa C Matthews  2   3   6 Jack Mellors  7 Christos Petropoulos  16 Patpong Rongkard  2   18 Cynthia Sedik  16 Laura Silva-Reyes  5   6 Holly Smith  9 Lisa Stockdale  5   6 Stephen Taylor  7 Stephen Thomas  7 Timothy Tipoe  2 Lance Turtle  19   20 Vinicius Adriano Vieira  21 Terri Wrin  16 OPTIC Clinical GroupPITCH Study GroupC-MORE GroupAndrew J Pollard  5   6 Teresa Lambe  9 Chris P Conlon  22 Katie Jeffery  3   23 Simon Travis  3   24 Philip Goulder  21 John Frater  2   3 Alex J Mentzer  3   17 Lizzie Stafford  22 Miles W Carroll  7   17 William S James  13 Paul Klenerman #  2   3   6   24 Eleanor Barnes #  25   26   27   28 Christina Dold #  5   6 Susanna J Dunachie #  2   3   15   18
Collaborators, Affiliations

Divergent trajectories of antiviral memory after SARS-CoV-2 infection

Adriana Tomic et al. Nat Commun. .

Abstract

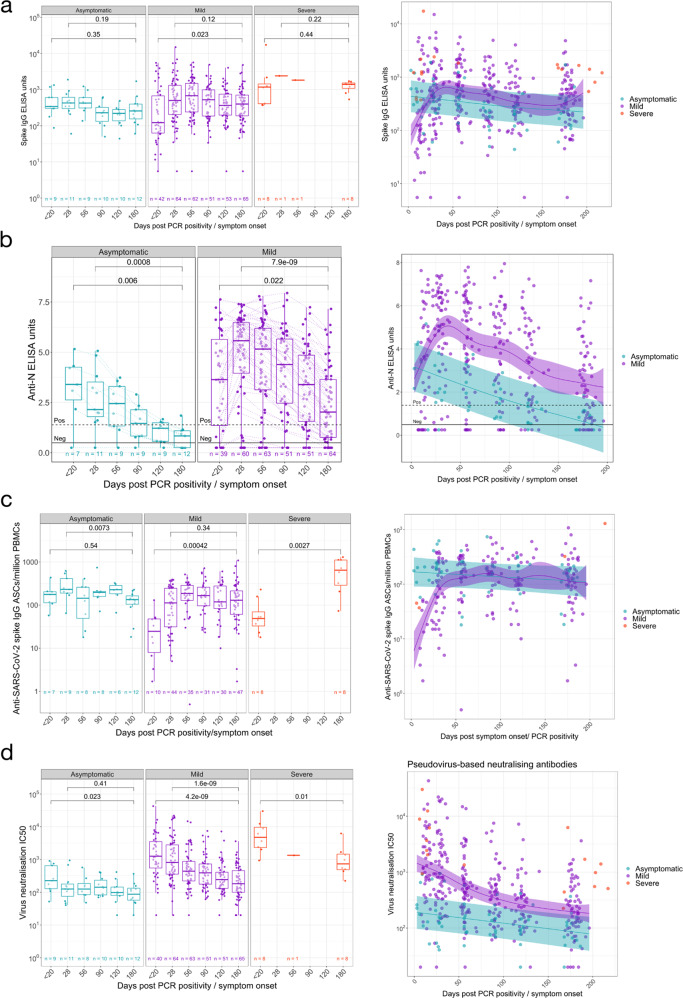
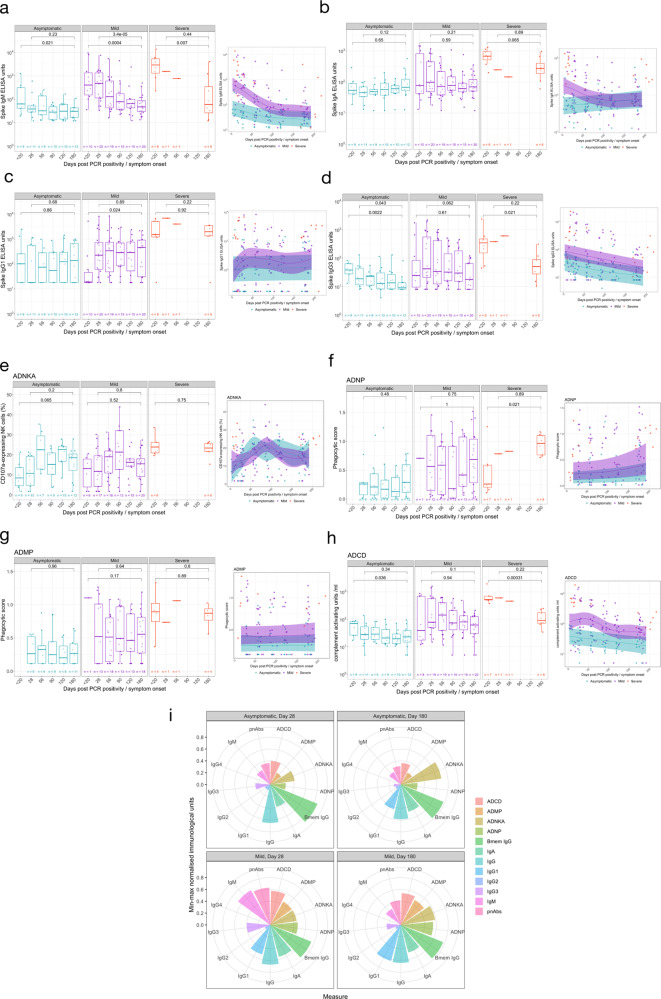
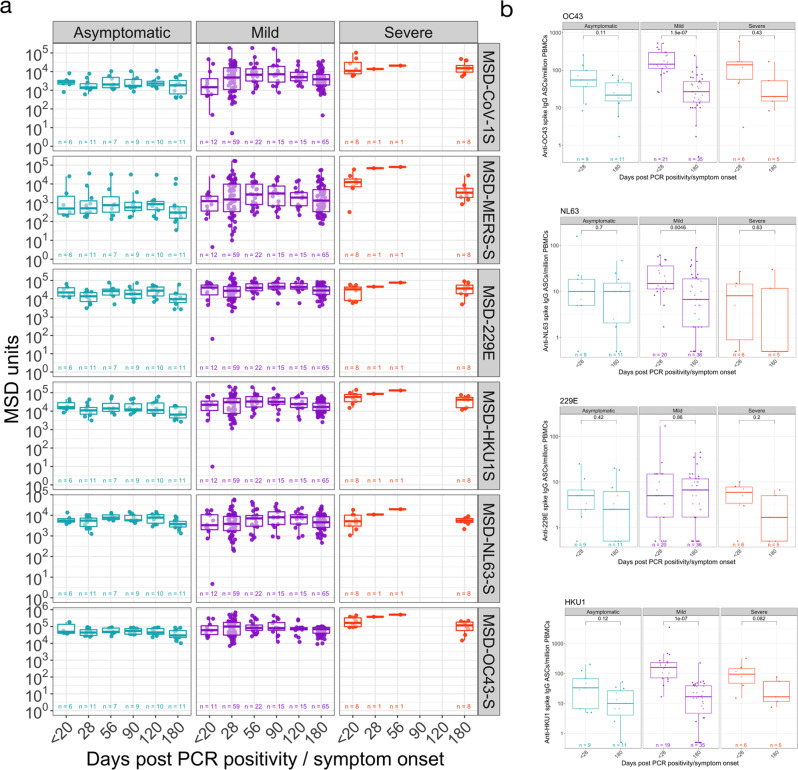
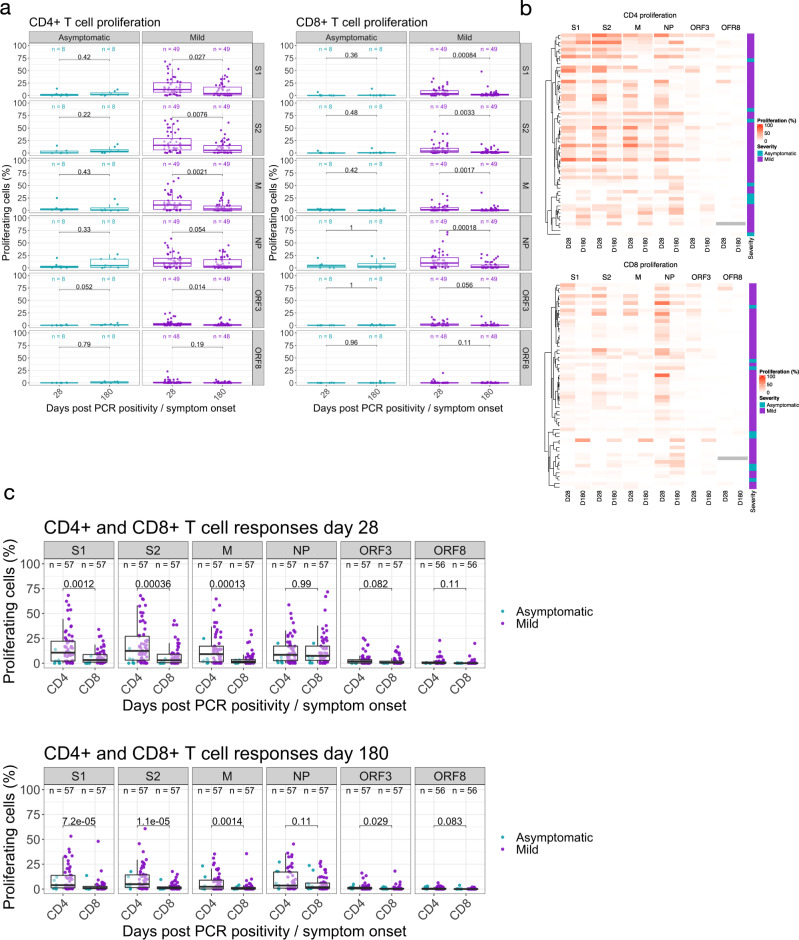
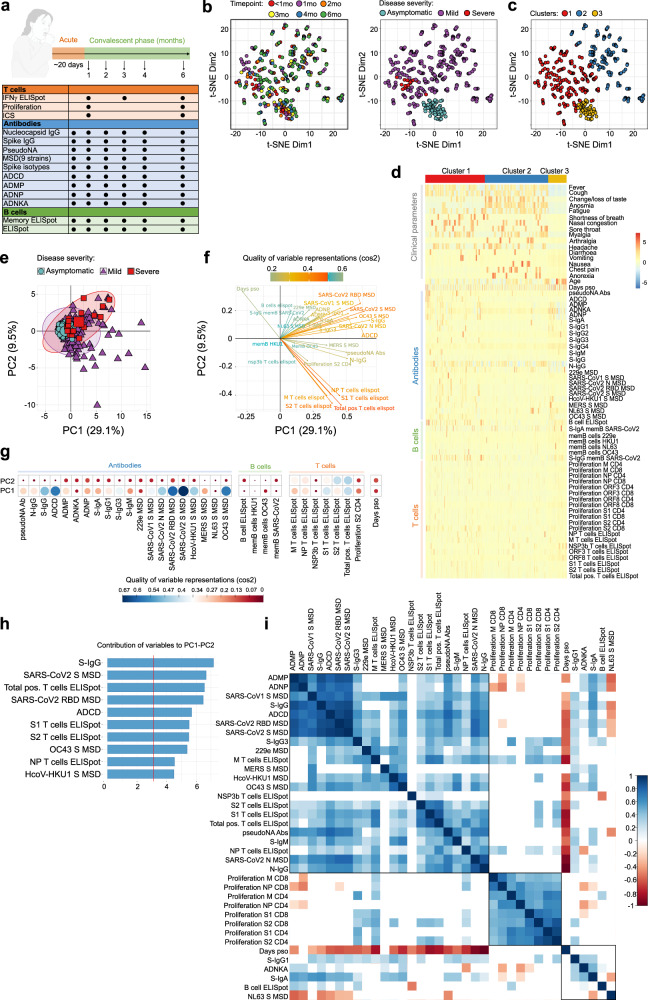
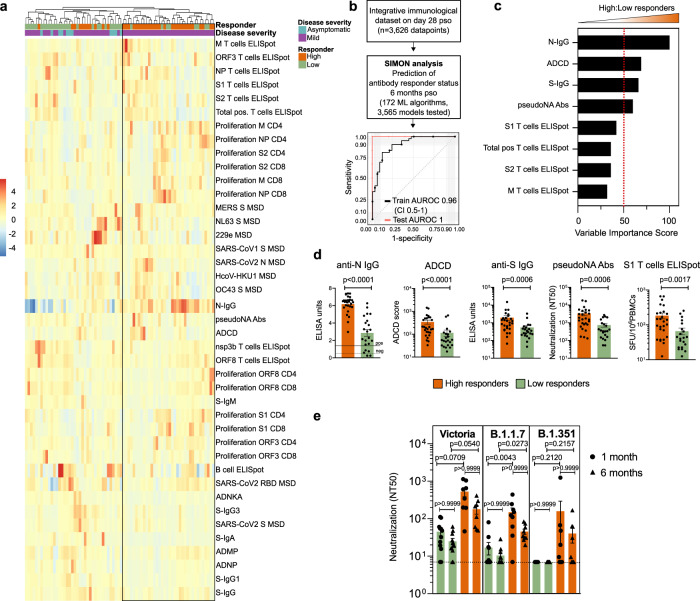
The trajectories of acquired immunity to severe acute respiratory syndrome coronavirus 2 infection are not fully understood. We present a detailed longitudinal cohort study of UK healthcare workers prior to vaccination, presenting April-June 2020 with asymptomatic or symptomatic infection. Here we show a highly variable range of responses, some of which (T cell interferon-gamma ELISpot, N-specific antibody) wane over time, while others (spike-specific antibody, B cell memory ELISpot) are stable. We use integrative analysis and a machine-learning approach (SIMON - Sequential Iterative Modeling OverNight) to explore this heterogeneity. We identify a subgroup of participants with higher antibody responses and interferon-gamma ELISpot T cell responses, and a robust trajectory for longer term immunity associates with higher levels of neutralising antibodies against the infecting (Victoria) strain and also against variants B.1.1.7 (alpha) and B.1.351 (beta). These variable trajectories following early priming may define subsequent protection from severe disease from novel variants.


Conflict of interest statement

D.W.E. declares lecture fees from Gilead, outside the submitted work. No other competing interests declared. S.J.D. is a Scientific Advisor to the Scottish Parliament, for which a fee is received. All other authors declare no other competing interests.

Figures

Fig. 1
Fig. 1. Longitudinal humoral immune responses in individuals with PCR confirmed SARS-CoV-2 asymptomatic, mild or severe infection.
Humoral immune responses were assessed in acute and convalescent by binding antibody ELISA for total IgG specific to the a Spike glycoprotein and b Nucleocapsid, quantification of c IgG memory B cells specific to the spike glycoprotein, and d pseudoneutralisation antibody titres. A two-tailed Wilcoxon rank-sum test was used to compare between study time points. The boxplots all display the median values with the first and third quartile, and the whiskers represent the highest and lowest values no more than 1.5 times the interquartile range from the corresponding hinge. A generalised additive mixed model (GAMM) by restricted maximum likelihood—right-hand plots—was used to fit the immunological measures (log10 transformed) taken at multiple study time points, using Gaussian process smooth term. The GAMM plots the ribbon represents the 95% confidence interval around the fitted value. Disease severity group was included in the GAMM as a linear predictor and a participant identifier was included as a random effect. See Table S1 for number of individuals evaluated per assay.
Fig. 2
Fig. 2. Antibody isotype, subclass and function in individuals with PCR confirmed SARS-CoV-2 asymptomatic, mild or severe infection.
SARS-CoV-2 spike-specific antibody isotype and subclasses measured post-infection: a IgM, b IgA, c IgG1 and d IgG3. Antibody function measure post-SARS-CoV-2 infection: e antibody-dependent NK cell activation (ADNKA), f antibody-dependent neutrophil phagocytosis (ADNP), g antibody-dependent monocyte phagocytosis (ADMP) and h antibody-dependent complement deposition (ADCD). i Polar plot of various antibody isotype, subclass and function data, minimum-maximum normalised. The boxplots all display the median values with the first and third quartile, and the whiskers represent the highest and lowest values no more than 1.5 times the interquartile range from the corresponding hinge. A two-tailed Wilcoxon rank-sum test was used to compare between study time points. A generalised additive mixed model (GAMM) by restricted maximum likelihood—right-hand plots—was used to fit the immunological measures (log10 transformed) taken at multiple study time points, using Gaussian process smooth term. The GAMM plots the ribbon represents the 95% confidence interval around the fitted value. Disease severity group was included in the GAMM as a linear predictor and a participant identifier was included as a random effect. See Table S1 for number of individuals evaluated per assay.
Fig. 3
Fig. 3. Longitudinal specific-IgG and memory B cell responses to spike protein from non-SARS-CoV-2 coronaviruses.
a Meso Scale Discovery (MSD) multiplexed immunoassay (MIA) platform measurements of antibody levels to spike protein from non-SARS-CoV-2 coronaviruses. b Memory B cells responses to spike protein from non-SARS-CoV-2 coronaviruses. The boxplots all display the median values with the first and third quartile, and the whiskers represent the highest and lowest values no more than 1.5 times the interquartile range from the corresponding hinge. A two-tailed Wilcoxon rank-sum test was used to compare between study time points (without correction for multiple testing). See Table S1 for number of individuals evaluated per assay.
Fig. 4
Fig. 4. Magnitude of SARS-CoV-2 specific Effector T cell Response.
a Ex vivo IFN-γ ELISpot showing the effector T cell responses to summed SARS-CoV-2 peptide pools spanning spike, accessory and structural proteins (summed total of SARS-CoV-2 proteins tested, S1, S2, NSP3B, M, NP, ORF 3, ORF8 and the CEFT positive control peptides for T cell responses) in 78 individuals 28, 90 and 180 days after mild or asymptomatic SARS-CoV-2 infection (onset of symptoms for mild cases, PCR positive test for asymptomatic participants). The boxplots all display the median values with the first and third quartile, and the whiskers represent the highest and lowest values no more than 1.5 times the interquartile range from the corresponding hinge. A two-tailed Wilcoxon rank-sum test was used to compare between study time points (without correction for multiple testing). b Heatmap displaying unsupervised hierarchical clustering of the ELISpot data in a and disease severity (mild or asymptomatic) for the original SARS-CoV-2 diagnosis. Sfu/million PBMCs = spot forming units per million peripheral blood mononuclear cells, with background subtracted. D28, d90 and d180 = days after SARS-CoV-2 diagnosis. Grey regions on heatmap represent missing data due to insufficient cells.
Fig. 5
Fig. 5. Proliferative responses to SARS-CoV-2 peptide pools at 1- and 6-months post infection.
Proliferative responses against a SARS-CoV-2 proteins S1, S2, M, NP, ORF3 and ORF8 presented in CD4+ (Left hand panel) and CD8+ (Right hand panel) T cells measured at 28 and 180 days pso for volunteers with mild disease or days post PCR positivity for asymptomatic disease (asymptomatic n = 8, mild disease n = 49). A two-tailed Wilcoxon rank-sum test was used to compare between study time points and P values are indicated. b Unsupervised hierarchical clustering showing visual representation of SARS-CoV-2 specific responses at day 28 and 180 in both CD4+ and CD8+ T cell compartments and c comparative analysis of SARS-CoV-2 specific CD4+ and CD8+ T cell responses at day 28 (top panel) and day 180 (bottom panel) in both asymptomatic and mild groups (analysed as one group). Kruskal Wallis (one-way ANOVA on ranks) test, all P values are stated on plots. The boxplots all display the median values with the first and third quartile, and the whiskers represent the highest and lowest values no more than 1.5 times the interquartile range from the corresponding hinge.
Fig. 6
Fig. 6. Integrative analysis of clinical and longitudinal immunological data reveals distinct immunophenotypic groups of SARS-CoV-2 infected individuals.
a Clinical study overview. b t-SNE map of integrated clinical and immunological data colour-coded based on timepoint or disease severity. c Clustered t-SNE analysis. d Heatmap of clinical and immune parameters across three identified clusters. e PCA plot representing integrated immunological data, grouped based on the disease severity. Percentage indicates the variance explained by the principal component (PC). f Variable correlation plot. Positively correlated variables are grouped together, while negatively correlated variables are positioned on opposite quadrants. The distance between variables and the origin measures the quality of the variables on the factor map, while the colour indicated the quality of representations as cos2. g Quality of variable representations (colour-coded, cos2) and contributions of variables to principal components 1 and 2 (size of the circle). h Top 10 variables and their contribution to PC 1 and 2. i Correlations of immunological parameters with time component across samples. Spearman’s correlation coefficient (colour coded) and only significant values shown (adjusted for multiple testing using the Benjamini-Hochberg correction at the significance threshold FDR < 0.05). Black boxes indicate clusters (hierarchical clustering).
Fig. 7
Fig. 7. Early signature of durable SARS-CoV2 immune responses.
a Hierarchical clustering heatmap of immune parameters on day 28 pso, grouping by responder status 6 months pso and disease severity. Results obtained using complete linkage agglomeration method, dendrogram ordered tightest cluster first. b Integrative immunological dataset containing 3,626 datapoints (49 features and 74 donors) was used for SIMON analysis to predict if the individual will generate high or low anti-N antibody responses 6 months pso. In total, 172 ML algorithms were tested and 3565 model built. ROC plot of the best performing model built with the svmPoly algorithm. Train AUROC (black line) is determined using 10-fold cross-validation and test AUROC evaluated on the independent test set (25% of the initial dataset). c Top variables that contribute to the model and are increased in high relative to low responders. d Frequency of selected variables on day 28pso (bars show mean with SEM). Mann–Whitney test (p < 0.05). (e) Neutralisation assay against wild-type SARS-CoV2 (Victoria), and two novel variants (B1.1.7 and B1.351) between high and low responders on two timepoints (one and 6 months pso). Plots show mean with SEM. A Kruskal-Wallis (one-way ANOVA on ranks), with Dunn’s multiple comparison test (p < 0.05) was performed (ns; adjusted P value > 0.9999).

References

    1. Berlin D. A., Gulick R. M., Martinez F. J., Severe Covid-19. N. Engl. J. Med.10.1056/NEJMcp2009575 (2020). - PubMed
    1. Eyre DW, et al. Differential occupational risks to healthcare workers from SARS-CoV-2 observed during a prospective observational study. eLife. 2020;9:e60675. - PMC - PubMed
    1. Fan V. S., et al Risk Factors for testing positive for SARS-CoV-2 in a national US healthcare system. Clin. Infect. Dis.10.1093/cid/ciaa1624 (2020).
    1. Peng Y, et al. Broad and strong memory CD4+ and CD8+ T cells induced by SARS-CoV-2 in UK convalescent individuals following COVID-19. Nat. Immunol. 2020;21:1336–1345. - PMC - PubMed
    1. Ogbe A, et al. T cell assays differentiate clinical and subclinical SARS-CoV-2 infections from cross-reactive antiviral responses. Nat. Commun. 2021;12:2055. - PMC - PubMed

Publication types

Supplementary concepts