

Data-driven identification of communities with high levels of tuberculosis infection in the Democratic Republic of Congo
- PMID: 35273212
- PMCID: PMC8913845
- DOI: 10.1038/s41598-022-07633-2
Data-driven identification of communities with high levels of tuberculosis infection in the Democratic Republic of Congo
Abstract
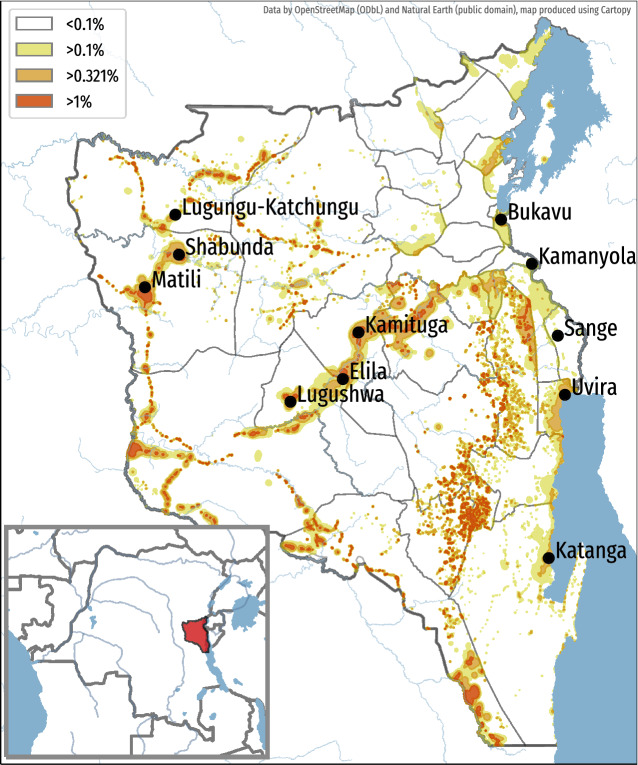
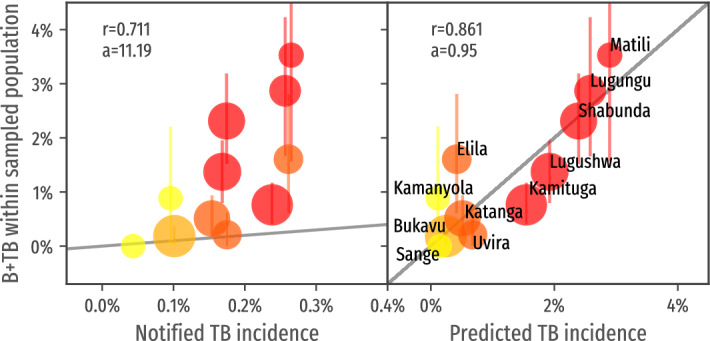
When access to diagnosis and treatment of tuberculosis is disrupted by poverty or unequal access to health services, marginalized communities not only endorse the burden of preventable deaths, but also suffer from the dramatic consequences of a disease which impacts one's ability to access education and minimal financial incomes. Unfortunately, these pockets are often left unrecognized in the flow of data collected in national tuberculosis reports, as localized hotspots are diluted in aggregated reports focusing on notified cases. Such system is therefore profoundly inadequate to identify these marginalized groups, which urgently require adapted interventions. We computed an estimated incidence-rate map for the South-Kivu province of the Democratic Republic of Congo, a province of 5.8 million inhabitants, leveraging available data including notified incidence, level of access to health care and exposition to identifiable risk factors. These estimations were validated in a prospective multi-centric study. We could demonstrate that combining different sources of openly-available data allows to precisely identify pockets of the population which endorses the biggest part of the burden of disease. We could precisely identify areas with a predicted annual incidence higher than 1%, a value three times higher than the national estimates. While hosting only 2.5% of the total population, we estimated that these areas were responsible for 23.5% of the actual tuberculosis cases of the province. The bacteriological results obtained from systematic screenings strongly correlated with the estimated incidence (r = 0.86), and much less with the incidence reported by epidemiological reports (r = 0.77), highlighting the inadequacy of these reports when used alone to guide disease control programs.
© 2022. The Author(s).
Conflict of interest statement
E.A. provided strategic advice to Savics from October 2019 to March 2020. The rest of the authors have no conflict of interest.
Figures
Similar articles
-
Prediction of Under-Detection of Paediatric Tuberculosis in the Democratic Republic of Congo: Experience of Six Years in the South-Kivu Province.PLoS One. 2017 Jan 6;12(1):e0169014. doi: 10.1371/journal.pone.0169014. eCollection 2017. PLoS One. 2017. PMID: 28060846 Free PMC article.
-
Effect of HIV-1 infection on tuberculosis and fertility in a large workforce in Kinshasa, Democratic Republic of the Congo.AIDS Patient Care STDS. 2000 Jun;14(6):297-304. doi: 10.1089/10872910050046313. AIDS Patient Care STDS. 2000. PMID: 10897501
-
An assessment of caprine tuberculosis prevalence in Lubumbashi slaughterhouse, Democratic Republic of Congo.Trop Anim Health Prod. 2017 Apr;49(4):875-878. doi: 10.1007/s11250-017-1252-5. Epub 2017 Mar 3. Trop Anim Health Prod. 2017. PMID: 28258542
-
Serious fungal diseases in Democratic Republic of Congo - Incidence and prevalence estimates.Mycoses. 2021 Oct;64(10):1159-1169. doi: 10.1111/myc.13339. Epub 2021 Jun 25. Mycoses. 2021. PMID: 34133799 Review.
-
Evaluation of Early Warning, Alert and Response System for Ebola Virus Disease, Democratic Republic of the Congo, 2018-2020.Emerg Infect Dis. 2021 Dec;27(12):2988-2998. doi: 10.3201/eid2712.210290. Emerg Infect Dis. 2021. PMID: 34808084 Free PMC article. Review.
Cited by
-
Predicting communities with high tuberculosis case-finding efficiency to optimise resource allocation in Pakistan: comparing the performance of a negative binomial spatial lag model with a Bayesian machine-learning model.BMJ Public Health. 2025 Mar 18;3(1):e001424. doi: 10.1136/bmjph-2024-001424. eCollection 2025. BMJ Public Health. 2025. PMID: 40433066 Free PMC article.
-
Analyzing Satellite Imagery to Target Tuberculosis Control Interventions in Densely Urbanized Areas of Kigali, Rwanda: Cross-Sectional Pilot Study.JMIR Public Health Surveill. 2025 Apr 24;11:e68355. doi: 10.2196/68355. JMIR Public Health Surveill. 2025. PMID: 40273403 Free PMC article.
-
Mapping of regions with low tuberculosis notification and estimation of diagnostic gaps in Cameroon, evidence from OpenStreetMap and WorldPop data.Sci Rep. 2025 Feb 10;15(1):4992. doi: 10.1038/s41598-025-87682-5. Sci Rep. 2025. PMID: 39929893 Free PMC article.
-
Pretreatment attrition after rifampicin-resistant tuberculosis diagnosis with Xpert MTB/RIF or ultra in high TB burden countries: a systematic review and meta-analysis.BMJ Glob Health. 2025 Jan 22;10(1):e015977. doi: 10.1136/bmjgh-2024-015977. BMJ Glob Health. 2025. PMID: 39848636 Free PMC article.
-
Factors Affecting the Transition from Paper to Digital Data Collection for Mobile Tuberculosis Active Case Finding in Low Internet Access Settings in Pakistan.Trop Med Infect Dis. 2022 Aug 22;7(8):201. doi: 10.3390/tropicalmed7080201. Trop Med Infect Dis. 2022. PMID: 36006293 Free PMC article.
References
-
- WHO . Global Tuberculosis Report 2019. World Health Organization; 2019.
Publication types
MeSH terms
LinkOut - more resources
Full Text Sources
Medical
