

Anti-SARS-CoV-2 equine F (Ab')2 immunoglobulin as a possible therapy for COVID-19
- PMID: 35273234
- PMCID: PMC8913704
- DOI: 10.1038/s41598-022-07793-1
Anti-SARS-CoV-2 equine F (Ab')2 immunoglobulin as a possible therapy for COVID-19
Abstract
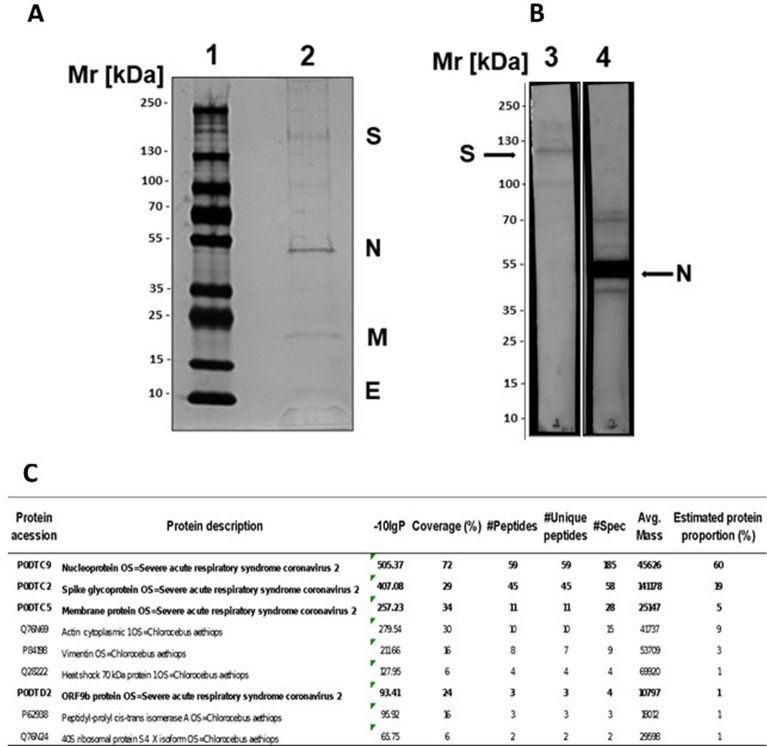
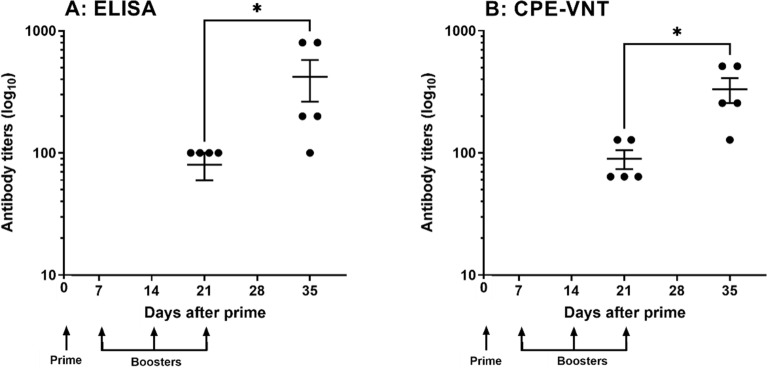
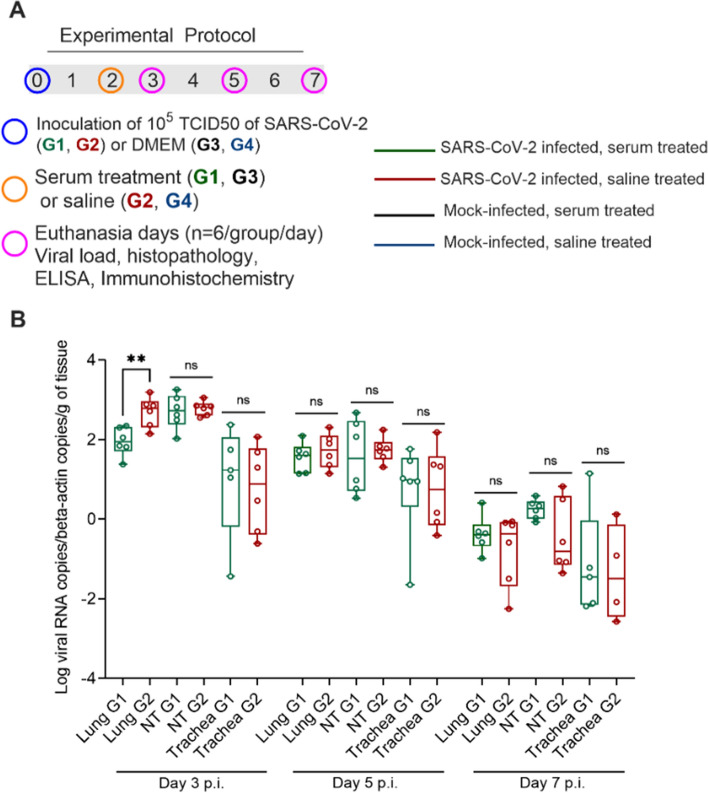
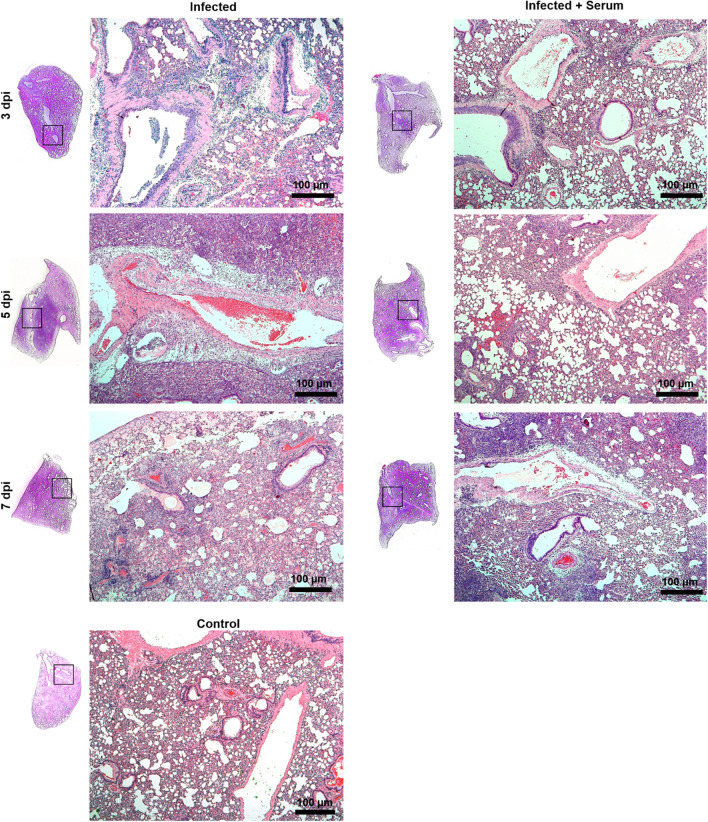
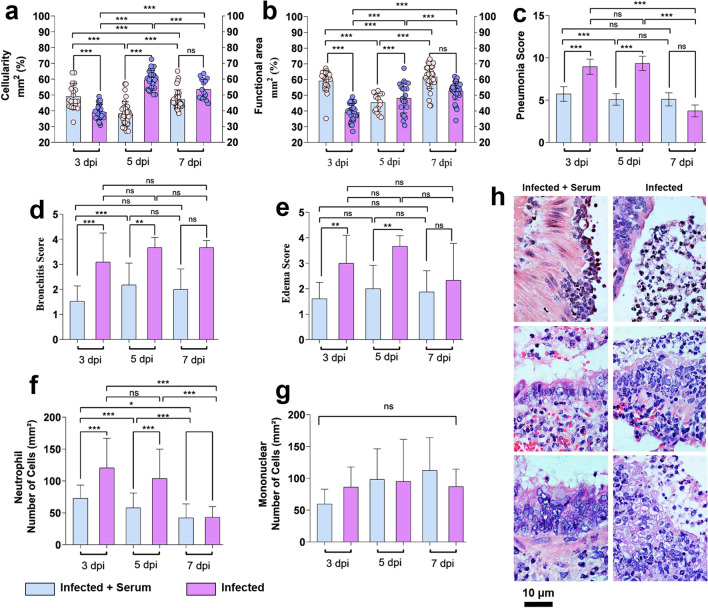
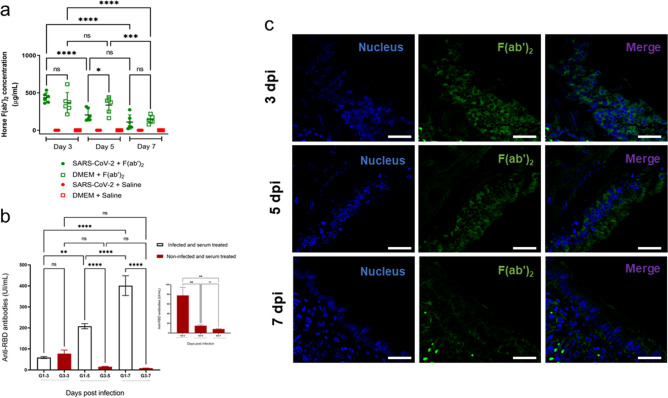
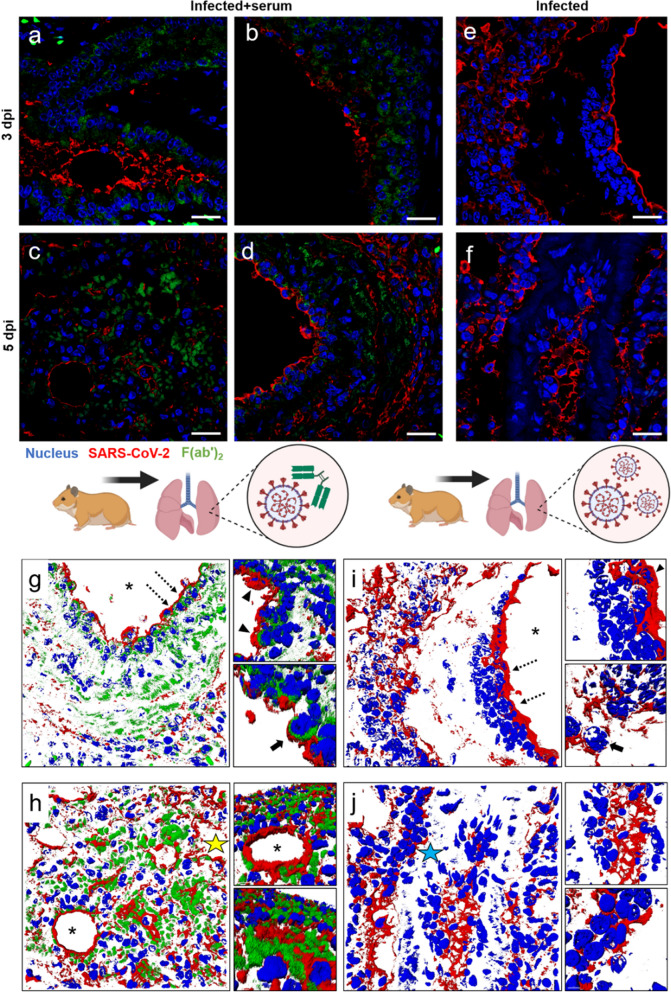
The new outbreak of coronavirus disease 2019 (COVID-19) has infected and caused the death of millions of people worldwide. Intensive efforts are underway around the world to establish effective treatments. Immunoglobulin from immunized animals or plasma from convalescent patients might constitute a specific treatment to guarantee the neutralization of the virus in the early stages of infection, especially in patients with risk factors and a high probability of progressing to severe disease. Worldwide, a few clinical trials using anti-SARS-CoV-2 immunoglobulins from horses immunized with the entire spike protein or fragments of it in the treatment of patients with COVID-19 are underway. Here, we describe the development of an anti-SARS-CoV-2 equine F(ab')2 immunoglobulin using a newly developed SARS-CoV-2 viral antigen that was purified and inactivated by radiation. Cell-based and preclinical assays showed that the F(ab')2 immunoglobulin successfully neutralizes the virus, is safe in animal models, and reduces the severity of the disease in a hamster model of SARS-CoV-2 infection and disease.
© 2022. The Author(s).
Conflict of interest statement
The authors declare no competing interests.
Figures
Similar articles
-
Immunoglobulin fragment F(ab')2 against RBD potently neutralizes SARS-CoV-2 in vitro.Antiviral Res. 2020 Oct;182:104868. doi: 10.1016/j.antiviral.2020.104868. Epub 2020 Jul 10. Antiviral Res. 2020. PMID: 32659292 Free PMC article.
-
Equine immunoglobulin fragment F(ab')2 displays high neutralizing capability against multiple SARS-CoV-2 variants.Clin Immunol. 2022 Apr;237:108981. doi: 10.1016/j.clim.2022.108981. Epub 2022 Mar 17. Clin Immunol. 2022. PMID: 35306171 Free PMC article.
-
PEGylation Prolongs the Half-Life of Equine Anti-SARS-CoV-2 Specific F(ab')2.Int J Mol Sci. 2023 Feb 8;24(4):3387. doi: 10.3390/ijms24043387. Int J Mol Sci. 2023. PMID: 36834803 Free PMC article.
-
Antibody response and therapy in COVID-19 patients: what can be learned for vaccine development?Sci China Life Sci. 2020 Dec;63(12):1833-1849. doi: 10.1007/s11427-020-1859-y. Epub 2020 Dec 1. Sci China Life Sci. 2020. PMID: 33355886 Free PMC article. Review.
-
Convalescent plasma or hyperimmune immunoglobulin for people with COVID-19: a rapid review.Cochrane Database Syst Rev. 2020 May 14;5(5):CD013600. doi: 10.1002/14651858.CD013600. Cochrane Database Syst Rev. 2020. Update in: Cochrane Database Syst Rev. 2020 Jul 10;7:CD013600. doi: 10.1002/14651858.CD013600.pub2. PMID: 32406927 Free PMC article. Updated.
Cited by
-
Passive immunization with equine RBD-specific Fab protects K18-hACE2-mice against Alpha or Beta variants of SARS-CoV-2.Front Immunol. 2022 Aug 15;13:948431. doi: 10.3389/fimmu.2022.948431. eCollection 2022. Front Immunol. 2022. PMID: 36091051 Free PMC article.
-
Equine Anti-SARS-CoV-2 Serum (ECIG) Binds to Mutated RBDs and N Proteins of Variants of Concern and Inhibits the Binding of RBDs to ACE-2 Receptor.Front Immunol. 2022 Jul 11;13:871874. doi: 10.3389/fimmu.2022.871874. eCollection 2022. Front Immunol. 2022. PMID: 35898497 Free PMC article.
-
Long-Term Maintenance of High Neutralizing Anti-SARS-CoV-2 Antibodies Titres in Mares' Milk and Offspring Serum After Pregnant Mares Immunization With SARS-CoV-2 Spike Protein.Vet Med Sci. 2025 Sep;11(5):e70488. doi: 10.1002/vms3.70488. Vet Med Sci. 2025. PMID: 40699548 Free PMC article.
-
Proteomic Analysis Identifies Molecular Players and Biological Processes Specific to SARS-CoV-2 Exposure in Endothelial Cells.Int J Mol Sci. 2022 Sep 9;23(18):10452. doi: 10.3390/ijms231810452. Int J Mol Sci. 2022. PMID: 36142365 Free PMC article.
-
Multidisciplinary recommendations for the management of CAR-T recipients in the post-COVID-19 pandemic era.Exp Hematol Oncol. 2023 Jul 27;12(1):66. doi: 10.1186/s40164-023-00426-x. Exp Hematol Oncol. 2023. PMID: 37501090 Free PMC article. Review.
References
-
- JHUM. COVID-19 Dashboard by the Center for Systems Science and Engineering (CSSE) at Johns Hopkins University (JHU). (2020). https://coronavirus.jhu.edu/map.html. (accessed 20 Jan 2007).
-
- Lopardo G, et al. RBD-specific polyclonal F(ab´)2 fragments of equine antibodies in patients with moderate to severe COVID-19 disease: A randomized, multicenter, double-blind, placebo-controlled, adaptive phase 2/3 clinical trial. EClinicalMedicine. 2021;34:100843. doi: 10.1016/j.eclinm.2021.100843. - DOI - PMC - PubMed
Publication types
MeSH terms
Substances
Grants and funding
- 305056/2019-0/Ministry of Science, Technology and Innovation | Conselho Nacional de Desenvolvimento Científico e Tecnológico (National Council for Scientific and Technological Development)
- 301358/2017-6/Ministry of Science, Technology and Innovation | Conselho Nacional de Desenvolvimento Científico e Tecnológico (National Council for Scientific and Technological Development)
- 401346/2020-0/Ministry of Science, Technology and Innovation | Conselho Nacional de Desenvolvimento Científico e Tecnológico (National Council for Scientific and Technological Development)
- 303197/2017-0/Ministry of Science, Technology and Innovation | Conselho Nacional de Desenvolvimento Científico e Tecnológico (National Council for Scientific and Technological Development)
- 2020/05293-0/Fundação de Amparo à Pesquisa do Estado de São Paulo (São Paulo Research Foundation)
LinkOut - more resources
Full Text Sources
Medical
Miscellaneous
