. 2022 Mar 10;12(1):3905.
doi: 10.1038/s41598-022-07963-1.

Thermometric lateral flow immunoassay with colored latex beads as reporters for COVID-19 testing

Affiliations

Thermometric lateral flow immunoassay with colored latex beads as reporters for COVID-19 testing

Terumitsu Azuma et al. Sci Rep. .

Abstract

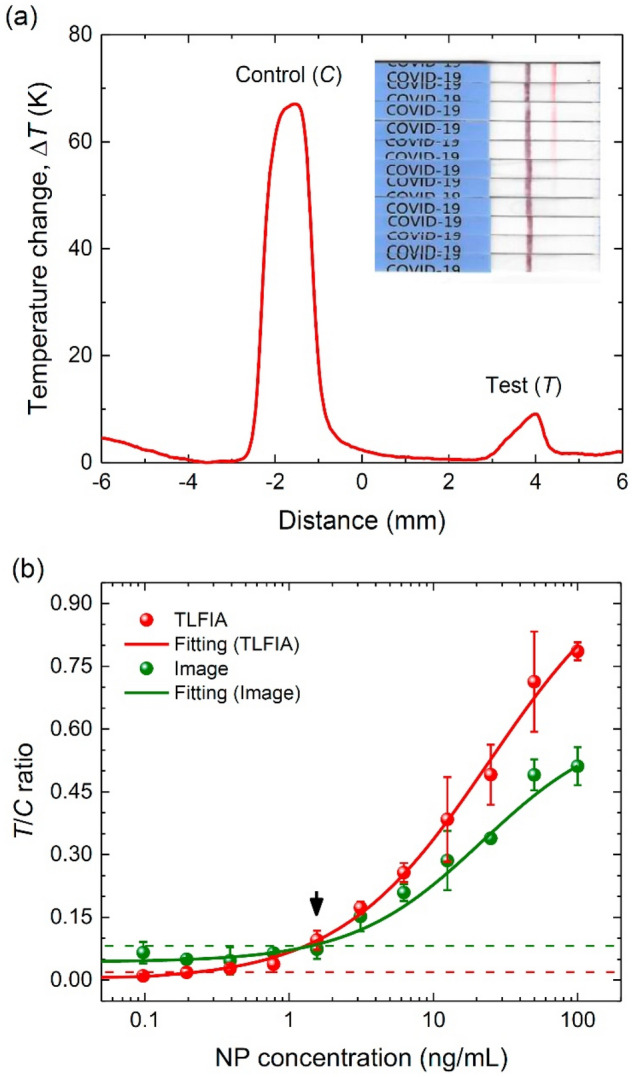
Temperature sensing is a promising method of enhancing the detection sensitivity of lateral flow immunoassay (LFIA) for point-of-care testing. A temperature increase of more than 100 °C can be readily achieved by photoexcitation of reporters like gold nanoparticles (GNPs) or colored latex beads (CLBs) on LFIA strips with a laser power below 100 mW. Despite its promise, processes involved in the photothermal detection have not yet been well-characterized. Here, we provide a fundamental understanding of this thermometric assay using non-fluorescent CLBs as the reporters deposited on nitrocellulose membrane. From a measurement for the dependence of temperature rises on the number density of membrane-bound CLBs, we found a 1.3-fold (and 3.2-fold) enhancement of the light absorption by red (and black) latex beads at 520 nm. The enhancement was attributed to the multiple scattering of light in this highly porous medium, a mechanism that could make a significant impact on the sensitivity improvement of LFIA. The limit of detection was measured to be 1 × 10⁵ particles/mm2. In line with previous studies using GNPs as the reporters, the CLB-based thermometric assay provides a 10× higher sensitivity than color visualization. We demonstrated a practical use of this thermometric immunoassay with rapid antigen tests for COVID-19.


Conflict of interest statement

The authors declare no competing interests.

Figures

Figure 1
Figure 1
SEM images of NC membrane. SEM analysis of the structure of NC membrane with a magnification of 570× (left) and 6600× (right). Scale bars: 100 µm (left) and 10 µm (right).
Figure 2
Figure 2
Instrument layout of the TLFIA reader. Major components of the instrument are labeled in the figure and described in text. The instrument is portable, having dimensions of 32 cm (length) × 20 cm (width) × 12 cm (height).
Figure 3
Figure 3
Temperature profile of a laser-irradiated CLB spot on NC membrane. The temperature is measured by using the infrared camera when the motorized translation stage moves along the x direction as defined in Fig. 2. The corresponding optical image of the spot made of red latex beads is shown in the inset. The number density of the particles deposited on the membrane is 7.5 × 1011 particles/cm3.
Figure 4
Figure 4
Spatial and temporal temperature profiles of laser-irradiated CLBs on NC membrane. (a) Temperature changes of laser-irradiated red latex beads on NC membrane in x and y directions, defined in Fig. 2. The number density of the particles deposited on the membrane is 7.5 × 1011 particles/cm3. Inset: thermal image of a laser-irradiated spot. (b) Time-dependent temperature changes of laser-irradiated red latex beads on NC membrane. Inset: enlarged view of the time evolutions over 0–1 s.
Figure 5
Figure 5
Extinction spectra of CLBs in solution. The spectra are measured for red and black latex beads suspended in water and 90% glycerol/water. Concentrations of both beads in the solutions are 0.004%. Red and black open circles are calculated scattering cross sections at 520 nm, predicted by Mie calculations for undyed polystyrene microspheres (diameters of 0.41 μm and 0.42 μm) in 90% glycerol/water.
Figure 6
Figure 6
Photothermal detection of CLBs on NC membrane. (a) Variations of the spatial temperature profiles of laser-irradiated red latex beads on NC membrane with their number densities. (b) Dependence of the peak temperature rises of laser-irradiated red and black latex beads on their number densities. The effective absorption cross sections of both particles are obtained by fitting the experimental data to Eq. (5) in text. Inset: enlarged view of the data in low number density regions. Solid curves are best fits of the experimental data with a linear function. The small ΔT offset at N = 0 is due to laser heating of blank samples on NC membrane.
Figure 7
Figure 7
COVID-19 testing with TLFIA. (a) Temperature profile of CLBs captured on a COVID-19 antigen test strip, obtained with the TLFIA reader. The assay is conducted for NPs of the SARS-CoV-2 virus at the concentration of 1.56 ng/mL. Integrated areas of the two peaks denoted by “Control (C)” and “Test (T)” are calculated to obtain the T/C ratio. Inset: photograph of COVID-19 antigen test strips after the assays over the NP concentration range of 100–0 ng/mL (top to bottom) through twofold serial dilution. (b) Comparative LFIA for SARS-CoV-2 NPs by thermometric detection, image analysis, and color visualization with the rapid antigen test strips for COVID-19. Solid curves are best fits of the experimental data to logistic functions. The black arrow indicates the LOD of visual inspection and the green and red dashed lines indicate the LODs of image analysis and TLFIA, respectively.

References

    1. Wiersinga WJ, Rhodes A, Cheng AC, Peacock SJ, Prescott HC. Pathophysiology, transmission, diagnosis, and treatment of coronavirus disease 2019 (COVID-19): A review. JAMA. 2020;324:782–793. doi: 10.1001/jama.2020.12839. - DOI - PubMed
    1. Udugama B, et al. Diagnosing COVID-19: The disease and tools for detection. ACS Nano. 2020;14:3822–3835. doi: 10.1021/acsnano.0c02624. - DOI - PubMed
    1. Hsiao WW-W, et al. Recent advances in novel lateral flow technologies for detection of COVID-19. Biosensors. 2021;11:295. doi: 10.3390/bios11090295. - DOI - PMC - PubMed
    1. Castro M, Ares S, Cuesta JA, Manrubia S. The turning point and end of an expanding epidemic cannot be precisely forecast. Proc. Natl. Acad. Sci. USA. 2020;117:26190–26196. doi: 10.1073/pnas.2007868117. - DOI - PMC - PubMed
    1. Vashist, S. K. & Luong, J. H. T. (eds). Handbook of Immunoassay Technologies: Approaches, Performances, and Applications. https://www.sciencedirect.com/book/9780128117620/handbook-of-immunoassay.... Accessed 22 February 2022. (Academic Press, 2018).

Publication types