Review
. 2022 Mar 10;5(1):220.
doi: 10.1038/s42003-022-03175-5.

Deciphering tissue structure and function using spatial transcriptomics

Affiliations
Review

Deciphering tissue structure and function using spatial transcriptomics

Benjamin L Walker et al. Commun Biol. .

Abstract

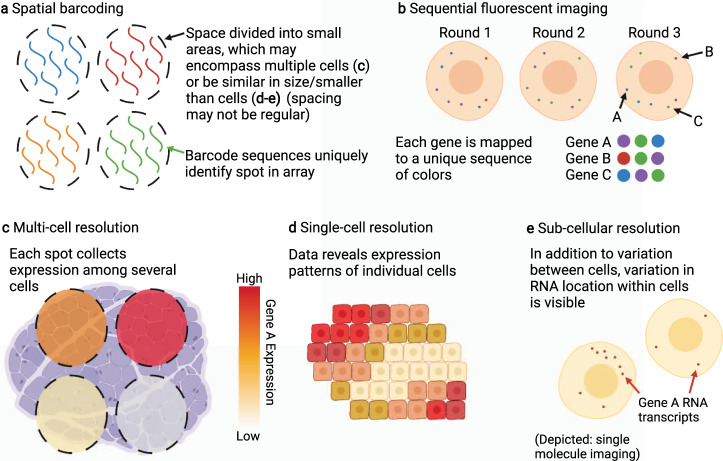
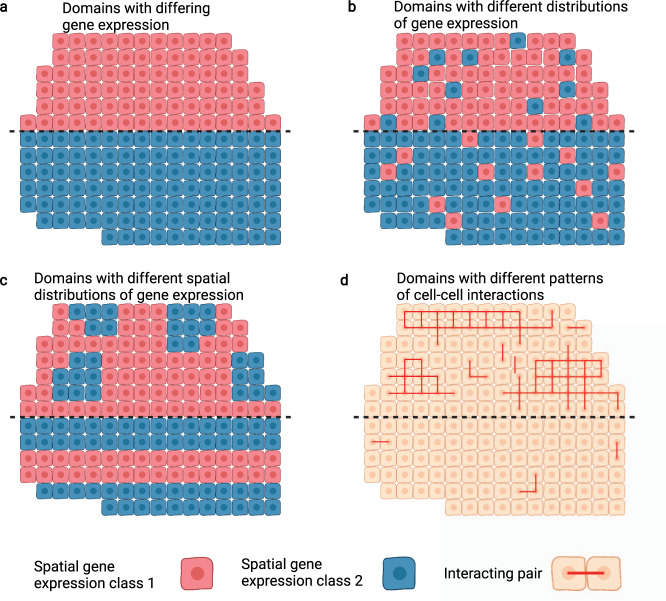
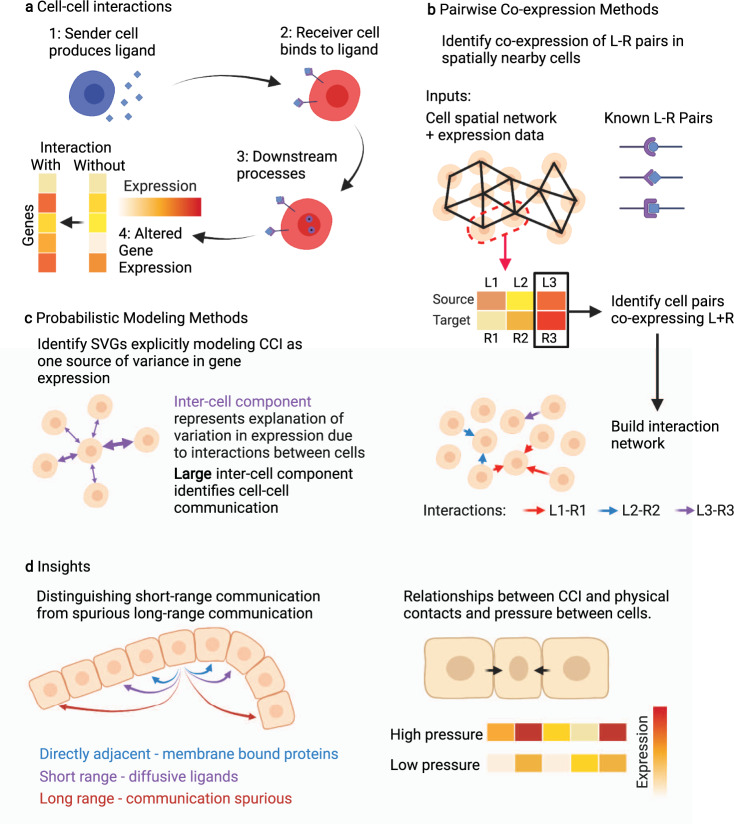
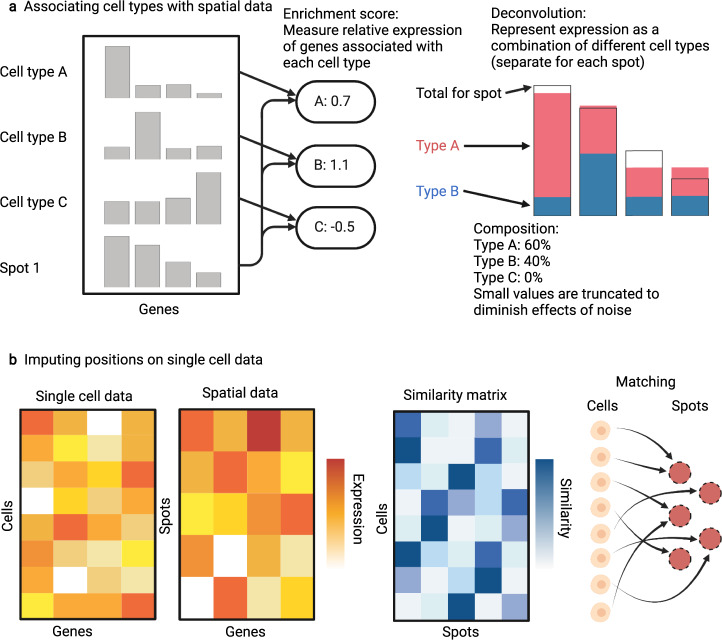
The rapid development of spatial transcriptomics (ST) techniques has allowed the measurement of transcriptional levels across many genes together with the spatial positions of cells. This has led to an explosion of interest in computational methods and techniques for harnessing both spatial and transcriptional information in analysis of ST datasets. The wide diversity of approaches in aim, methodology and technology for ST provides great challenges in dissecting cellular functions in spatial contexts. Here, we synthesize and review the key problems in analysis of ST data and methods that are currently applied, while also expanding on open questions and areas of future development.


Conflict of interest statement

The authors declare no competing interests.

Figures

Fig. 1
Fig. 1. Spatial Transcriptomics Data: Collection and Resolutions.
ST data can be collected with various methods and resolutions. a Illustration of spatial barcoding, in which spatially-identified barcodes are arranged and then used to tag RNA molecules in tissue. Compare with c, but note these methods are not restricted to multi-cell resolution. b Illustration of sequential fluorescent imaging, where RNA molecules are sequentially tagged with different color fluorescent probes and the color sequences are used to identify RNA species. In general, this data is collected at sub-cellular resolution, as show in e, but is frequently combined with cell segmentation to create single-cell data, as in d. c Multi-cell resolution spots, in which measured expression at one spatial location is collected across a number of possibly heterogeneous cells. d In single-cell resolution data, each spatial location corresponds to one cell. This allows for spatial analysis of cell identity and a single-cell understanding of tissue structure and cell-cell communications. e One type of sub-cellular resolution data is single-molecule imaging. Note the presence of information both in the number of distinct RNA molecules of one type in a cell, and also the localization of those molecules within the cell. Sub-cellular resolution data may be combined with cell segmentation to produce single-cell data to facilitate corresponding analysis.
Fig. 2
Fig. 2. Illustration of different traits that can separate spatial regions.
ad Dotted line indicates division between two regions. Red and blue cells indicate groups with consistent expression across some set of spatially variable genes. a Regions are characterized by different gene expression, equivalent to the groups identified by cluster analysis such as the Louvain algorithm on non-spatial data. b Regions are not entirely homogeneous, but instead differ in distribution of observed expression. c Regions have similar distributions, but differ in the spatial patterning of gene expression. d Red lines connect interacting cells. Beyond cell type indicated by gene expression, regions may be distinguished by higher-level properties such as patterns of cell-cell interactions. Performing region identification downstream of other analyses could allow for detecting variance in such properties.
Fig. 3
Fig. 3. Illustration of techniques in extracting cell-cell interactions from ST data.
a Cell-cell interactions occur when transfer of a ligand from a sender cell to a receiver cell triggers a downstream response, ultimately leading to changes in gene expression in the receiver cell. b Common techniques identify co-expression of known L-R pairs in cells adjacent in a spatial proximity network, and use this to mark interactions between cells. c Alternatively, some methods probabilistically capture different sources explaining variance in spatial gene expression, including terms capturing intra- and inter-cellular effects. When inter-cellular effects dominate a particular gene’s expression, it is indicative of cell-cell interaction. d Insights made from CCI analysis of spatial data include the ability to determine interactions of a particular cell by filtering out spurious long-range connections, and investigations into the relationship between L-R interactions, and mechanistic interactions and cell proximity.
Fig. 4
Fig. 4. Enhancing spatial transcriptomics data with scRNA-seq data.
This analysis step augments ST data using scRNA-seq data. a By using scRNA-seq data onto the spatial dataset, the composition of individual spots can be understood in terms of single cells, such as by computing enrichment scores, which measure the expression of certain gene sets (such as marker genes from a particular cell type) relative to the norm, or through deconvolution, which decomposes the overall expression data from a spatial spot into a combination of contributions from several cell types. b scRNA-seq data can be used to increase resolution of multi-cell ST data, by mapping cells to spatial locations, producing a spatial dataset at single-cell resolution. The primary choices in such methods are the computation of similarity scores between cells and spots, and the method by which matching is computed from the similarity matrix.

References

    1. Marx V. Method of the year: spatially resolved transcriptomics. Nat. Methods. 2021;18:9–14. - PubMed
    1. Larsson L, Frisén J, Lundeberg J. Spatially resolved transcriptomics adds a new dimension to genomics. Nat. Methods. 2021;18:15–18. - PubMed
    1. Longo, S. K., Guo, M. G., Ji, A. L. & Khavari, P. A. Integrating single-cell and spatial transcriptomics to elucidate intercellular tissue dynamics. Nat. Rev. Genet. 1–18 (2021). 10.1038/s41576-021-00370-8. - PMC - PubMed
    1. Rao A, Barkley D, França GS, Yanai I. Exploring tissue architecture using spatial transcriptomics. Nature. 2021;596:211–220. - PMC - PubMed
    1. Moses, L. & Pachter, L. Museum of Spatial Transcriptomics. Biorxiv 2021.05.11.443152 (2021). 10.1101/2021.05.11.443152.

Publication types