. 2022 Mar 10;5(1):163.
doi: 10.1038/s42003-022-03107-3.

Climate-change-driven growth decline of European beech forests

Affiliations

Climate-change-driven growth decline of European beech forests

Edurne Martinez Del Castillo et al. Commun Biol. .

Abstract

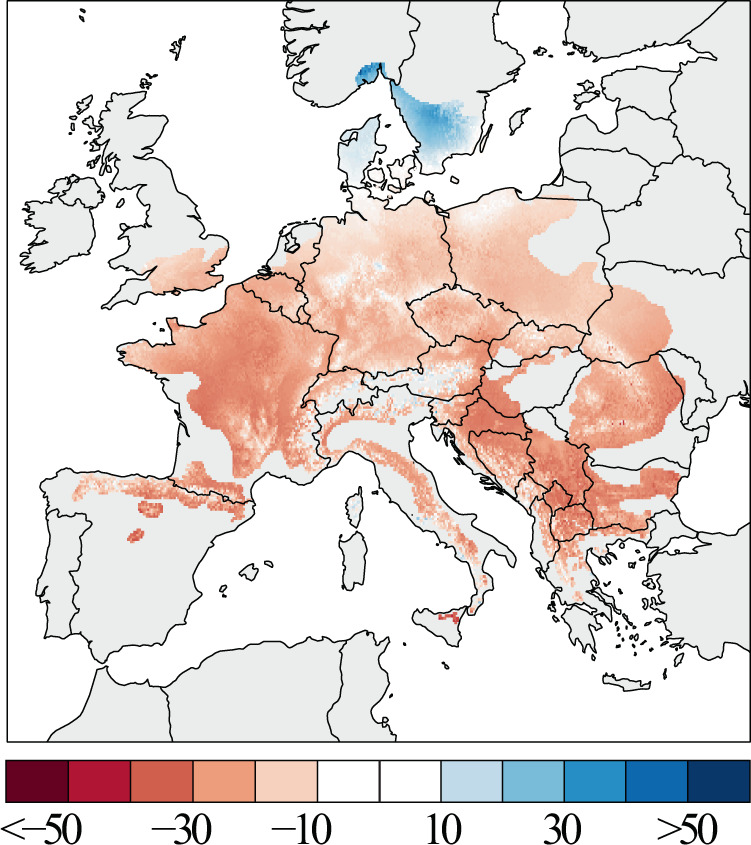
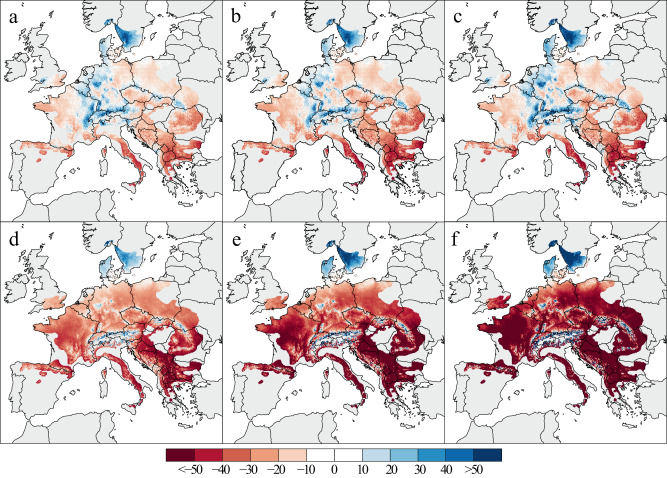
The growth of past, present, and future forests was, is and will be affected by climate variability. This multifaceted relationship has been assessed in several regional studies, but spatially resolved, large-scale analyses are largely missing so far. Here we estimate recent changes in growth of 5800 beech trees (Fagus sylvatica L.) from 324 sites, representing the full geographic and climatic range of species. Future growth trends were predicted considering state-of-the-art climate scenarios. The validated models indicate growth declines across large region of the distribution in recent decades, and project severe future growth declines ranging from -20% to more than -50% by 2090, depending on the region and climate change scenario (i.e. CMIP6 SSP1-2.6 and SSP5-8.5). Forecasted forest productivity losses are most striking towards the southern distribution limit of Fagus sylvatica, in regions where persisting atmospheric high-pressure systems are expected to increase drought severity. The projected 21st century growth changes across Europe indicate serious ecological and economic consequences that require immediate forest adaptation.


Conflict of interest statement

The authors declare no competing interests.

Figures

Fig. 1
Fig. 1. Spatial and climatic range of beech sites.
a Geographical distribution of the 324 study sites (black dots) in the natural distribution range of European beech (green area based on the EUFORGEN map; see Supplementary Data 2 for details). b Climatic envelope of European beech sampling sites, considering annual temperature and precipitation. Sites are labelled according to the environmental zones detailed in Metzger et al..
Fig. 2
Fig. 2. Spatial patterns of beech growth during the last decades.
Mean estimates of BAI (in mm2) from 1955–1985 (a) and 1986–2016 (b), calculated for a theoretical tree derived from a 324-site chronology network.
Fig. 3
Fig. 3. The spatial pattern of beech growth changes across Europe.
Tree growth changes are expressed in percent BAI change from 1986 to 2016 relative to the 1955–1985 period mean.
Fig. 4
Fig. 4. Relative changes in tree growth.
Changes are projected under SSP1-2.6 (ac) and SSP5-8.5 (df) CMIP6 climate scenarios for different periods: 2020–2050 (a, d), 2040–2070 (b, e), and 2060–2090 (c, f) In this panel, BAI changes were expressed in percentage of change compared to the 1986–2016 period.

References

    1. IPCC. IPCC Fifth Assessment Report (AR5). 10–12 (IPCC, 2014).
    1. Cailleret M, et al. A synthesis of radial growth patterns preceding tree mortality. Glob. Chang. Biol. 2017;23:1675–1690. - PubMed
    1. Forzieri G, et al. Emergent vulnerability to climate-driven disturbances in European forests. Nat. Commun. 2021;12:1–12. - PMC - PubMed
    1. Bonan GB. Forests and climate change: forcings, feedbacks, and the climate benefits of forests. Science. 2008 doi: 10.1126/science.1155121. - DOI - PubMed
    1. Buras A, Menzel A. Projecting tree species composition changes of European forests for 2061–2090 under RCP 4.5 and RCP 8.5 scenarios. Front. Plant Sci. 2019;9:1–13. - PMC - PubMed

Publication types