. 2022 Mar 10;5(1):221.
doi: 10.1038/s42003-022-03162-w.

Atomic force microscopy-single-molecule force spectroscopy unveils GPCR cell surface architecture

Affiliations

Atomic force microscopy-single-molecule force spectroscopy unveils GPCR cell surface architecture

Etienne Dague et al. Commun Biol. .

Abstract

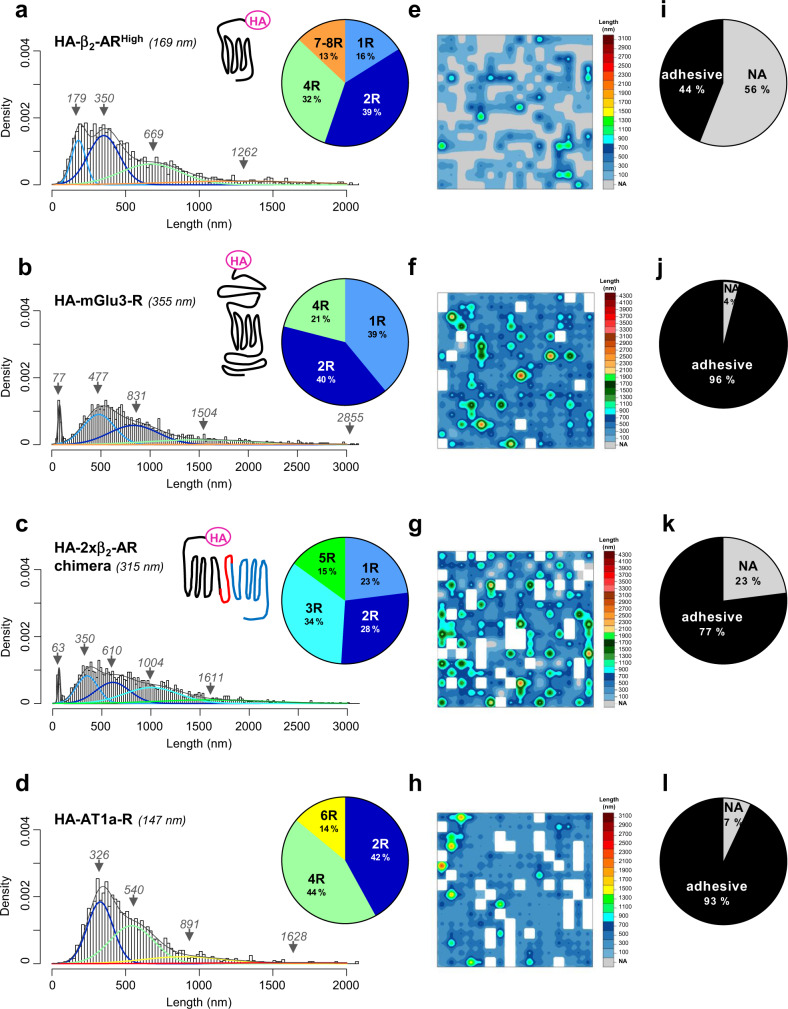
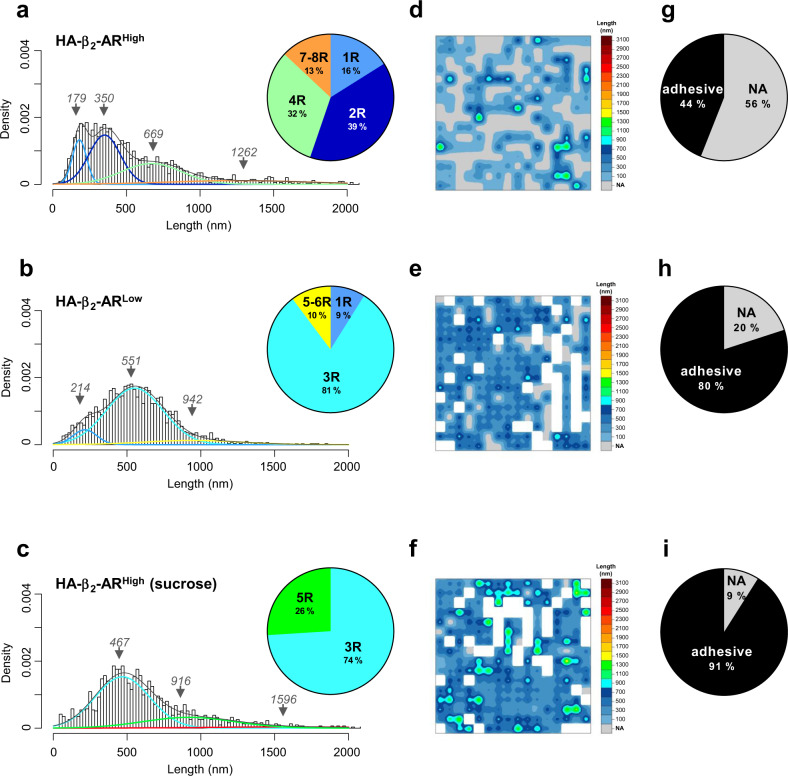
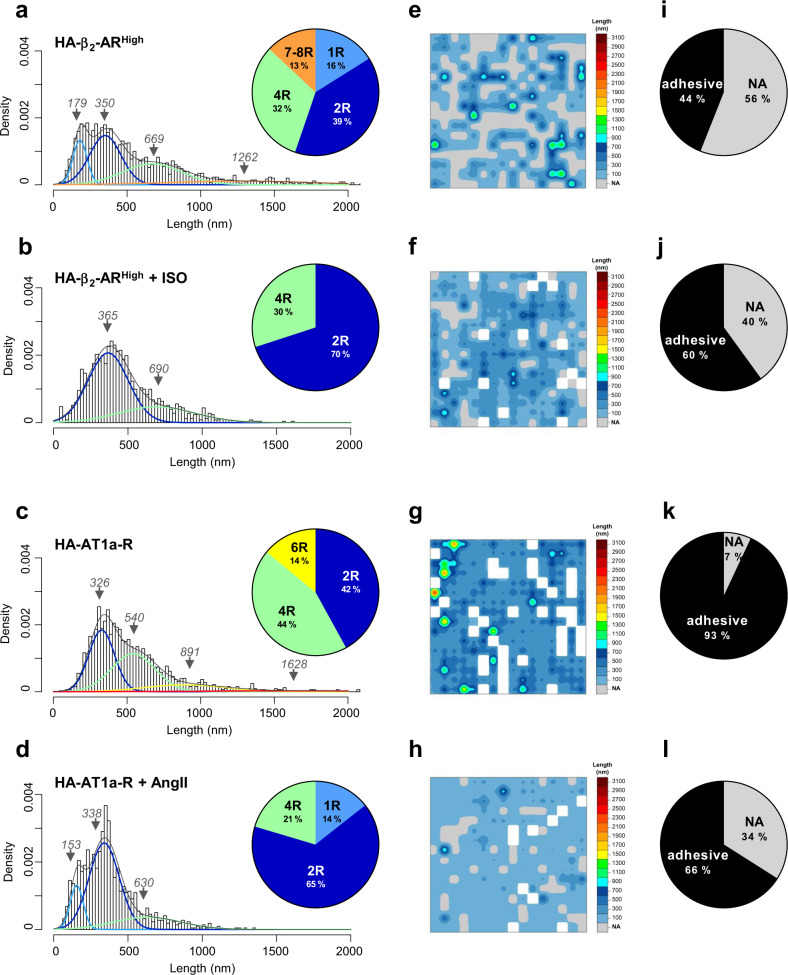
G protein-coupled receptors (GPCRs) form the largest family of cell surface receptors. Despite considerable insights into their pharmacology, the GPCR architecture at the cell surface still remains largely unexplored. Herein, we present the specific unfolding of different GPCRs at the surface of living mammalian cells by atomic force microscopy-based single molecule force spectroscopy (AFM-SMFS). Mathematical analysis of the GPCR unfolding distances at resting state revealed the presence of different receptor populations relying on distinct oligomeric states which are receptor-specific and receptor expression-dependent. Moreover, we show that the oligomer size dictates the receptor spatial organization with nanoclusters of high-order oligomers while lower-order complexes spread over the whole cell surface. Finally, the receptor activity reshapes both the oligomeric populations and their spatial arrangement. These results add an additional level of complexity to the GPCR pharmacology until now considered to arise from a single receptor population at the cell surface.


Conflict of interest statement

The authors declare no competing interests.

Figures

Fig. 1
Fig. 1. SMFS-based GPCR unfolding at the living WTT-CHO cell surface.
a Schematics of the AFM tip functionalization: (1) the silicon nitride AFM tip, and the sequential addition of (2) amine functions, (3) dendrimers, and (4) anti-HA antibodies. b, c, The functionalized AFM tip is approached to the surface of HA-tagged GPCR-expressing WTT-CHO cells and then retracted until rupture (b) on a 3 × 3 µm2 area (16 × 16 pixels), resulting in 256 force versus distance curve (FD curve) recordings. d Schematics of a representative FD curve showing the different steps of the AFM tip approach (blue) and retraction (red). The unfolding distance is measured between the contact point and the point of minimal force.
Fig. 2
Fig. 2. Agonist-dependent and agonist-independent HA-β2-AR activity in WTT-CHO cells.
a WTT-CHO cells were transfected with different amounts (0.1 or 1 µg) of HA-β2-AR-encoding vector (HA-β2-ARLow and HA-β2-ARHigh respectively) or the empty vector (control) and cAMP production was quantified following stimulation with 10 µM isoproterenol (ISO) for 30 min (a) or at basal state (b). When indicated, cells were pretreated with 200 mM sucrose for 1 h to prevent the receptor internalization process. Data represent the mean ± s.e.m. of four independent experiments, each performed in triplicates. The results are expressed as the difference in cAMP level measured in the presence and absence of isoproterenol (isoproterenol-promoted cAMP production) (a) or as basal cAMP levels (b). The statistical comparison was assessed using one-way ANOVA followed by Sidak’s multiple comparisons tests (*p < 0.05; **p < 0.01; ***p < 0.001; n.s. not statistically significant).
Fig. 3
Fig. 3. Force-distance recorded by SMFS in HA-GPCR-non-expressing and expressing WTT-CHO cells.
SMFS experiments using the anti-HA-functionalized AFM tip were conducted on WTT-CHO cells transiently transfected with (a, c, e) the empty vector as a negative control of specificity for HA-GPCR detection or (b, d, f) with 1 µg of HA-β2-AR-encoding vector (HA-β2-ARHigh). a, b The proportions of adhesive and non-adhesive (NA) events detected in the SMFS experiments are shown in the pie charts. c, d Adhesion forces and (e, f) unfolding distances resulting from SMFS performed on one representative cell area (3 × 3 µm2) were depicted as a spatial map. At least nine cells from three independent experiments were analyzed.
Fig. 4
Fig. 4. Mapping GPCR oligomerization and spatial organization using FD-based SMFS at the basal state.
SMFS experiments were conducted at the basal state on WTT-CHO cells transiently transfected with 1 µg of vector encoding (a, e, i) HA-β2-AR (HA-β2-ARHigh), (b, f, j) HA-mGlu3-R, (c, g, k) HA-2xβ2-AR chimera or (d, h, l) HA-AT1a-R. Unfolding distances were analyzed by fitting with a Gaussian mixture according to the BIC-based method. Each Gaussian population was assigned to a GPCR oligomeric state (1 receptor/monomer=1R; 2 receptors/dimer=2R; 3 receptors/trimer=3R…) based on their theoretical length, and Gaussian weight is presented in the pie charts (a, b, c, d). The 256 unfolding distances resulting from one representative cell area (3 × 3 µm2) are depicted as a spatial map (e, f, g, h). The proportion of adhesive and non-adhesive (NA) events are shown in the pie charts (i, j, k, l). For each condition, at least nine cells from at least three independent experiments were analyzed. Note that e, i are similar to Fig. 3f, b to facilitate comparisons.
Fig. 5
Fig. 5. Correlating the GPCR constitutive activity with their oligomerization and spatial organization using FD-based SMFS.
SMFS experiments were conducted on WTT-CHO cells transiently transfected with 1 µg of vector encoding HA-β2-AR (HA-β2-ARHigh) treated (c, f, i) or not (a, d, g) with 200 mM sucrose for 1 h or with 0.1 µg of HA-β2-AR-encoding vector (HA-β2-ARLow) (b, e, h). Unfolding distances were analyzed by fitting with a Gaussian mixture according to the BIC-based method. Each Gaussian population was assigned to a GPCR oligomeric state (1 receptor/monomer=1R; 2 receptors/dimer=2R; 3 receptors/trimer=3R…) based on their theoretical length, and Gaussian weight is presented in the pie charts (a, b, c). The 256 unfolding distances resulting from one representative cell area (3 × 3 µm2) are depicted as a spatial map (d, e, f). The proportions of adhesive and non-adhesive (NA) events are shown in the pie charts (g, h, i). For each condition, at least nine cells from at least three independent experiments were analyzed. Note that a, d, g are similar to Fig. 4a, e, i to facilitate comparisons.
Fig. 6
Fig. 6. Mapping agonist stimulation on GPCR oligomerization and their spatial organization using FD-based SMFS.
SMFS experiments were conducted on WTT-CHO cells transiently transfected with 1 µg of vector encoding HA-β2-AR (HA-β2-ARHigh) or HA-AT1a-R and treated or not (a, e, i, c, g, k) with 10 µM isoproterenol (ISO) (b, f, j) or angiotensin II (AngII) (d, h, l) respectively for 20 min. Unfolding distances were analyzed by fitting with a Gaussian mixture according to the BIC-based method. Each Gaussian population was assigned to a GPCR oligomeric state (1 receptor/monomer=1R; 2 receptors/dimer=2R; 3 receptors/trimer=3R…) based on their theoretical length, and Gaussian weight is presented in the pie charts (a, b, c, d). The 256 unfolding distances resulting from one representative cell area (3 × 3 µm2) are depicted as a spatial map (e, f, g, h). The proportions of adhesive and non-adhesive (NA) events are shown in the pie charts (i, j, k, l). For each condition, at least nine cells from at least three independent experiments were analyzed. Note that a, e, i, c, g, k are similar to Fig. 4a, e, i, d, h, l or Fig. 5a, d, g to facilitate comparisons.

References

    1. Santos R, et al. A comprehensive map of molecular drug targets. Nat. Rev. Drug Disco. 2017;16:19–34. doi: 10.1038/nrd.2016.230. - DOI - PMC - PubMed
    1. Calebiro D, et al. Single-molecule analysis of fluorescently labeled G-protein-coupled receptors reveals complexes with distinct dynamics and organization. Proc. Natl Acad. Sci. USA. 2013;110:743–748. doi: 10.1073/pnas.1205798110. - DOI - PMC - PubMed
    1. Martinez-Munoz L, et al. Separating Actin-Dependent Chemokine Receptor Nanoclustering from Dimerization Indicates a Role for Clustering in CXCR4 Signaling and Function. Mol. Cell. 2018;70:106–119 e10. doi: 10.1016/j.molcel.2018.02.034. - DOI - PubMed
    1. Shen A, et al. Functionally distinct and selectively phosphorylated GPCR subpopulations co-exist in a single cell. Nat. Commun. 2018;9:1050. doi: 10.1038/s41467-018-03459-7. - DOI - PMC - PubMed
    1. Zocher M, Zhang C, Rasmussen SG, Kobilka BK, Muller DJ. Cholesterol increases kinetic, energetic, and mechanical stability of the human beta2-adrenergic receptor. Proc. Natl Acad. Sci. USA. 2012;109:E3463–E3472. doi: 10.1073/pnas.1210373109. - DOI - PMC - PubMed

Publication types

Substances