. 2022 May;14(5):515-522.
doi: 10.1038/s41557-022-00897-1. Epub 2022 Mar 10.

Frequency chasing of individual megadalton ions in an Orbitrap analyser improves precision of analysis in single-molecule mass spectrometry

Affiliations

Frequency chasing of individual megadalton ions in an Orbitrap analyser improves precision of analysis in single-molecule mass spectrometry

Tobias P Wörner et al. Nat Chem. 2022 May.

Abstract

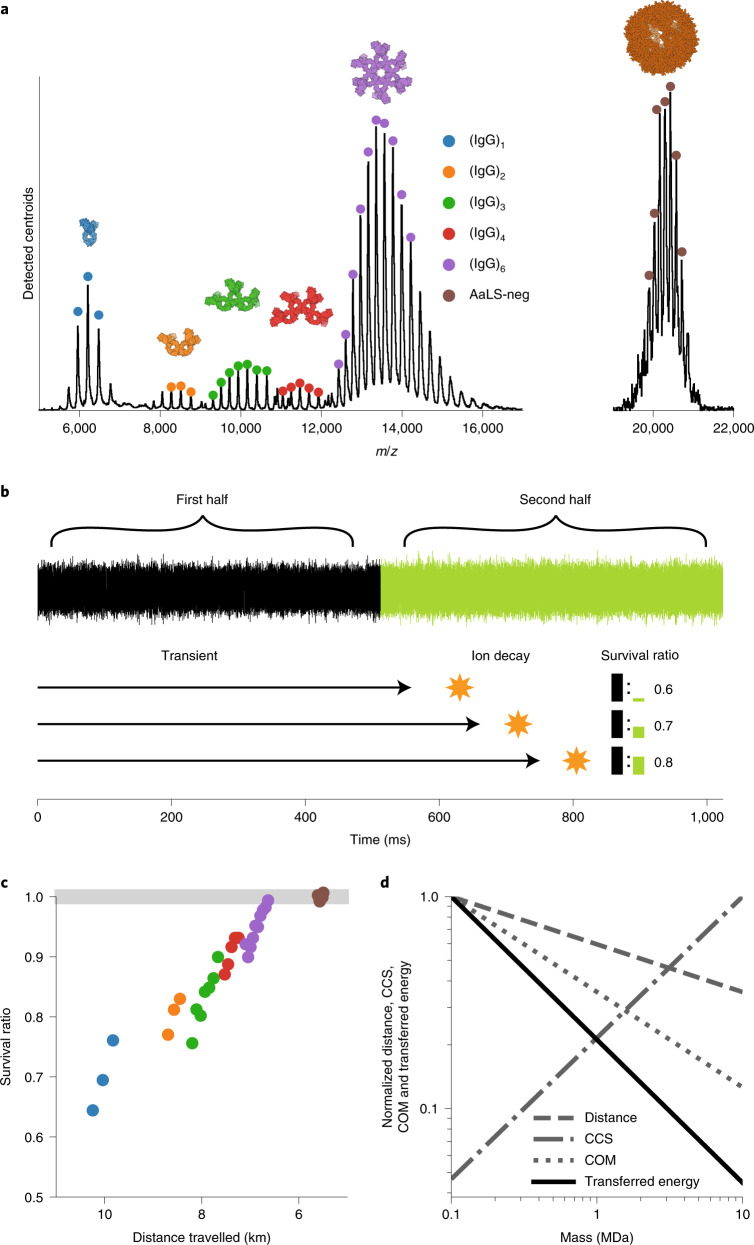
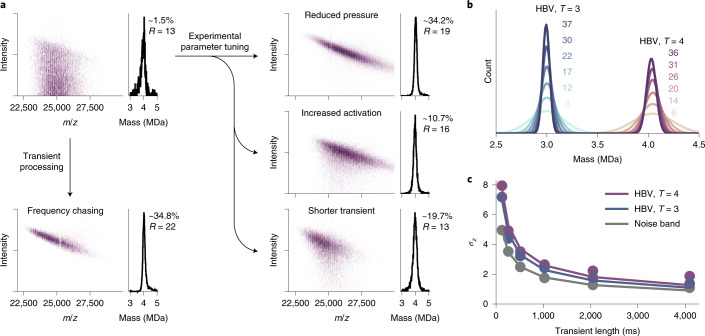
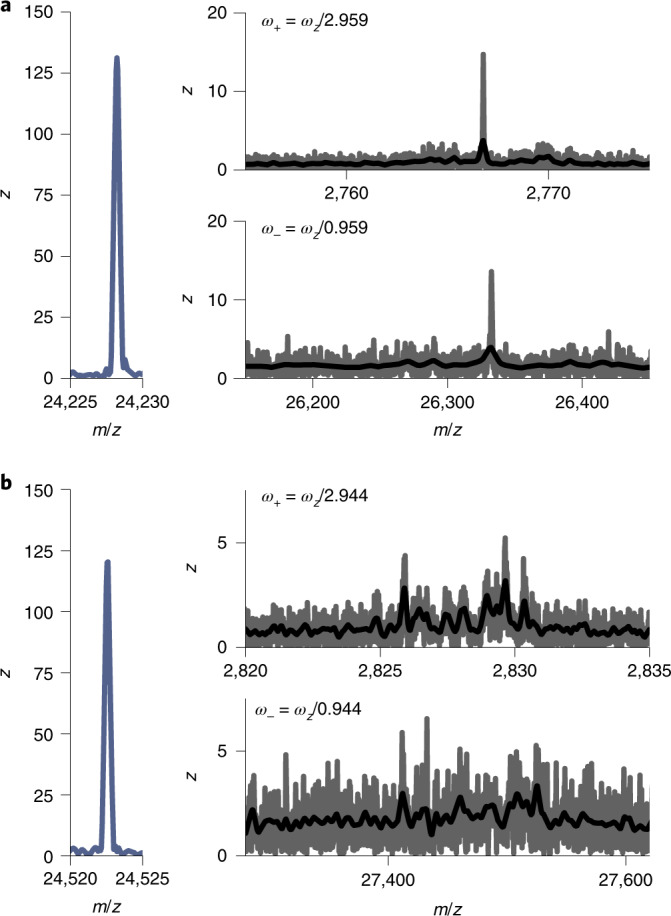
To enhance the performance of charge-detection mass spectrometry, we investigated the behaviour of macromolecular single ions on their paths towards and within the Orbitrap analyser. Ions with a mass beyond one megadalton reach a plateau of stability and can be successfully trapped for seconds, travelling a path length of multiple kilometres, thereby enabling precise mass analysis with an effective resolution of greater than 100,000 at a mass-to-charge ratio of 35,000. Through monitoring the frequency of individual ions, we show that these high-mass ions, rather than being lost from the trap, can gradually lose residual solvent molecules and, in rare cases, a single elementary charge. We also demonstrate that the frequency drift of single ions due to desolvation and charge stripping can be corrected, which improves the effective ion sampling 23-fold and gives a twofold improvement in mass precision and resolution.


Conflict of interest statement

K.A., K.L.F and A.A.M. are employees of Thermo Fisher Scientific, the company that commercializes Orbitrap-based mass analysers. The remaining authors declare no competing interests.

Figures

Fig. 1
Fig. 1. Mass resolution and signal-to-noise in Orbitrap-based CDMS scale with the transient recording time.
a, Ion signals of individual ions for HBV at increasing transient times of 128, 256, 512, 1,024, 2,048 and 4,096 ms (left to right), with a mass resolution for the 4 MDa particles extending from ~3,000 at 128 ms to above 100,000 at 4,096 ms (1 Th = 1 Da e–1). Δ means the full-width at half-height of the peak. Ø means the diameter of the virus particle. b, As in a, signals of individual ions of the 9.4 MDa FHV particles, with R approaching 100,000 at 4,096 ms. c, Average number of collisions the ions experience with background gas (xenon) during the transient time (top), with the green dots showing data for HBV and the purple dots for FHV. Although the number of collisions increases linearly, nearly all high-mass ions seem to survive, as evidenced by the observed resolution and signal-to-noise ratio (bottom) that scale exactly as expected with transient time, reaching a value of ~400 for the 9.4 MDa FHV particles at 4,096 ms. Therefore, for high-mass ions (molecular weight > 1 MDa), even longer transient times would lead to even higher resolution and signal-to-noise levels. Source data
Fig. 2
Fig. 2. Exquisite high stability for megadalton particles in Orbitrap-based native MS.
a, Native MS spectrum constructed from binned detected centroids for the IgG1-RGY oligomers (that is IgG, (IgG)2, (IgG)3, (IgG)4, (IgG)6) and the nanocontainer AaLS-neg, both recorded at similar settings. Ion signals of different particles are colour-coded as annotated. Dots indicate charge states selected for survivability analysis. b, Comparing ion intensity between the first and second half of the transient is used as a proxy for ion survivability. This process is illustrated with ions that decay during different stages of the second half of the transient, resulting in varying ratios for the detected ion signals (black and green bars). c, Comparison of ion survival ratio for different charge states of different IgG oligomers and AaLS-neg using a colour code as in a. d, Favourable scaling of normalized travelled distance, centre-of-mass (COM) and CCS with increasing mass results in sharply reduced energy transfer per surface area, responsible for the plateau of stability reached for megadalton particles. Values on the vertical axis are shown relative to those for a hypothetical particle with a mass of 100 kDa. Source data
Fig. 3
Fig. 3. Distinctive behaviour types of single ions within the Orbitrap analyser.
a, Single-particle mass spectrum with four individual AaLS-neg ions highlighted (colour coded). The 1 s transients were divided into 15 segments and separately analysed. The frequency and thus m/z of each colour-coded ion over these 15 segments was chased (bottom). b, Most single ions displayed no shifts and were stable in frequency and m/z (95% confidence interval of centroiding is shown as coloured area) over the whole transient (annotated by ‘no loss’). A smaller percentage of the ions displayed gradual frequency shifts, and thus m/z shifts, due to a gradual increase in desolvation (annotated by ‘small to large loss’). The loss of several neutral molecules (most likely primarily water and ammonium acetate molecules) leads to observed mass shifts of on average 157 Da and 692 Da, respectively. A few ions experienced a quantized jump in frequency and thus m/z (grey bar indicates broken x axis), to higher m/z, which is attributed to events whereby the ion loses a single charge. Source data
Fig. 4
Fig. 4. High-mass ion activation and decay within the Orbitrap mass analyser.
a, Distribution of the observed total neutral loss for individual ions during their transient (top to bottom) at lower and higher pressure read-outs (2.6 × 10−10 and 8 × 10−10 mbar, left and right, respectively). b, Schematic of an Orbitrap mass analyser highlighting regions where ion activation can occur (top). The plot (bottom) depicts the average number of neutral losses relative to the previous segment under the high-pressure conditions. The black solid line indicates the constant loss rate as expected from an activation during Orbitrap detection. By adding a decaying term for the neutral loss, in line with a sudden activation in the C-trap during injection, the experimental loss can be described quite precisely. This analysis clearly reveals the dual nature of the activation process for megadalton particles. Source data
Fig. 5
Fig. 5. Optimizing sensitivity and resolution in Orbitrap-based single-particle CDMS.
a, Overview of experimental and data processing approaches that can be exploited to reduce the number of split ion signals, improving CDMS performance, shown for the 4 MDa heavy HBV T = 4 capsid. As the arrows indicate, the number of split peak occurrences can be reduced by decreasing the gas pressure (reducing the collision probability), improving the initial desolvation (lower solvent loss probability) and/or diminishing the transient time. Split peaks can additionally be diminished through frequency chasing, applying drift corrections. This may result in a ~23-fold increase in effective ion sampling overall. Each of these approaches results in a much better utilization of the acquired data and yield mass histograms (on the right with percentages of utilized recorded ion signals) with comparable resolutions. b, Mass histograms of HBV particles, with T = 3 and T = 4 (~2,000 ions each), demonstrating the improving mass resolution by combining longer transient times and frequency drift correction (resolution indicated in matching colour and corresponds to 128, 256, 512, 1,024, 2,048 and 4,096 ms total transient times from bottom to top). c, Charge resolution in single-particle CDMS as a function of the transient time for HBV, with T = 3 and T = 4, as well as of the noise band of the corresponding m/z region. An exponential function (σz(t) = A × tB, where t is transient time, and A and B are constants) was fitted to the data points and follows a square root (with B of −0.52, −53 and −0.49; and r2 of 0.98, 0.99 and 1.00; for HBV with T = 4 and T = 3 and for the noise band), indicating that the electronic noise of preamplifier transistors is the main contributor to the observed impaired charge-resolving power. Source data
Fig. 6
Fig. 6. Detecting radial ion motion in an Orbitrap analyser.
a,b, The detected peaks for two individual instances of HBV T = 3 single ions. On the left, the peak at the standard axial frequency (ωz) is displayed (shown in the m/z domain). On the right, signals originating from the radial frequency modulations, ω+ and ω (at higher and lower frequency with respect to ωz, respectively) are displayed in the lower and higher m/z region (top and bottom). The raw data is shown in grey, the smoothed signal in black. The ion in a illustrates a highly stable radial frequency, whereas the single ion in b represents a non-stable radial frequency, for example caused by non-circular orbits. Note that in b the signals originating from the modulation by ω+ and ω are, as expected, mirror images of each other in the frequency domain. Source data

References

    1. Leney AC, Heck AJR. Native mass spectrometry: what is in the name? J. Am. Soc. Mass. Spectrom. 2017;28:5–13. doi: 10.1007/s13361-016-1545-3. - DOI - PubMed
    1. Fenn JB. Electrospray wings for molecular elephants (Nobel lecture) Angew. Chem. Int. Ed. 2003;42:3871–3894. doi: 10.1002/anie.200300605. - DOI - PubMed
    1. Rostom AA, et al. Detection and selective dissociation of intact ribosomes in a mass spectrometer. Proc. Natl Acad. Sci. USA. 2002;97:5185–5190. doi: 10.1073/pnas.97.10.5185. - DOI - PMC - PubMed
    1. Chorev DS, et al. Protein assemblies ejected directly from native membranes yield complexes for mass spectrometry. Science. 2018;362:829–834. doi: 10.1126/science.aau0976. - DOI - PMC - PubMed
    1. Wörner TP, et al. Adeno-associated virus capsid assembly is divergent and stochastic. Nat. Commun. 2021;12:1642. doi: 10.1038/s41467-021-21935-5. - DOI - PMC - PubMed

Publication types

MeSH terms

LinkOut - more resources