. 2022 Mar;54(3):295-305.
doi: 10.1038/s41588-022-01026-x. Epub 2022 Mar 10.

Prediction of histone post-translational modification patterns based on nascent transcription data

Affiliations

Prediction of histone post-translational modification patterns based on nascent transcription data

Zhong Wang et al. Nat Genet. 2022 Mar.

Abstract

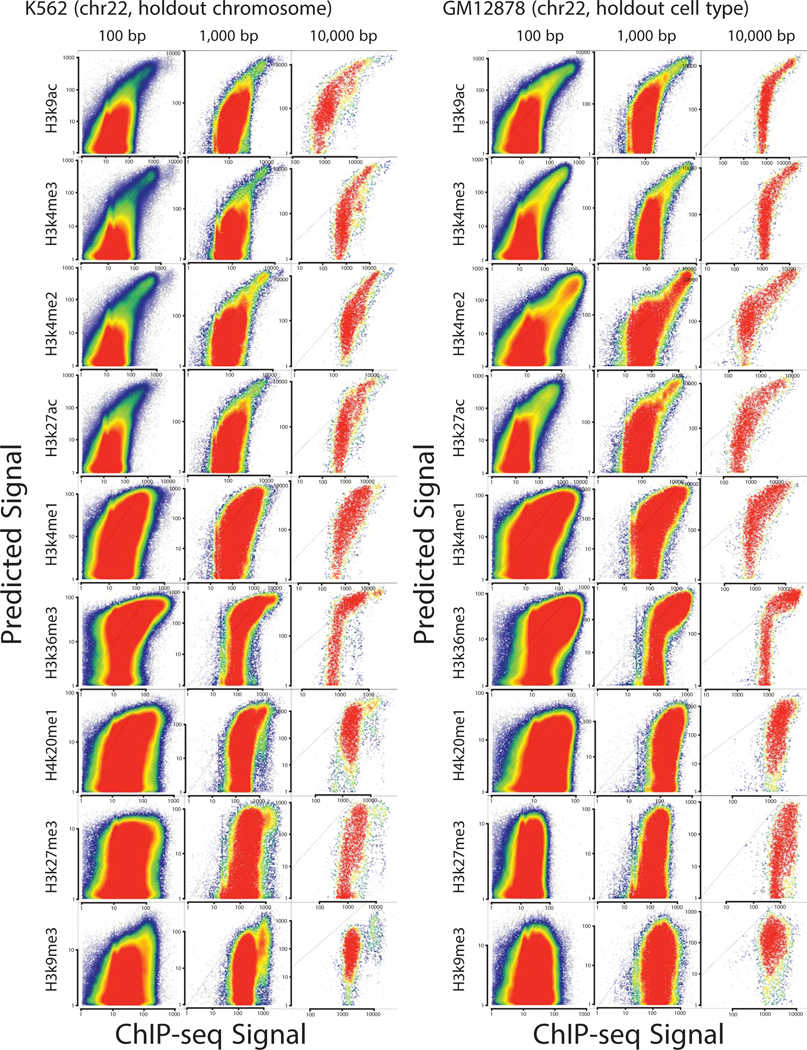
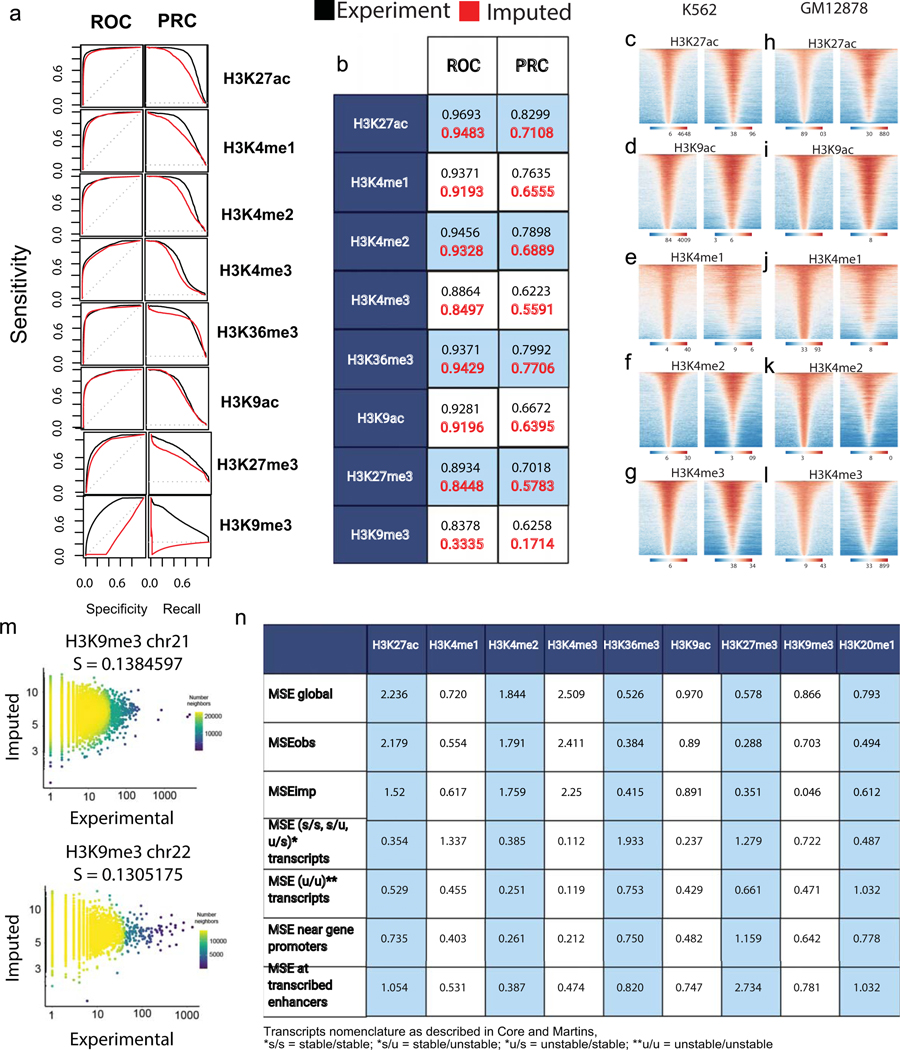
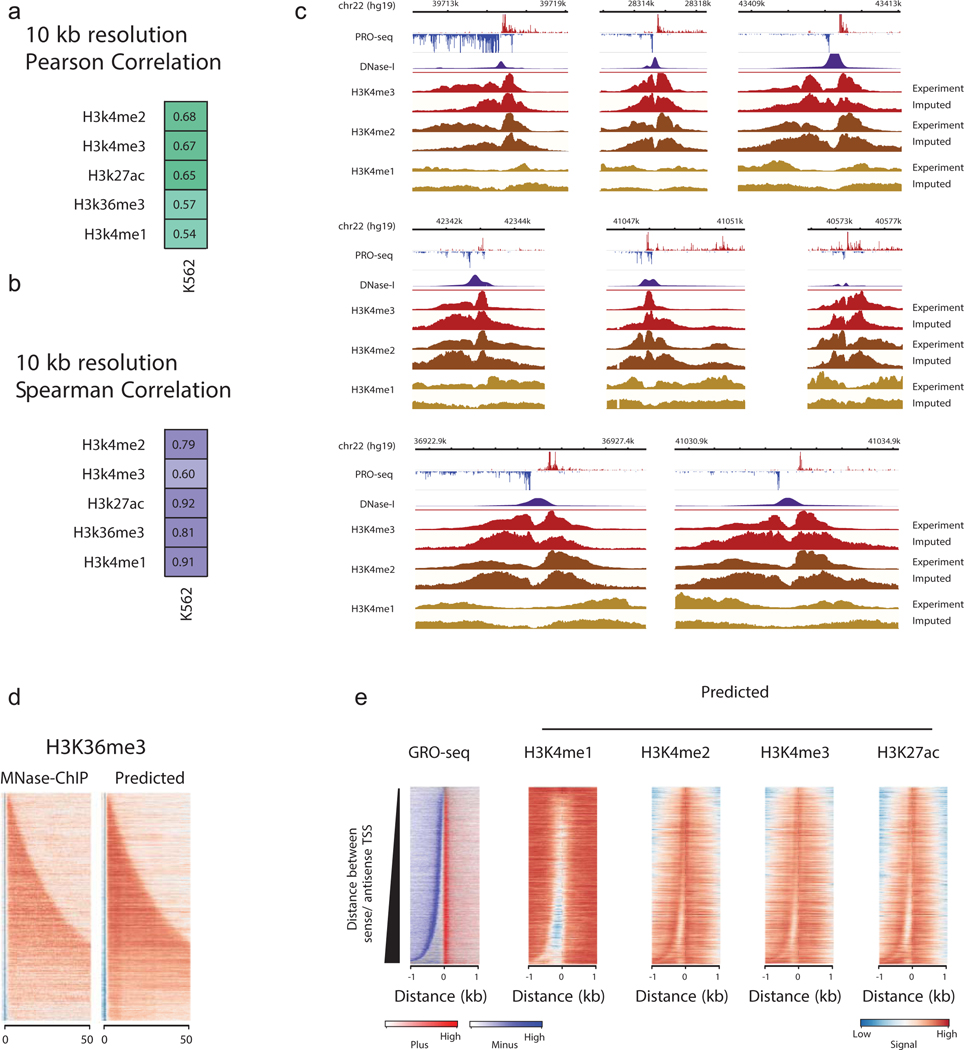
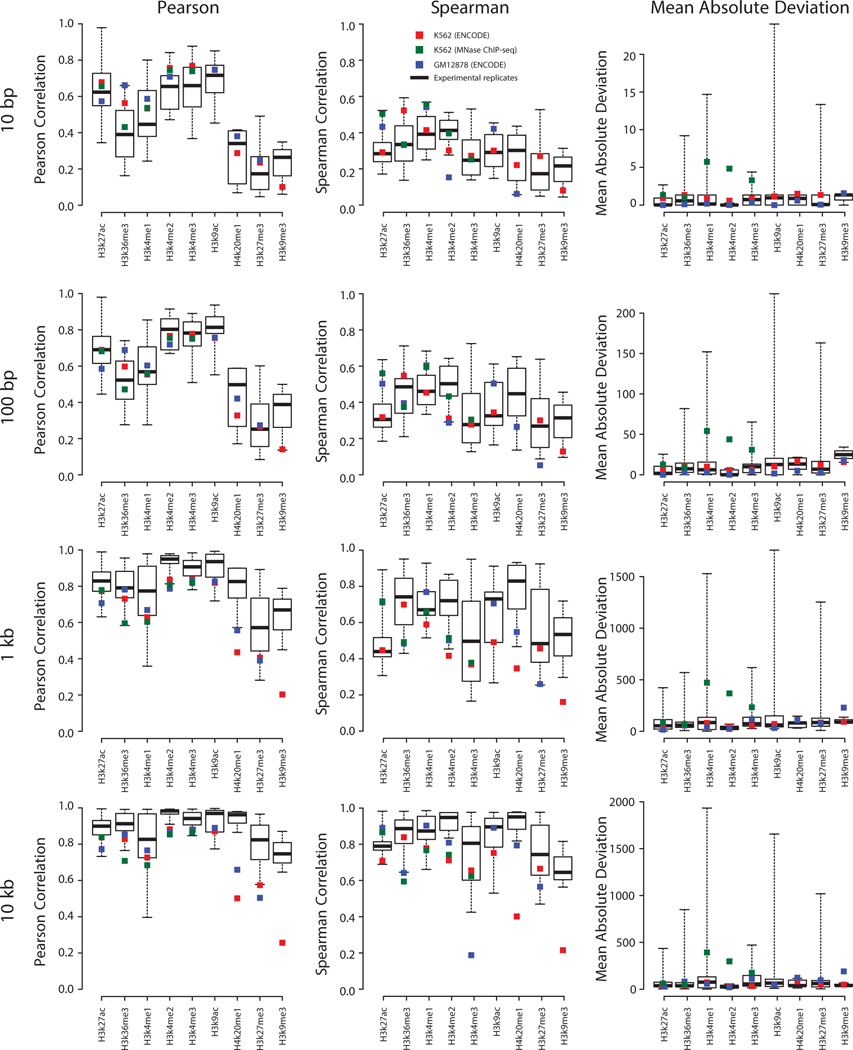
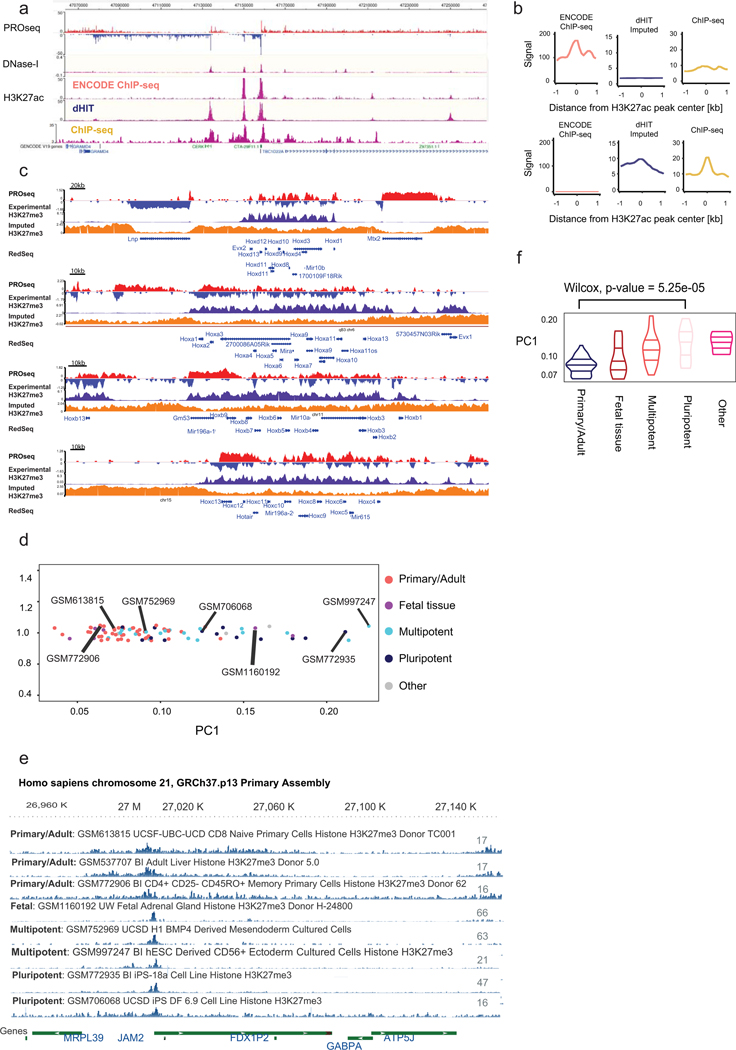
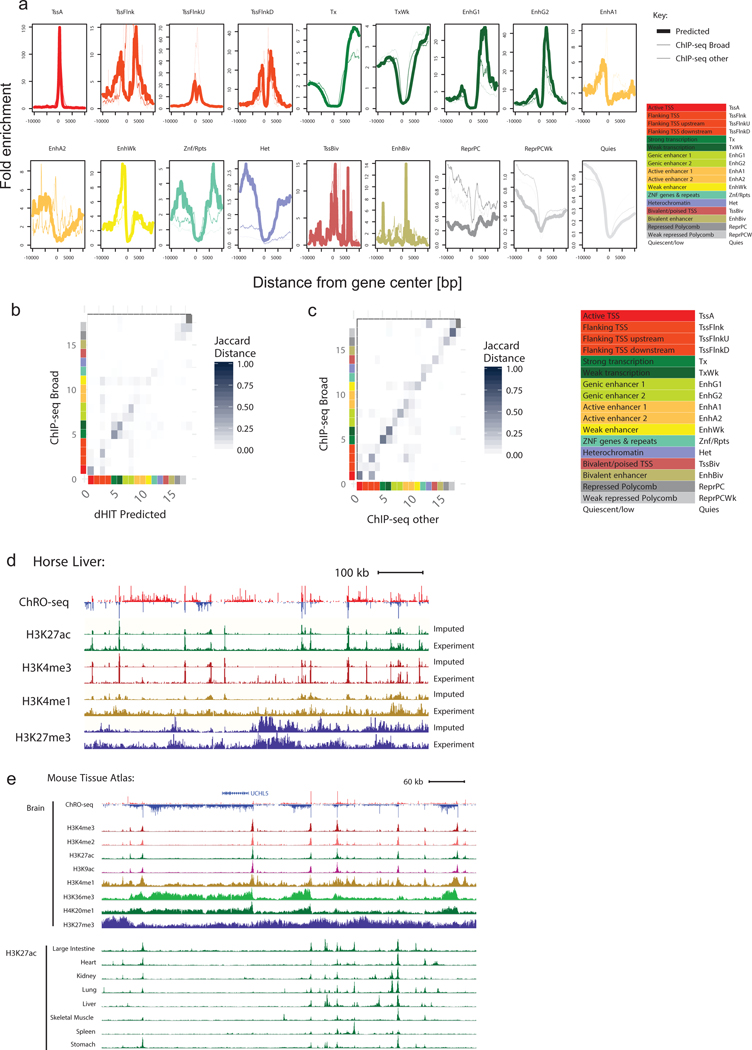
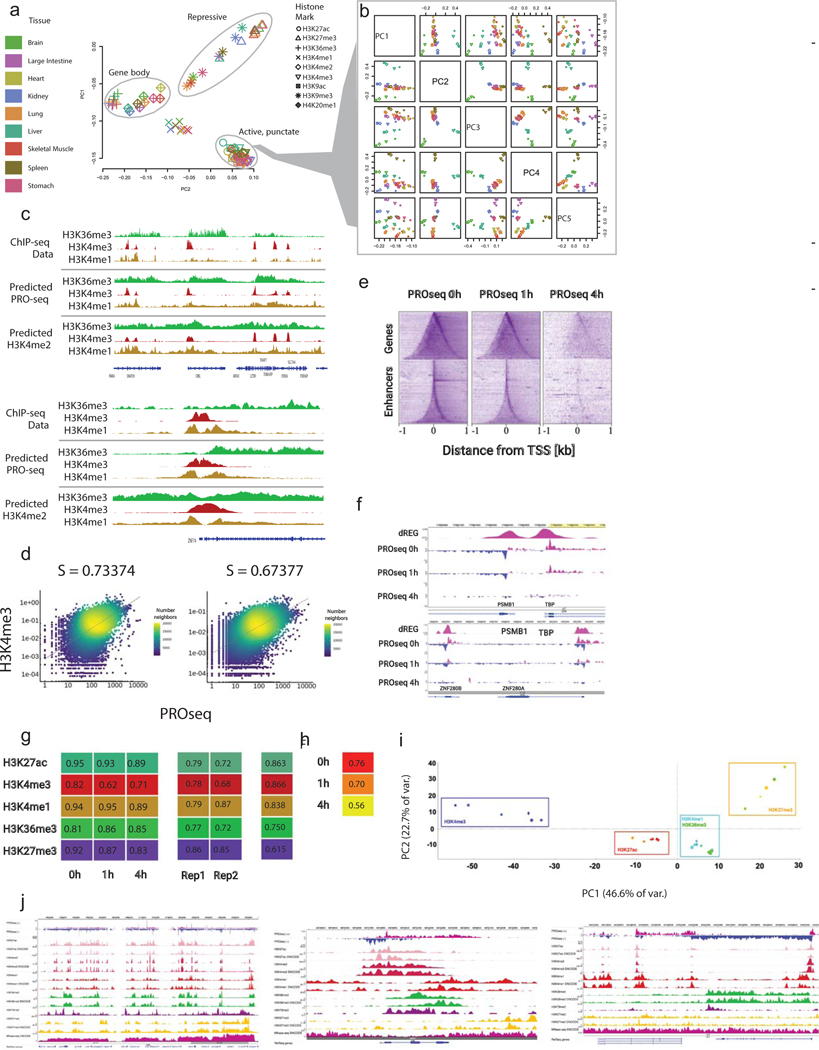
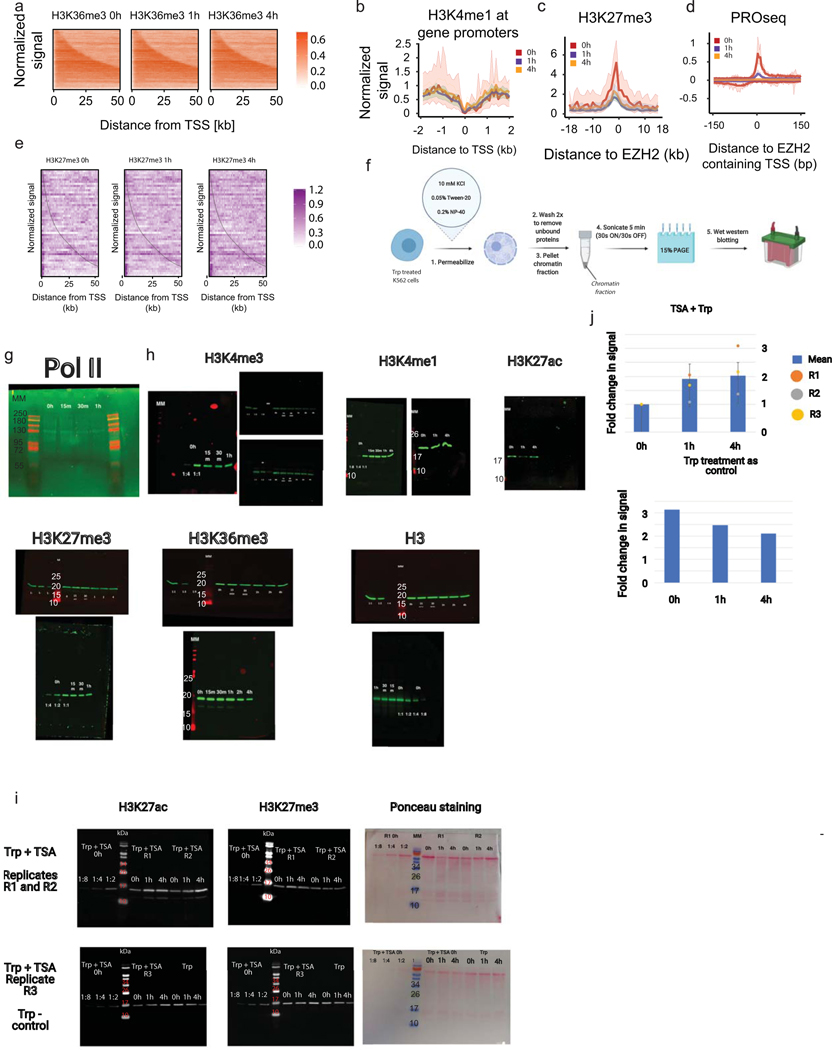
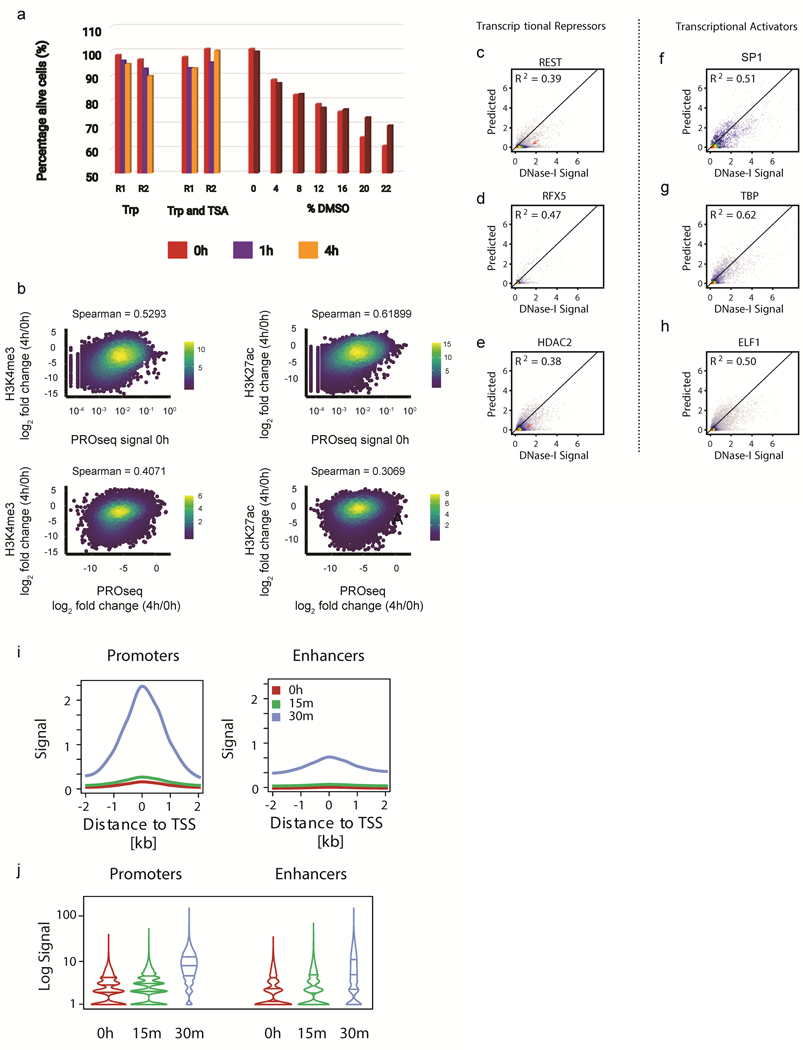
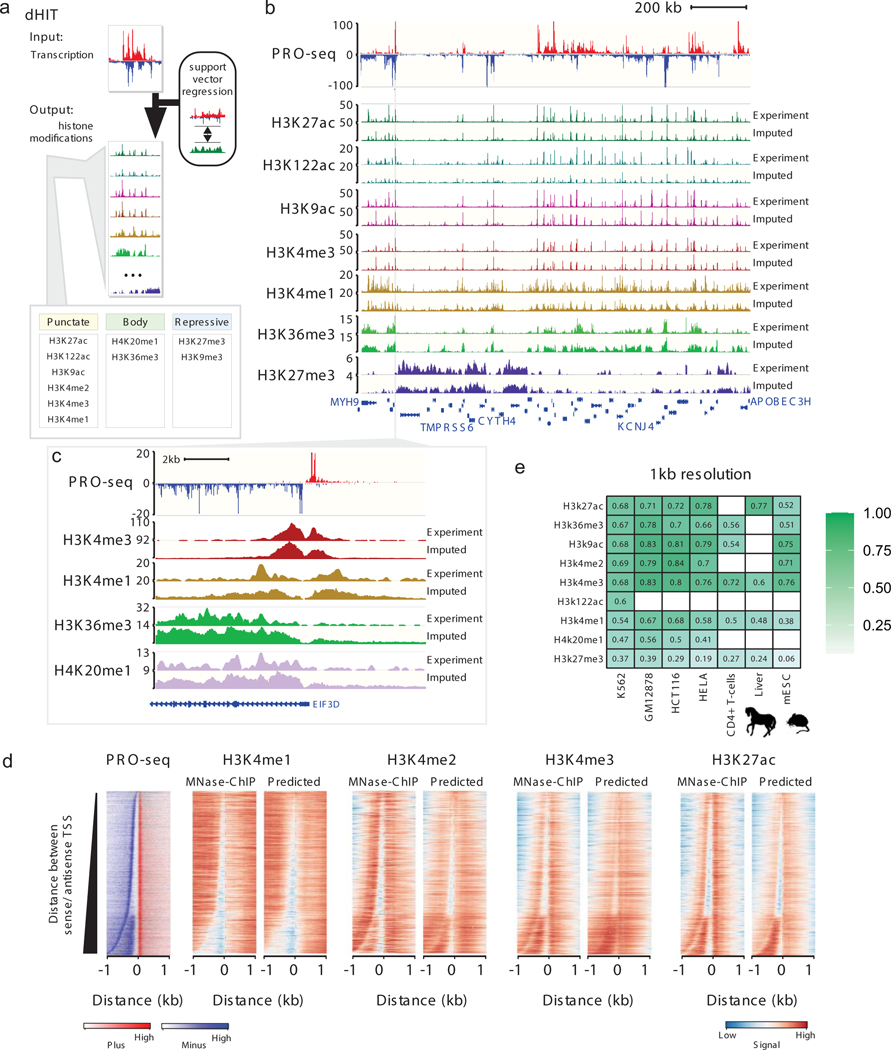
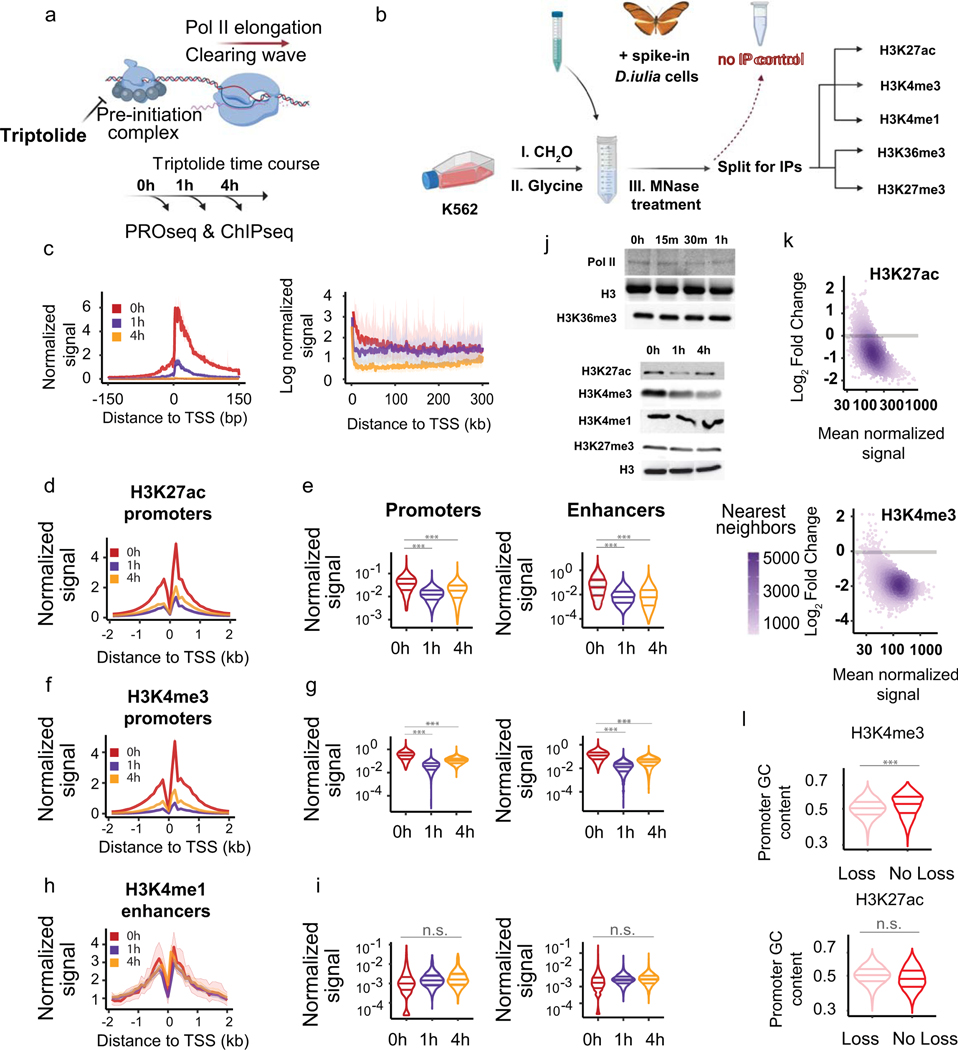
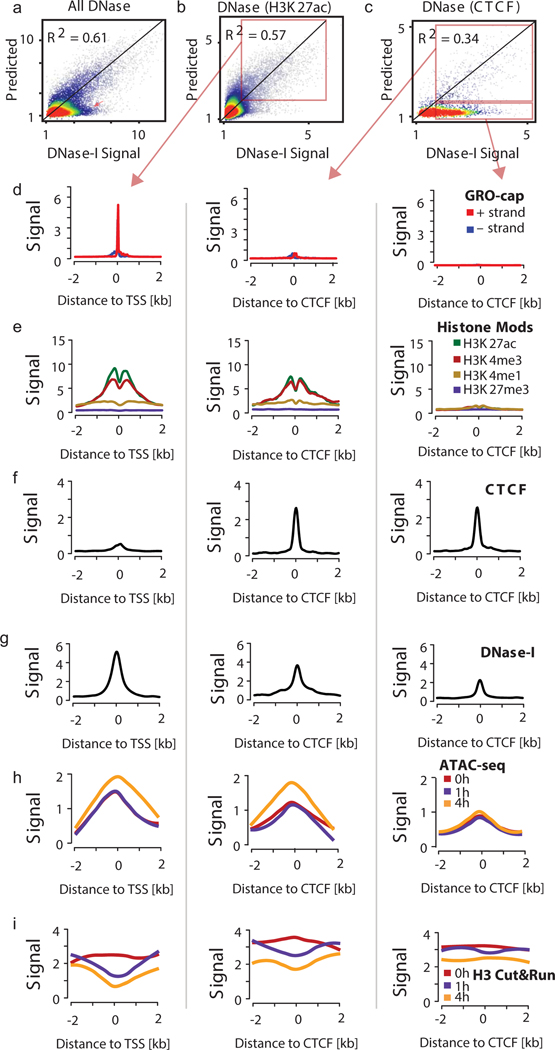
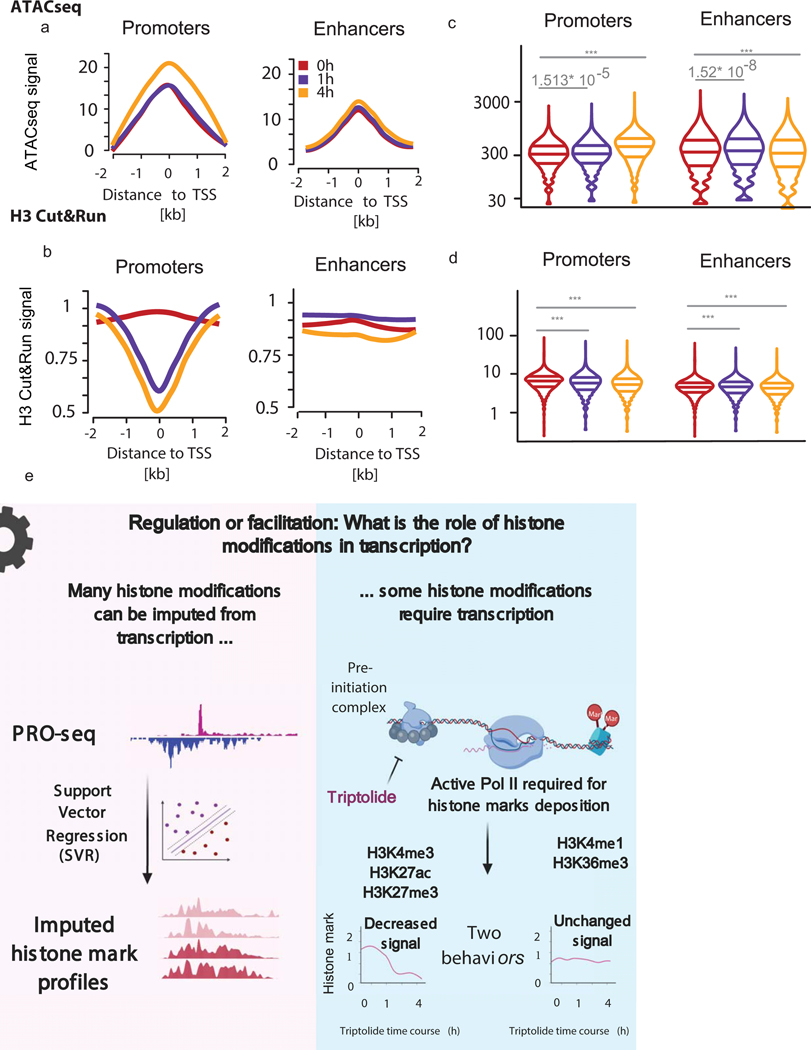
The role of histone modifications in transcription remains incompletely understood. Here, we examine the relationship between histone modifications and transcription using experimental perturbations combined with sensitive machine-learning tools. Transcription predicted the variation in active histone marks and complex chromatin states, like bivalent promoters, down to single-nucleosome resolution and at an accuracy that rivaled the correspondence between independent ChIP-seq experiments. Blocking transcription rapidly removed two punctate marks, H3K4me3 and H3K27ac, from chromatin indicating that transcription is required for active histone modifications. Transcription was also required for maintenance of H3K27me3, consistent with a role for RNA in recruiting PRC2. A subset of DNase-I-hypersensitive sites were refractory to prediction, precluding models where transcription initiates pervasively at any open chromatin. Our results, in combination with past literature, support a model in which active histone modifications serve a supportive, rather than an essential regulatory, role in transcription.


Conflict of interest statement

Competing Interests Statement

The authors declare no competing interests.

Figures

Extended Data Fig. 1
Extended Data Fig. 1. Imputation of histone marks using nascent transcription
Scatterplots show predicted (Y-axis) as a function of experimental ChIP-seq signal (X-axis) for ten different histone modifications in K562 and GM12878. Plots show correlations in a holdout chromosome (chr22) at three distinct length scales.
Extended Data Fig. 2
Extended Data Fig. 2. Evaluating dHIT predictions
A.ROC and PRC plots describe the relationship between imputed and ENCODE ChIPseq data within ENCODE peaks on chr21, holdout during dHIT training. B. Quantification of area under precision curves for both ROP and PRC plots in A. (C-L) Heatmaps show the experimental and imputed abundance of active, punctate histone marks in K562 (C-G) or GM12878 (H-L). Heatmaps show all peaks calls based on experimental ChIP-seq data ordered by the highest total signal intensity. M. Scatter plots depict imputed H3K9me3 (Y-axis) as a function of CUT&TAG experimental (X-axis) for H3K9me3 in K562. Spearman correlations were computed on the holdout chromosome chr21 (A) and chr22 (B). N. Mean-squared error (MSE) quantification at different subsets of genomic sites in GM12878.
Extended Data Fig. 3
Extended Data Fig. 3. Comparison between experimental and imputed MNase ChIP-seq
(A-B).Heatmaps show the Pearson (A) and Spearman (B) correlations between predicted and experimental MNase ChIP-seq in 10kb windows on a holdout chromosome (chr22). C. Genome-browser plots show the distribution of PRO-seq, DNase-I hypersensitivity signal, and the signal for H3K4me3, H3K4me2, and H3K4me1 derived from MNase ChIP-seq and imputation near 9 transcribed regions in K562 cells. D. Heatmaps show MNase ChIP-seq and imputed signal intensity for H3K36me3, a gene body mark, deposited in the body of annotated genes. Genes are sorted by gene length. E. Heatmaps show the distribution of transcription (left) and histone modifications (right) predicted using transcription. Rows represent transcription initiation domains in GM12878 cells defined using GRO-cap data by Core, Martins, et. al. (2014) Nat. Gen. Heatmaps were ordered by the distance between the most frequently used TSS in each transcription initiation domain on the plus and minus strand.
Extended Data Fig. 4
Extended Data Fig. 4. Evaluation of cross-cell line imputation by different metrics.
(A-C) Heatmaps show Pearson’s correlation (A), Spearman’s rank correlation (B), Jensen-Shannon and divergence. (C) between predicted and ChIP-seq measurements of nine histone modifications. Values are computed in 10kb windows on the holdout chromosome (chr22) in humans, chr1 in horse, and chr1 in mice. Empty cells indicate that no experimental data is available for comparison in the cell type shown. (D) Heatmap shows Pearson’s correlation between the training dataset in K562 cells and experimental data collected in the indicated human cell line. Values are computed in 1kb windows on the holdout chromosome (chr22) in humans. (E) Heatmap shows Pearson’s correlation between the ENCODE experimental data and either Imputed data or the average signal of the other human cell lines investigated. Values are computed in 1kb windows on the holdout chromosome (chr22) in GM12878.
Extended Data Fig. 5
Extended Data Fig. 5. Comparison between imputation and multiple ChIP-seq experiments
Box and whiskers plot shows the Pearson correlation between different experimental datasets for six histone marks in K562 and GM12878.The correlation between data imputed in K562 and GM12878 and the ENCODE experimental data in the same cell line is shown respectively by red and blue squares. All values are computed on a holdout chromosome (chr22) not used during training and are presented as mean values +/- standard deviation.
Extended Data Fig. 6
Extended Data Fig. 6. Comparing between imputed and experimental Chip-seq.
A. Broser shot shows the ENCODE, imputed, and experi-mental ChIP-seq signals at the CERK locus. B. Meta plots compare the H3K27ac content of two different sets of H3K27ac annotated peaks: peak high in ENCODE signal and depleted in imputed ChIP (top) or vice-versa (bottom). C. Genome-browser compares experimental and predicted H3K27me3 signals at all four Hox gene clusters in relation to PROseq signal. D.Principal component analysis of 86 H3K27me3 ChIP-seq datasets from the Epigenome Roadmap project. E.Genome browser shows the distribution of H3K27me3 in the 8 of the Epigenome Roadmap cell lines. F.Quantification of PC1 H3K27me3 signal in 5 classes of cells. An unpaired Wilcox test was usedto compare the Primary/Adult to the Pluripotent classes.
Extended Data Fig. 7
Extended Data Fig. 7. Supplementary Figure 7: Chromatin annotations with dHIT
A. Enrichment of 18 chromatin states near RefSeq annotated transcription start sites for histone abundance predicted by dHIT (thick solid line), ChIP-seq from Broad (thin solid line), or using an alternative source of ChIP-seq data (thin dashed line).(B-C). Confusion matrix shows the Jaccard distance between dHIT and ChIP-seq data in 18 chromatin states (B) or between two separate sources of ChIP-seq data (C). Color scales are shown beside the plot, and are identical between panels (B) and (C). D. Genome browser shows the distri-bution of transcription, H3K27ac, H3K4me3, H3K4me1 and H3K27me3 in equine liver. E Genome browser shows the distri-bution of eight histone marks in mouse brain (top) and H3K27ac across nine murine tissues (buttom).
Extended Data Fig. 8
Extended Data Fig. 8. Data validation
A. PCA shows the first two princi-pal components of nine histone modifications in nine murine tissues (81 total datasets) in 100 bp bins on mm10 chr1. B. PCA of active, punctate marks (H3K4me3, H3K4me2, H3K9ac, and H3K27ac) shows that active punctate marks cluster by tissue. C. Genome browser shows the distribution of H3K36me3, H3K4me3, and H3K4me1 observed using ChIP-seq experiments or predicted using either PRO-seq or H3K4me2. Data is shown in two loci covering sever-al transcribed genes (top) and near the transcription start site of ZNF74 (bottom). D. Correlations between PROseq 0h and H3K4me3 and H3K27ac at TSSs. E. Heatmaps centered on transcription initiation domains show loss in transcription measured by PRO-seq after Trp treatment. F. Genome-browser shows loss in transcription measured by PRO-seq after Trp treatment. Loss in PRO-seq signal at both enhancers and gene promoters. G. Spearman correlations between ChIP-seq replicates (left), each ChIP-seq replicate and ENCODE data (middle) genome-wide at 10kb resolution, and at ENCODE peaks between merged Reps and ENCODE. H. H3 Cut&Run 10kb resolution Spearman correlation between replicates. I. Genome-wide, 10kb resolution PCA of all ChIP-seq samples.
Extended Data Fig. 9
Extended Data Fig. 9. Changes in histone marks during Triptolide time course.
A. Heatmaps compare the level of H3K36me3 ChIP-seq after Triptolide inhibition. B. Meta plots show the H3K4me1 levels in a 4kb window centered on transcription start sites in K562 cells. C. Meta plots show the level in H3K27me3 in a 40kb window centered in EZH2 binding sites. D. Meta plots show transcription content of EZH2 binding sites during the Triptolide time course. E. Heatmaps shows H3K27me3 signal within gene bodies during the Triptolide treatment. Genes are sorted by gene length. F. Schematics of western blot experimental design. (G-H). Each western blot depicts the abundance of chromatin bound histone mark or Pol II during the indicat-ed Triptolide incubation time point. Each blot represents a different experiment. A dilution series of the untreated samples was used as standard curve to quantify changes in signal. Experiments were repeated at least twice and a minimum of 2 replicates per histone mark are provided. MM defined the Molecular marker depicted in [kDa]. I. Each western blot depicts the abundance of chromatin bound H3K27ac or H3K27me3 during the indicated incubation time point of Triptolide, or Triptolide and Trichostatin dual treatment. Each blot represents a different experiment. A dilution series of the untreated samples was used as standard curve to quantify changes in signal. Ponceau staining of membranes imaged are also depicted as total protein loading control. J. Quantification of H3K27ac/H3K27me3 signals of the western blot in I. H3K27me3 was used as loading control. All values are depicted as mean values +/- SD.
Extended Data Fig. 10
Extended Data Fig. 10. Studying transcription activators and repressors.
A. Bar plots display absorbance quantified at 590nm for AlmarBlue dye incubated with K562 cells during Triptolide, or Triptolide and Trichostatin A treatments. Two technical replicates were averaged for each time point. R1 and R2 define separate biological replication of the experiment. B. Scatter plots display the loss in H3K4me3 (left) and H3K27ac (right) as a function of Pol II transcription (top) or change in transcription (bottom). Changes in histone marks and transcription were calculated as log2 fold changes between 4h of Triptolide treatment and untreated cells. Plots show spearman rho correlations between conditions. (C-H) Scatterplots show experimental DNase-I hypersensitivity (x-axis) as a function of predicted DNase-I hypersensitivity (yaxis) in 100 bp windows intersected with transcriptional repressors (C-E) or transcriptional activators (F-H). (I-J) Meta (I) and Violin (J) plots display TBP CUT&RUN signal at gene promoters and enhancers in a short 30min Triptolide time course.
Fig. 1.
Fig. 1.. dHIT imputes histone modifications using nascent transcription.
(a) Schematic of the dHIT algorithm. PRO-seq and ChIP-seq data in K562 cells were used to train a support vector regression (SVR) classifier to impute 10 different histone modifications. (b) Genome browser comparison between experimental and predicted histone modifications on a holdout chromosome (chr22). PRO-seq data used to generate each imputation are shown on top. (c) Genome browser comparison between experimental and predicted histone marks near the promoter of EIF3D. PRO-seq data used to generate each imputation are shown on top. (d) Heatmaps show the distribution of transcription (left) and histone modifications (right) measured using MNase ChIP-seq or predicted using transcription. Rows represent transcription initiation domains in K562 cells. Heatmaps were ordered by the distance between the most frequently used TSS in each transcription initiation domain on the plus and minus strands. (e) Pearson's correlation between predicted and expected values for nine histone modifications. Values are computed on the holdout chromosome (chr22) in humans, chr1 in horses, and chr1 in mice. Empty cells indicate that no experimental data are available for comparison in the cell type shown.
Fig. 2.
Fig. 2.. dHIT identifies bivalent H3K4me3-/H3K27me3-marked genes.
(a) Genome browser shows PRO-seq data and histone modification data measured by ChIP-seq or predicted using PRO-seq in the Prox1 locus. Prox1 is marked by bivalent H3K4me3 and H3K27me3 histone modifications in mESCs. (b) Precision recall curve illustrates the accuracy of bivalent gene classification by a random forest classifier using ChIP-seq data (green) or dHIT imputation (black). The gray line denotes random classification. Classification was performed on a matched set of TSSs (50% bivalent, 50% not bivalent) that was held out during random forest training. (c) Genome browser in K562 cells shows 18 state chromHMM model using either ChIP-seq data used to train the model (Broad), alternative ChIP-seq data in K562 (other), or based on imputation (dHIT predicted). PRO-seq data used during dHIT imputation are shown on top. (d) Enrichment in each of 18 chromatin states as a function of distance from RefSeq annotated TSSs. (e) Jaccard distance between chromHMM states inferred using ChIP-seq from Broad and predicted data (y-axis) and states inferred using ChIP-seq from Broad and an alternative compilation of high-quality ChIP-seq data (x-axis).
Fig. 3.
Fig. 3.. Inference of chromatin states defined by chromHMM using transcription.
(a) ChromHMM states inferred using ChRO-seq data from 20 primary glioblastomas. (b) The number of unique ChRO-seq or ChIP-seq libraries required to analyze chromatin states in 20 primary glioblastomas. (c) The mean difference between predicted and experimental ChIP-seq data on a holdout chromosome (chr22) (y-axis). SVR models were trained using the indicated experimental mark (left) or the indicated combination of histone marks (right).
Fig. 4.
Fig. 4.. ChIP-seq measures changes in histone modifications following transcription inhibition by Trp.
(a) Model of Trp action on transcription preinitiation complex. (b) Metaplots of PRO-seq signal after Trp treatment. Pol II density is depicted on a linear scale in a 300-bp window centered on maximum TSS (left), or on a natural log scale (right). (c) Depiction of ChIP-seq experimental design where D. iulia chromatin was used as spike-in normalization control. (d-i) Meta plots and quantification of H3K27ac (d-e), H3K4me3 (f-g), and H3K4me1 (h-i) signals at enhancers and gene promoters. A paired, two-sided, Wilcoxon test was performed to estimate statistical significance in signal changes, where (***) denote P value < 2.2 × 10⁻¹⁶ and (n.s.) P value = 1. The three horizontal lines denote the 25th, 50th, and 75th percentiles. (j) Western blots show global changes in histone marks after Trp treatment. Each blot depicts chromatin associated histone marks and Pol II after the indicated Trp incubation time. See also Supplementary Figure 20. (k) MA plots display the loss in H3K4me3 and H3K27ac between 0 h and 1 h of Trp treatment. Log2 fold-changes and mean normalized signals between time points were computed with DEseq2. A gray bar marks log2 fold-change at 0. (l) Violin plots quantify the levels of H3K4me3 and H3K27ac as a function of GC-richness of promoter sequences. Statistical significance was computed using a two-sided paired Wilcox, where (***) denote P value < 2.2 × 10⁻¹⁶ and (n.s.) P value = 1. The three horizontal lines denote the 25th, 50th, and 75th percentiles.
Fig. 5.
Fig. 5.. Chromatin accessibility is not sufficient for transcription initiation.
(a-c) Scatterplots show experimental DNase-I hypersensitivity (x-axis) as a function of predicted DNase-I hypersensitivity (y-axis) in 100-bp windows intersected with DNase-I hypersensitive sites. (a), H3K27ac (b), or CTCF peaks (c) on a holdout chromosome (chr22). (d-g) Meta plots show GRO-cap, histone modifications, CTCF binding, and DNase-I hypersensitivity signal near H3K27ac peaks in which DNase-I hypersensitivity signal was accurately predicted by transcription (left column), near CTCF peaks in which DNase-I hypersensitivity signal was accurately predicted by transcription (middle), and near CTCF peaks in which DNase-I hypersensitivity signal was not accurately predicted by transcription (right column). (h-i) Meta plots show ATAC-seq (h) and CUT&RUN histone H3 signal (i) following Trp treatment at regions in d-g.
Fig. 6.
Fig. 6.. Transcription is required for chromatin landscaping.
(a-b) Meta plots display ATAC-seq (a) and histone H3 CUT&TAG (b) signal measured at gene promoters and enhancers. (c-d) Violin plots quantify the change in ATAC-seq (c) and histone H3 CUT&TAG (d) signals at gene promoters and enhancers. Significance was calculated by performing a two-sided, paired Wilcoxon test, where (***) denotes P value < 2.2 × 10⁻¹⁶. (e) Summary figure.

Comment in

Similar articles

Cited by

References

    1. Allfrey VG, Faulkner R.& Mirsky AE ACETYLATION AND METHYLATION OF HISTONES AND THEIR POSSIBLE ROLE IN THE REGULATION OF RNA SYNTHESIS. Proc. Natl. Acad. Sci. U. S. A 51, 786–794 (1964). - PMC - PubMed
    1. Ho JWK et al. Comparative analysis of metazoan chromatin organization. Nature 512, 449–452 (2014). - PMC - PubMed
    1. Weiner A.et al. High-resolution chromatin dynamics during a yeast stress response. Mol. Cell 58, 371–386 (2015). - PMC - PubMed
    1. Sebé-Pedrós A.et al. The Dynamic Regulatory Genome of Capsaspora and the Origin of Animal Multicellularity. Cell (2016) doi: 10.1016/j.cell.2016.03.034. - DOI - PMC - PubMed
    1. Schwartzentruber J.et al. Driver mutations in histone H3.3 and chromatin remodelling genes in paediatric glioblastoma. Nature 482, 226–231 (2012). - PubMed

Publication types

MeSH terms