. 2022 Feb 22:13:820148.
doi: 10.3389/fimmu.2022.820148. eCollection 2022.

A Quantitative Approach to Unravel the Role of Host Genetics in IgG-FcγR Complex Formation After Vaccination

Affiliations

A Quantitative Approach to Unravel the Role of Host Genetics in IgG-FcγR Complex Formation After Vaccination

Melissa M Lemke et al. Front Immunol. .

Abstract

Fc-mediated immune functions have been correlated with protection in the RV144 HIV vaccine trial and are important for immunity to a range of pathogens. IgG antibodies (Abs) that form complexes with Fc receptors (FcRs) on innate immune cells can activate Fc-mediated immune functions. Genetic variation in both IgGs and FcRs have the capacity to alter IgG-FcR complex formation via changes in binding affinity and concentration. A growing challenge lies in unraveling the importance of multiple variations, especially in the context of vaccine trials that are conducted in homogenous genetic populations. Here we use an ordinary differential equation model to quantitatively assess how IgG1 allotypes and FcγR polymorphisms influence IgG-FcγRIIIa complex formation in vaccine-relevant settings. Using data from the RV144 HIV vaccine trial, we map the landscape of IgG-FcγRIIIa complex formation predicted post-vaccination for three different IgG1 allotypes and two different FcγRIIIa polymorphisms. Overall, the model illustrates how specific vaccine interventions could be applied to maximize IgG-FcγRIIIa complex formation in different genetic backgrounds. Individuals with the G1m1,17 and G1m1,3 allotypes were predicted to be more responsive to vaccine adjuvant strategies that increase antibody FcγRIIIa affinity (e.g. glycosylation modifications), compared to the G1m-1,3 allotype which was predicted to be more responsive to vaccine boosting regimens that increase IgG1 antibody titers (concentration). Finally, simulations in mixed-allotype populations suggest that the benefit of boosting IgG1 concentration versus IgG1 affinity may be dependent upon the presence of the G1m-1,3 allotype. Overall this work provides a quantitative tool for rationally improving Fc-mediated functions after vaccination that may be important for assessing vaccine trial results in the context of under-represented genetic populations.

Keywords: ADCC; Fc receptor; Fc receptor polymorphism; HIV; IgG1 allotype; RV144; systems serology; vaccine boosting.


Conflict of interest statement

The authors declare that the research was conducted in the absence of any commercial or financial relationships that could be construed as a potential conflict of interest.

Figures

Figure 1
Figure 1
Model schematic. (A) An example set of reversible reactions describing the sequential binding of IgG1 to antigen (Ag) and dimeric FcγR with the respective forward (kon) and reverse (koff) reaction rates. (B) Ordinary differential equations were used to predict total HIV Ag-IgG-FcγR complexes formed as a function of concentration and binding affinity of Ag, IgG subclasses, and FcγR. The model assumes a single FcγR type. Reversible reactions are represented by double ended arrows. Model output was the sum of all dimeric FcγR complexes formed (boxed in black) at steady state. (C) The baseline parameters for FcγRIIIA-V158 complex formation with the following sources: αSPR measurement from pooled purified IgG from HIV infected individuals binding to monomeric gp120. All IgG subtypes share one affinity value to the antigen of focus, gp120 env (unpublished data). βKeq measured in Bruhns et al. (11). γThe average estimated IgG concentrations from individuals 1-30 in the RV144 data in this manuscript (see methods for notes on conversion from MFI to mM unit). δConcentrations used in multiplex experimental protocol. (D) Equations describing the example reactions in panel (A) Reactions follow mass action kinetics and consist of a forward reaction (on rate, kon, multiplied by the concentrations of substrates) and a reverse reaction (off rate, koff, multiplied by the concentration of the product of the forward reaction). Differential equations for change in each complex over time were generated for each complex.
Figure 2
Figure 2
Landscape illustrating the relationships between IgG1 concentration and IgG1- FcγR affinity across the physiological landscape of parameters (2500 unique parameter combinations). (A) Model predictions for the change in complex formation from baseline when IgG1 initial concentration (x axis) and kon IgG1- FcγR (y axis) were altered individually and the resulting change in complex formation is added together (z axis). Color indicates predicted change in complex formation from baseline. (B) Model predictions for the change in complex formation from baseline when both parameters are altered simultaneously in the model. Color indicates predicted change in complex formation from baseline. (C) The difference between (A, B), illustrating parameter combinations where synergy occurs. Blue indicates positive synergy, where the combined parameter changes (B) result in greater complex formation compared to was predicted by separate changes added together (A), white indicates no synergy, and red indicates anergy; where the combined parameter changes (B) result in lower complex formation compared to was predicted by separate changes added together (A).
Figure 3
Figure 3
FcγR polymorphisms have a greater influence on complex formation after IgG1 boosting. (A) Baseline Keq of each IgG subtype to the high affinity FcγRIIIa-V158 polymorphism (light pink) and the low affinity FcγRIIIa-F158 polymorphism (dark pink) as reported by Bruhns et al. (11). (B) Complex formation (z axis) predicted by the model for 2500 combinations of initial IgG1 and IgG3 concentration (x and y axes) for FcγRIIIa-V158 (light pink) and FcγRIIIa-F158 (dark pink). Each dot represents an RV144 plasma sample (n=105) with respective initial IgG1 and IgG3 concentrations plotted post-vaccination (baseline-light orange), and after a simulated 170% (145 nm) boost of IgG1 (dark orange). The simulated boost magnitude was estimated based on the highest fold change seen in RV306 between 26 weeks and peak HIV specific IgG titer (2.64X in arm 4b) (31). (C) The difference in complex formation predicted between the FcγRIIIa-F158 and FcγRIIIa-V158 polymorphisms post-vaccination (light orange) and post-IgG1 boost (dark orange; Wilcoxon matched-pairs signed rank test; ****p-value < 0.0001).
Figure 4
Figure 4
Glycosylation differentially impacts IgG1 allotypes. (A) Expected IgG1, IgG2, IgG3, and IgG4 concentrations for G1m1,3 (white), G1m1 (gray), and G1m-1,3 (black) allotypes based on previously published work (17, 29). (B) Model predictions for complex formation as IgG1 concentration and kon IgG1- FcγR are altered over physiological ranges ( Figure 2B ). Lines indicate IgG1 concentrations for three different IgG1 allotypes (G1m1,3 (white), G1m1 (gray), G1m-1,3 (black)), and the affinity change expected from an afucosylation glycosylation modification (purple) compared to baseline (light blue). (C) The difference ( Figure 2C ) between the combined parameter change surface ( Figure 2A ) and the additive surface ( Figure 2B ). Lines indicate IgG1 concentrations for three different IgG1 allotypes (G1m1,3 (white), G1m1 (gray), G1m-1,3 (black)), and the affinity change expected from an afucosylation glycosylation modification (dark blue) compared to baseline FcgRIIIaV158 (light blue). (D) Change in complex formation from baseline affinity to an afucosylated affinity in each allotype, G1m1,3 (white), G1m1 (gray), and G1m-1,3 (black) (Friedman test with Dunn’s multiple comparisons test; ****p-value < 0.001).
Figure 5
Figure 5
IgG1 allotype determines whether boosting IgG1 concentration or boosting IgG1 affinity (kon IgG1- FcγR) would be most effective for increasing complex formation. (A) Model predictions for complex formation of RV144 vaccinees (n=105) in two FcγRIIIa polymorphisms, FcγRIIIa-V158 (light pink) and FcγRIIIa-F158 (dark pink), and three IgG1 allotypes, G1m1,3 (original RV144 data), G1m1 and G1m-1,3. Polymorphisms were simulated by altering the binding affinities of each IgG subtype to FcγR as previously published (11) and indicated in Figure 3A . Allotypes are simulated by multiplying each vaccinee’s IgG1, IgG2, IgG3 and IgG4 initial concentration by its respective conversion factor as previously published (29) and indicated in Figure 4A (Friedman test with Dunn’s multiple comparisons test comparing the two polymorphisms within each allotype; ****p-value < 0.001). (B) Simulated IgG1 concentration boosting in each allotype (G1m1,3, white; G1m1, gray; G1m-1,3 black) and polymorphism (FcγRIIIa-V158, light pink; FcγRIIIa-F158, dark pink) combination. Boosts were calculated by multiplying the individual’s baseline initial IgG1 concentration value by the boost levels and then this was added on top of each individual’s baseline. (B) Color indicates median change in complex formation for each genetic background. (C) Simulated boosting of kon IgG1- FcγR in each allotype (G1m1,3, white; G1m1, gray; G1m-1,3 black) and polymorphism (FcγRIIIa-V158, light pink; FcγRIIIa-F158, dark pink) combination. Boosts were calculated by multiplying the individual’s baseline kon IgG1- FcγR value by the boost levels and then this was added on top of each individual’s baseline. Color indicates median change in complex formation for each genetic background and boost as indicated. (D) The ratio of median change in complex formation with a boost in IgG1 concentration over median change in complex formation with a boost in kon IgG1-FcγR (affinity) at each boosting level. This ratio shows which type of boost is most effective for increasing complex formation (IgG1 concentration, purple; kon IgG1-FcγR, green) and when both are equally beneficial (white).
Figure 6
Figure 6
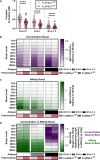
In mixed allotype populations, the benefit of boosting IgG1 concentration vs. IgG1 affinity is dependent on the presence of the G1m-1,3 allotype. (A) Boosting of initial IgG1 concentration in mixed allotype populations (G1m1,3, white; G1m1, gray; G1m-1,3 black) for FcγRIIIa-V158. Color indicates predicted change in complex formation (B) Boosting of kon IgG1- FcγR in mixed allotype populations (G1m1,3, white; G1m1, gray; G1m-1,3 black). Color indicates predicted change in complex formation (C) The ratio of median change in complex formation with a boost in IgG1 over median change in complex formation with a boost in kon IgG1-FcγR at each boosting level. This ratio indicates which type of boost is predicted to be most effective for increasing complex formation (IgG1 concentration, purple; kon IgG1-FcγR, green).

Similar articles

Cited by

References

    1. Selva KJ, van de Sandt CE, Lemke MM, Lee CY, Shoffner SK, Chua BY, et al. . Systems Serology Detects Functionally Distinct Coronavirus Antibody Features in Children and Elderly. Nat Commun (2021) 12:1–14. doi: 10.1038/s41467-021-22236-7. 2021 12:1. - DOI - PMC - PubMed
    1. Adeniji OS, Giron LB, Purwar M, Zilberstein NF, Kulkarni AJ, Shaikh MW, et al. . Covid-19 Severity is Associated With Differential Antibody Fc-Mediated Innate Immune Functions. mBio (2021) 12:2037. doi: 10.1128/MBIO.00281-21 - DOI - PMC - PubMed
    1. DiLillo DJ, Tan GS, Palese P, Ravetch J V. Broadly Neutralizing Hemagglutinin Stalk–Specific Antibodies Require Fcγr Interactions for Protection Against Influenza Virus In Vivo. Nat Med (2014) 20:143–51. doi: 10.1038/nm.3443. 2014 20:2. - DOI - PMC - PubMed
    1. Aitken EH, Damelang T, Ortega-Pajares A, Alemu A, Hasang W, Dini S, et al. . Developing a Multivariate Prediction Model of Antibody Features Associated With Protection of Malaria-Infected Pregnant Women From Placental Malaria. eLife (2021) 10:e65776. doi: 10.7554/ELIFE.65776 - DOI - PMC - PubMed
    1. Lu LL, Chung AW, Rosebrock TR, Ghebremichael M, Yu WH, Grace PS, et al. . A Functional Role for Antibodies in Tuberculosis. Cell (2016) 167:433–443.e14. doi: 10.1016/J.CELL.2016.08.072 - DOI - PMC - PubMed

Publication types

LinkOut - more resources