. 2022 Feb 22:13:835830.
doi: 10.3389/fimmu.2022.835830. eCollection 2022.

Dominant CD8+ T Cell Nucleocapsid Targeting in SARS-CoV-2 Infection and Broad Spike Targeting From Vaccination

Affiliations

Dominant CD8+ T Cell Nucleocapsid Targeting in SARS-CoV-2 Infection and Broad Spike Targeting From Vaccination

Ellie Taus et al. Front Immunol. .

Abstract

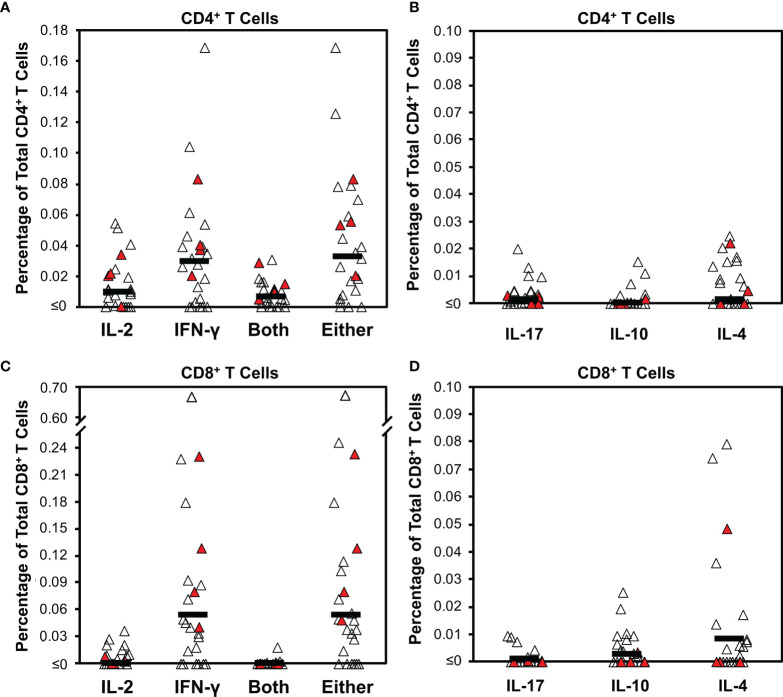
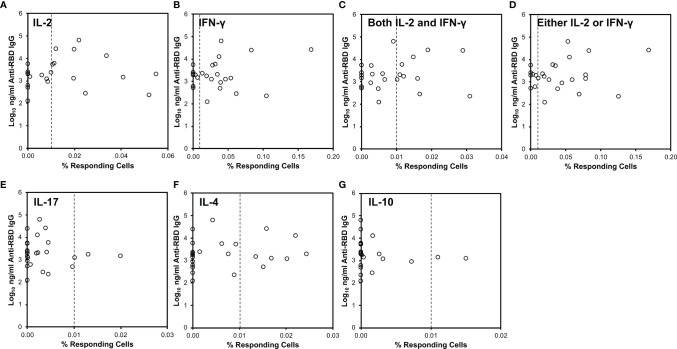
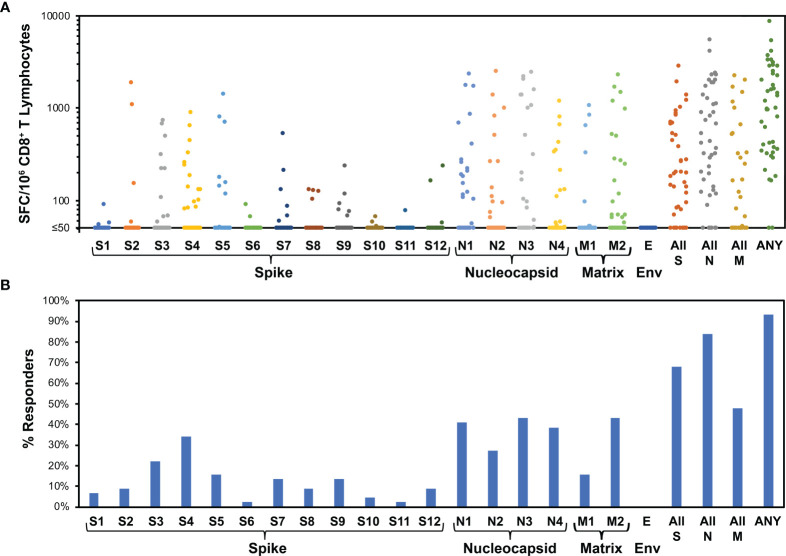
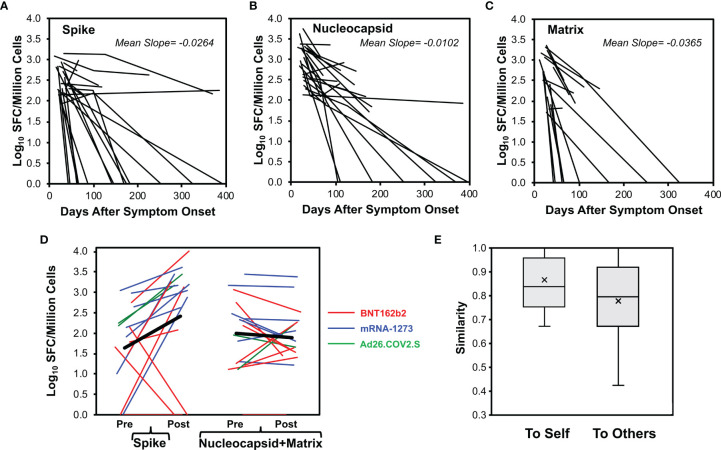
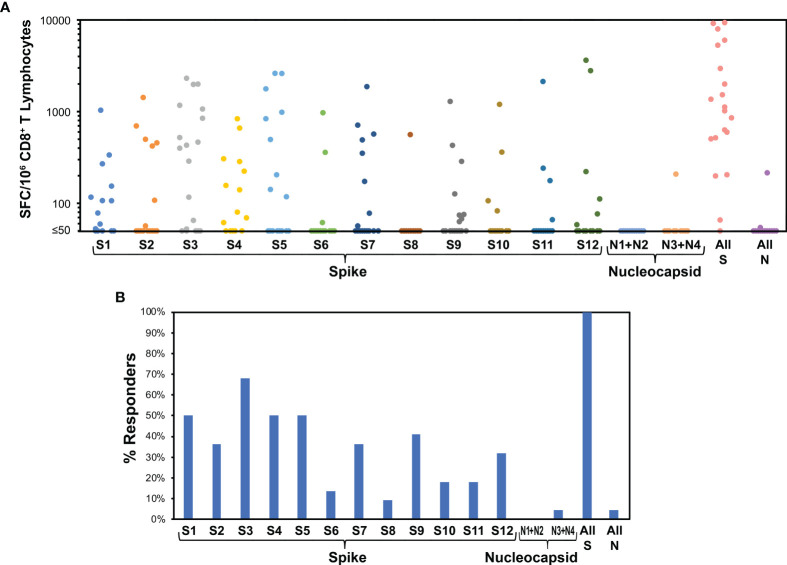
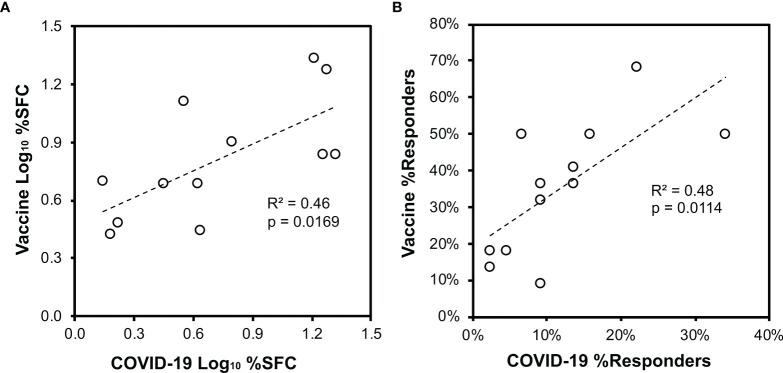
CD8+ T cells have key protective roles in many viral infections. While an overall Th1-biased cellular immune response against SARS-CoV-2 has been demonstrated, most reports of anti-SARS-CoV-2 cellular immunity have evaluated bulk T cells using pools of predicted epitopes, without clear delineation of the CD8+ subset and its magnitude and targeting. In recently infected persons (mean 29.8 days after COVID-19 symptom onset), we confirm a Th1 bias (and a novel IL-4-producing population of unclear significance) by flow cytometry, which does not correlate to antibody responses against the receptor binding domain. Evaluating isolated CD8+ T cells in more detail by IFN-γ ELISpot assays, responses against spike, nucleocapsid, matrix, and envelope proteins average 396, 901, 296, and 0 spot-forming cells (SFC) per million, targeting 1.4, 1.5, 0.59, and 0.0 epitope regions respectively. Nucleocapsid targeting is dominant in terms of magnitude, breadth, and density of targeting. The magnitude of responses drops rapidly post-infection; nucleocapsid targeting is most sustained, and vaccination selectively boosts spike targeting. In SARS-CoV-2-naïve persons, evaluation of the anti-spike CD8+ T cell response soon after vaccination (mean 11.3 days) yields anti-spike CD8+ T cell responses averaging 2,463 SFC/million against 4.2 epitope regions, and targeting mirrors that seen in infected persons. These findings provide greater clarity on CD8+ T cell anti-SARS-CoV-2 targeting, breadth, and persistence, suggesting that nucleocapsid inclusion in vaccines could broaden coverage and durability.

Keywords: CD8+ T cells; COVID-19; COVID-19 vaccine; SARS-CoV-2; cellular immunity.


Conflict of interest statement

The authors declare that the research was conducted in the absence of any commercial or financial relationships that could be construed as a potential conflict of interest.

Figures

Figure 1
Figure 1
Intracellular cytokine staining for T cell responses against SARS-CoV-2 early after infection demonstrates bias for IFN- γ production. Cytokine production was determined by intracellular cytokine staining for CD4+ and CD8+ T cell subsets after stimulation with a pool of overlapping peptides spanning spike combined with predicted CD4+ epitopes from across the proteome ( Supplementary Figure S1 ) for 25 persons (21 with mild infection, 4 with severe infection) a mean of 29.8 days from COVID-19 symptom onset (range 15 to 49 days). Filled symbols indicate persons who had severe infection. (A) The background-subtracted frequencies of CD4+ T cells producing IL-2, IFN-γ, both cytokines, or either cytokine are plotted. Dark horizontal bars indicate means, which were 0.010%, 0.030%, 0.007%, and 0.033%, respectively. Defining responses as being ≥0.01% above background, responders for these four cytokine response groupings were 12/25 (48%), 17/25 (68%), 10/25 (40%), and 18/25 (72%), respectively. (B) The background-subtracted frequencies of CD4+ T cells producing IL-17, IL-10, or IL-4 are plotted. Dark horizontal bars indicate means, which were 0.003%, 0.002%, and 0.007%, respectively. Defining responses as being ≥0.01% above background, responders for these three cytokine responses were 3/26 (11.5%), 2/26 (7.7%), 10/25 (40%), and 7/26 (26.9%), respectively. (C) The background-subtracted frequencies of CD8+ T cells producing IL-2, IFN-γ, both cytokines, or either cytokine are plotted. Dark horizontal bars indicate means, which were 0.001%, 0.053%, 0.000%, and 0.054%, respectively. Defining responses as being ≥0.01% above background, responders for these four cytokine response groupings were 6/25 (24%),17/25 (68%), 1/25 (4%), and 20/25 (80%), respectively. (D) The background-subtracted frequencies of CD8+ T cells producing IL-17, IL-10, or IL-4 are plotted. Dark horizontal bars indicate means, which were 0.002%, 0.004%, and 0.012% respectively. Defining responses as being ≥0.01% above background, responders for these three cytokine responses were 0/26 (0%), 3/26 (11.5%), 10/25 (40%), and 6/26 (23.1%), respectively.
Figure 2
Figure 2
CD4+ T cell cytokine responses against SARS-CoV-2 do not correlate to serum anti-RBD antibody levels. SARS-CoV-2-specific responses defined as in Figure 1 (x-axis) were compared to serum anti-RBD IgG antibody levels (y-axis). The vertical dotted line indicates 0.01% responding cells producing the indicated cytokine(s). (A) Relationship to IL-2-producing cells. (B) Relationship to IFN-γ-producing cells. (C) Relationship to cells producing both IL-2 and IFN-γ. (D) Relationship to cells producing either IL-2 or IFN-γ or both. (E) Relationship to IL-17-producing cells. (F) Relationship to IL-4-producing cells. (G) Relationship to IL-10-producing cells.
Figure 3
Figure 3
Evaluation of CD8+ T cell targeting of SARS-CoV-2 by ELISpot using peptide pools demonstrates broad targeting of spike, nucleocapsid, and matrix, with dominance of nucleocapsid targeting. For 44 persons after recent SARS-CoV-2 infection (36 with mild infection, 8 with severe infection, mean 31.1 days, range 11 to 47 days after symptom onset), IFN-γ ELISpot was performed on polyclonally expanded CD8+ T cells using peptides spanning spike, nucleocapsid, matrix, and envelope proteins, which were combined in pools of 16 or fewer ( Supplementary Table 1 ). Spike was contained in 12 pools (S1 to S12), nucleocapsid in four pools (N1 to N4), matrix in two pools (M1 to M2), and envelope in one pool (E). (A) Frequencies of responses against each pool are plotted for each participant. The mean total responses against spike, nucleocapsid, matrix, and envelope were 396 SFC/million CD8+ T cells, 901 SFC/million CD8+ T cells, 296 SFC/million CD8+ T cells, and 0 SFC/million CD8+ T cells, respectively. (B) Percentages of persons responding against each pool are plotted. Targeting of spike, nucleocapsid, matrix, and envelope was an average of 1.4, 1.5, 0.6, and 0.0 peptide pools per person, respectively. Response against pools S4 and S5, comprising the receptor binding domain of spike, was an average 0.5 peptide pools per person.
Figure 4
Figure 4
CD8+ T cell responses decay after SARS-CoV-2 infection but vaccination boosts memory against spike protein. CD8+ T cell responses were measured longitudinally by ELISpot assay in 29 persons monitored starting early SARS-CoV-2 infection (23 with mild infection, 6 with severe infection, starting <45 days after symptom onset), serial measurements are plotted for 23 total spike responses (A), 24 total nucleocapsid responses (B), and 16 total matrix responses (C). (D) For 17 persons with prior COVID-19 who were vaccinated with an available pre-vaccination measurement within 65 days (14 with mild infection, 3 with severe infection including one who had critical infection, vaccinated mean of 225 days post onset of symptoms, range 64 to 394 days), baseline pre-vaccination (mean of -21.9 days, range -63 to +3 days before vaccination) and resulting post-vaccination (first dose, mean of 12.8 days, range 5 to 29 days after vaccination) total response levels against spike and combined nucleocapsid plus matrix are plotted. Eight vaccinees received BNT162b2 (red), seven vaccinees received mRNA-1273 (blue), and two vaccinees received Ad26.COV2.S (green). Two non-responders had no detectable response at baseline and received BNT162b2. One non-responder had prior severe illness and the remainder had mild illness. (E) For the vaccinated persons, Sørenson similarity values were calculated between pre- and post- vaccination recognized spike pools within each person (self) and across all combinations with other persons (others). Box plots indicate 25th to 75th quartiles and medians, with medians (horizontal line) and means (x) marked. The high background similarity between individuals resulted from the high number of unrecognized pools (average 10.2/12 pools) and thus multiple shared unrecognized pools across persons.
Figure 5
Figure 5
Spike targeting after vaccination of persons without prior SARS-CoV-2 infection is broadly distributed. 22 persons without a history of SARS-CoV-2 infection were monitored for responses against spike and nucleocapsid (negative control) by ELISpot assay after vaccination with BNT162b2 (15 persons) or mRNA-1273 (7 persons). Responses were evaluated a mean of 11.3 days after the first vaccine dose (range 8 to 16 days). (A) Frequencies of responses against each pool are plotted for each participant. The mean total response against spike was 2,463 SFC/million CD8+ T cells. (B) Percentages of persons responding against each pool are plotted. Targeting of spike was an average of 4.2 pools per person. Response against pools S4 and S5, comprising the receptor binding domain of spike, was an average 1.0 peptide pools per person.
Figure 6
Figure 6
Vaccination of persons without prior SARS-CoV-2 infection elicits CD8+ T cell targeting of spike similar to natural infection. Across the 44 persons with recent SARS-CoV-2 infection ( Figure 3 ) and 22 persons after vaccination without prior SARS-CoV-2 infection ( Figure 5 ), CD8+ T cell responses against spike defined by ELISpot were compared. Pearson correlation p values are indicated. (A) The mean percentage contribution of each pool to the total spike response (log10 transformed) is plotted between the two groups. (B) The percentage of persons responding against each pool is plotted between the two groups.

Similar articles

Cited by

References

    1. Cromer D, Juno JA, Khoury D, Reynaldi A, Wheatley AK, Kent SJ, et al. Prospects for Durable Immune Control of SARS-CoV-2 and Prevention of Reinfection. Nat Rev Immunol (2021) 21:395–404. doi: 10.1038/s41577-021-00550-x - DOI - PMC - PubMed
    1. Sadarangani M, Marchant A, Kollmann TR. Immunological Mechanisms of Vaccine-Induced Protection Against COVID-19 in Humans. Nat Rev Immunol (2021) 21:475–84. doi: 10.1038/s41577-021-00578-z - DOI - PMC - PubMed
    1. Dougan M, Nirula A, Azizad M, Mocherla B, Gottlieb RL, Chen P, et al. Bamlanivimab Plus Etesevimab in Mild or Moderate Covid-19. N Engl J Med (2021) 385:1382–92. doi: 10.1056/NEJMoa2102685 - DOI - PMC - PubMed
    1. Libster R, Perez Marc G, Wappner D, Coviello S, Bianchi A, Braem V, et al. Early High-Titer Plasma Therapy to Prevent Severe Covid-19 in Older Adults. N Engl J Med (2021) 384:610–8. doi: 10.1056/NEJMoa2033700 - DOI - PMC - PubMed
    1. O'brien MP, Forleo-Neto E, Musser BJ, Isa F, Chan KC, Sarkar N, et al. Subcutaneous REGEN-COV Antibody Combination for Covid-19 Prevention. medRxiv (2021). doi: 10.1101/2021.06.14.21258567 - DOI

Publication types

MeSH terms