

Transcriptomics Analysis of Wheat Tassel Response to Tilletia laevis Kühn, Which Causes Common Bunt of Wheat
- PMID: 35273625
- PMCID: PMC8902468
- DOI: 10.3389/fpls.2022.823907
Transcriptomics Analysis of Wheat Tassel Response to Tilletia laevis Kühn, Which Causes Common Bunt of Wheat
Abstract
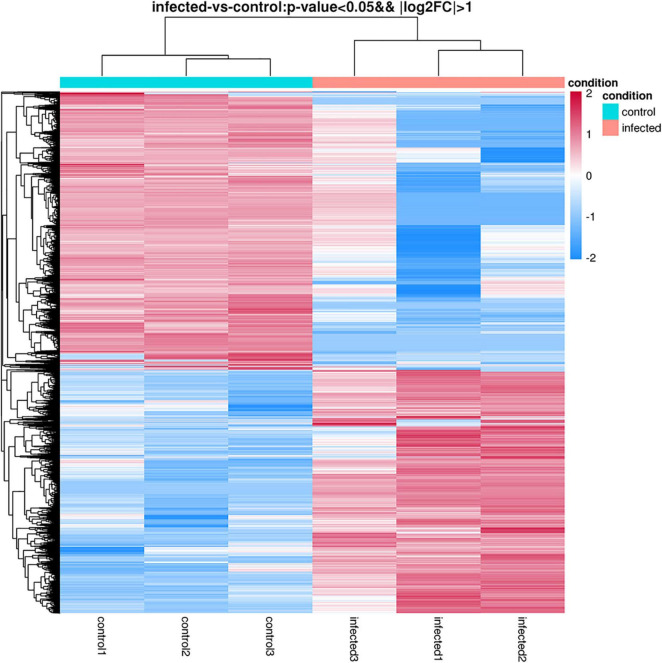
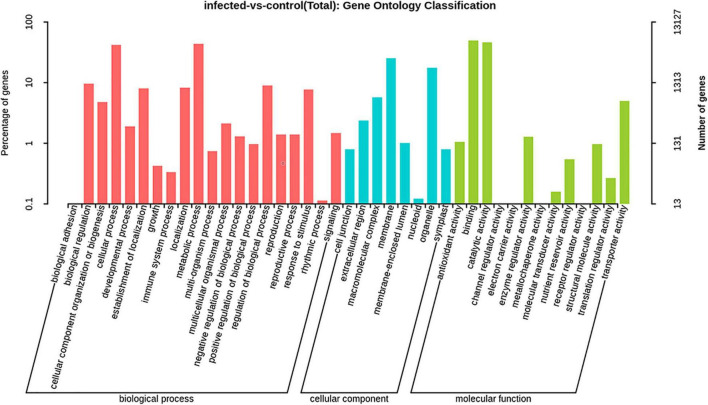
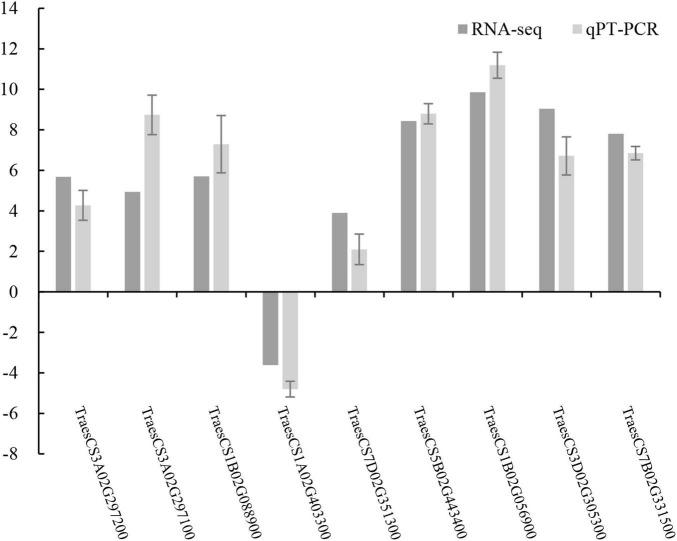
Tilletia laevis Kühn [synonym T. foetida (Wallr.) Liro] can lead to a wheat common bunt, which is one of the most serious diseases affecting kernels, a serious reduction in grain yield, and losses can reach up to 80% in favorable environments. To understand how wheat tassels respond to T. laevis, based on an RNA-Seq technology, we analyzed a host transcript accumulation on healthy wheat tassels and on tassels infected by the pathogen. Our results showed that 7,767 out of 15,658 genes were upregulated and 7,891 out of 15,658 genes were downregulated in wheat tassels. Subsequent gene ontology (GO) showed that differentially expressed genes (DEGs) are predominantly involved in biological processes, cellular components, and molecular functions. Additionally, Kyoto Encyclopedia of Genes and Genomes (KEGG) enrichment analysis showed that 20 pathways were expressed significantly during the infection of wheat with T. laevis, while biosynthesis of amino acids, carbon metabolism, and starch and sucrose metabolism pathways were more highly expressed. Our findings also demonstrated that genes involved in defense mechanisms and myeloblastosis (MYB) transcription factor families were mostly upregulated, and the RNA-seq results were validated by quantitative real-time polymerase chain reaction (qRT-PCR). This is the first report on transcriptomics analysis of wheat tassels in response to T. laevis, which will contribute to understanding the interaction of T. laevis and wheat, and may provide higher efficiency control strategies, including developing new methods to increase the resistance of wheat crops to T. laevis-caused wheat common bunt.
Keywords: Tilletia foetida; defense response; transcriptomic; wheat common bunt; wheat tassel.
Copyright © 2022 He, Ren, Muhae-Ud-Din, Guo, Liu, Chen and Gao.
Conflict of interest statement
The authors declare that the research was conducted in the absence of any commercial or financial relationships that could be construed as a potential conflict of interest.
Figures


References
-
- Bokore F. E., Cuthbert R. D., Knox R. E., Singh A., Campbell H. L., Pozniak C. J., et al. (2019). Mapping quantitative trait loci associated with common bunt resistance in a spring wheat (Triticum aestivum L.) variety Lillian. Theor. Appl. Genet. 132 3023–3033. 10.1007/s00122-019-03403-3 - DOI - PMC - PubMed
LinkOut - more resources
Full Text Sources