. 2022 Apr 1;135(7):jcs258809.
doi: 10.1242/jcs.258809. Epub 2022 Apr 1.

Piezo1 activation attenuates thrombin-induced blebbing in breast cancer cells

Affiliations

Piezo1 activation attenuates thrombin-induced blebbing in breast cancer cells

Paul O'Callaghan et al. J Cell Sci. .

Abstract

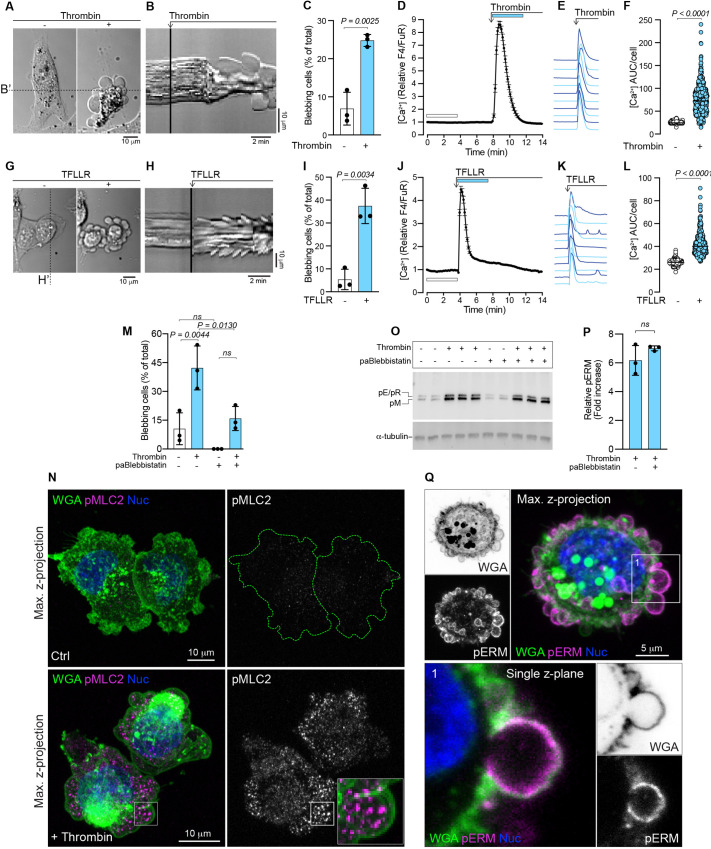
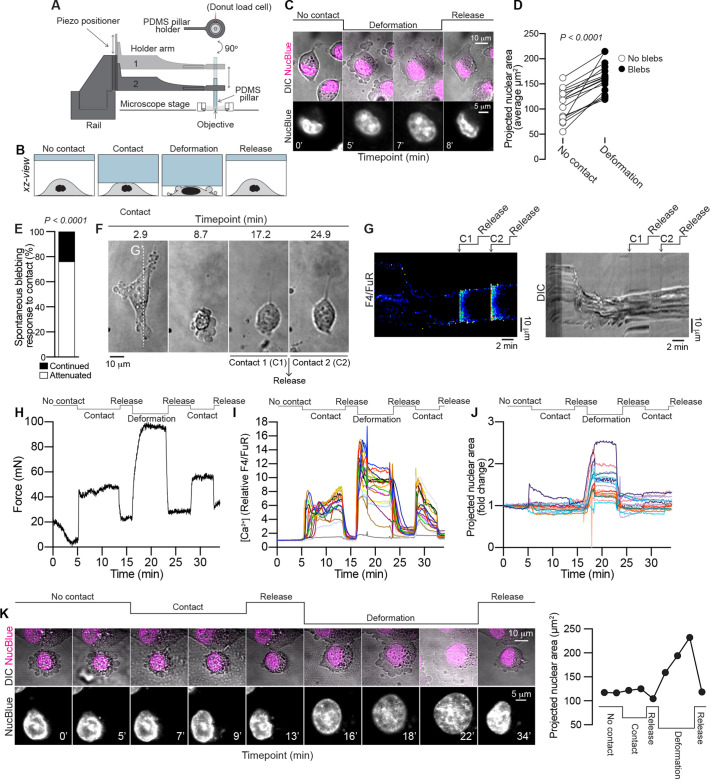
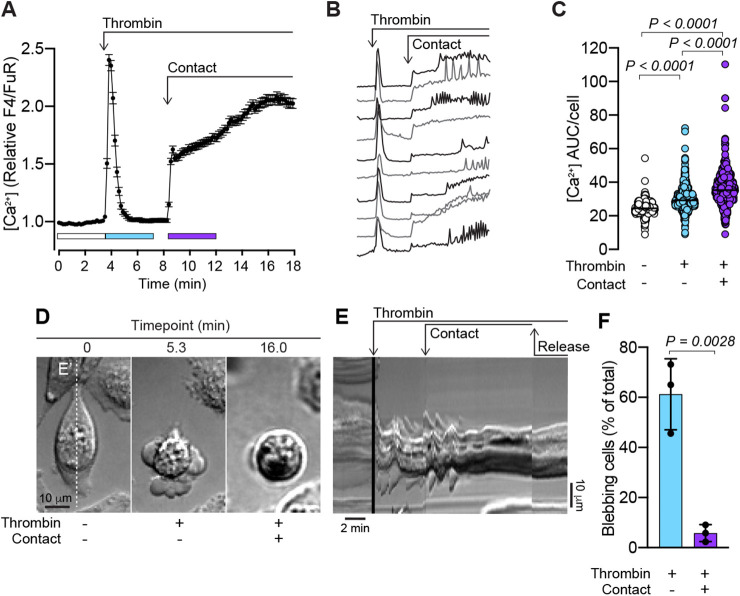
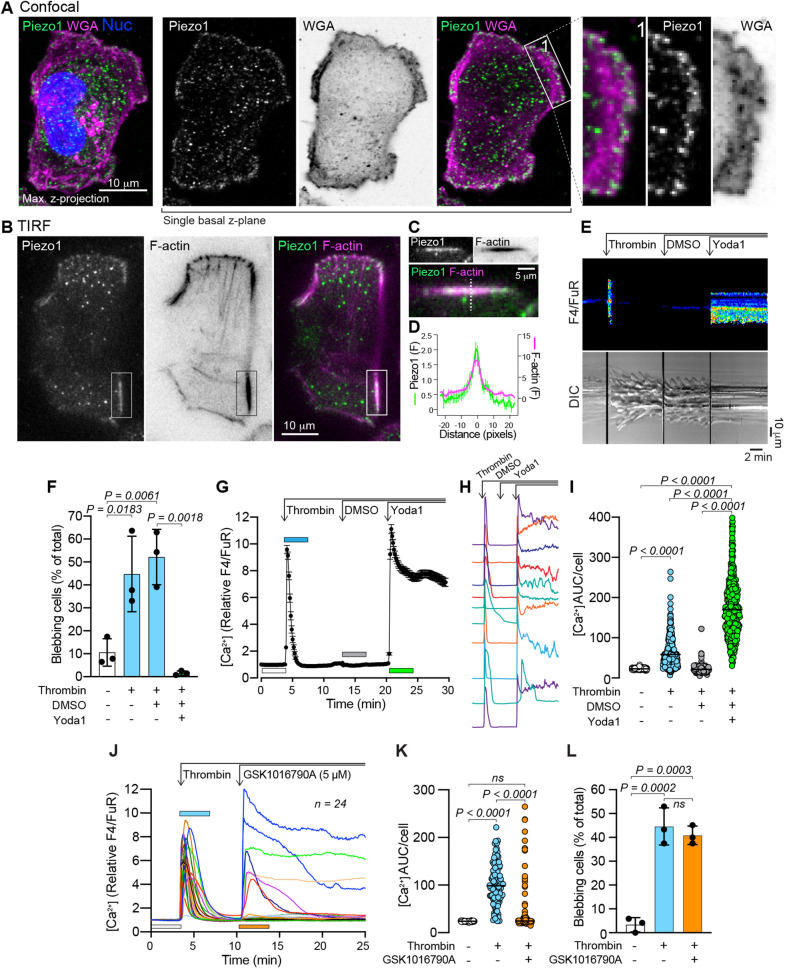
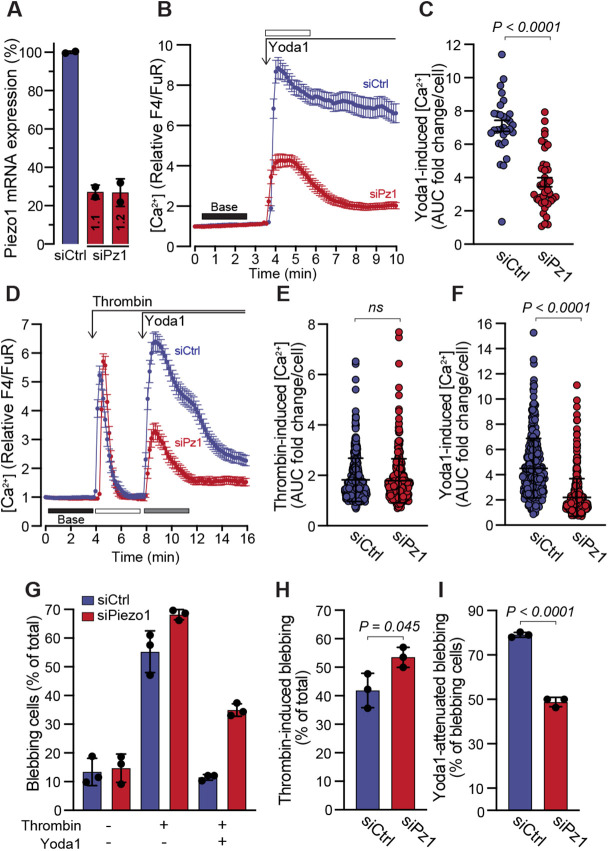
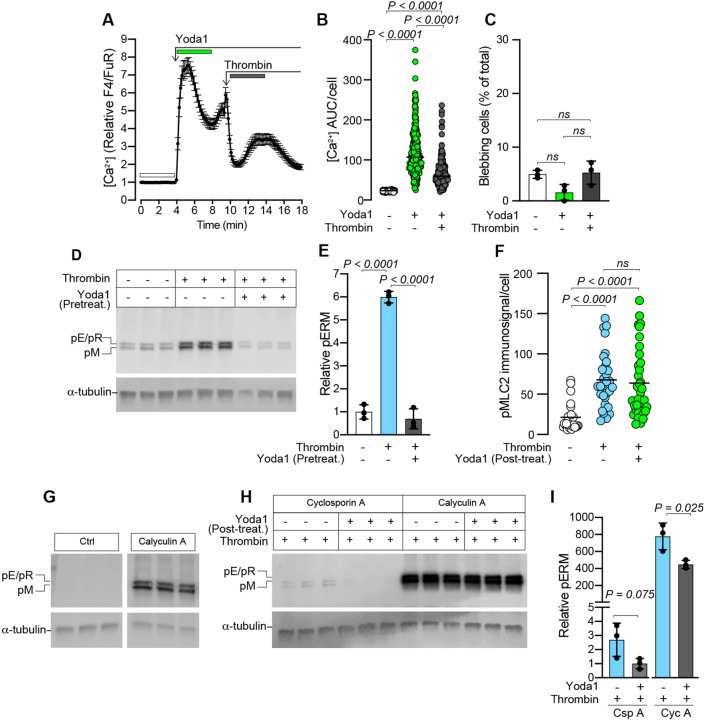
Cancer cells exploit a variety of migration modes to leave primary tumors and establish metastases, including amoeboid cell migration, which is typically reliant on bleb formation. Here we demonstrate that thrombin induces dynamic blebbing in the MDA-MB-231 breast cancer cell line and confirm that protease-activated receptor 1 (PAR1) activation is sufficient to induce this effect. Cell confinement has been implicated as a driving force in bleb-based migration. Unexpectedly, we found that gentle contact compression, exerted using a custom built 'cell press' to mechanically stimulate cells, reduced thrombin-induced blebbing. Thrombin-induced blebbing was similarly attenuated using the small molecule Yoda1, an agonist of the mechanosensitive Ca2+ channel Piezo1, and this attenuation was impaired in Piezo1-depleted cells. Additionally, Piezo1 activation suppressed thrombin-induced phosphorylation of ezrin, radixin and moesin (ERM) proteins, which are implicated in the blebbing process. Our results provide mechanistic insights into Piezo1 activation as a suppressor of dynamic blebbing, specifically that which is induced by thrombin.

Keywords: Blebbing; Breast cancer; Piezo1; Thrombin.


Conflict of interest statement

Competing interests The authors declare no competing or financial interests.

Figures

Fig. 1.
Fig. 1.
Thrombin stimulation and PAR1 activation induces blebbing in MDA-MB-231 cells. (A) Representative example of thrombin-induced blebbing in an MDA-MB-231 cell (see also Movie 2). The cell is presented before (left) and after (right) the addition of thrombin. Scale bar: 10 µm. (B) Kymograph plotted from the time-lapse signals recorded under the dashed line B′ in A; the point at which thrombin is added is indicated. Scale bars: 2 min (horizontal), 10 µm (vertical). (C) Quantification of blebbing in MDA-MB-231 cell populations before and after thrombin treatment. Bars represent the mean±s.d. from three experiments. (D) Thrombin-induced changes in cytosolic Ca2+ in MDA-MB-231 cells as quantified by ratiometric measurements of relative Fluo-4/Fura Red (F4/FuR) fluorescence. The mean values±s.e.m. over time for n=119 cells are plotted. (E) Examples of thrombin-induced Ca2+ responses from individual cells from the data set in D. (F) Quantification of Ca2+ area under the curve (AUC) per cell calculated from the relative F4/FuR plots for the durations indicated by the color-coded bars in D before and after thrombin treatment (n=593 cells, from the three experiments in C). (G) Induction of blebbing by TFLLR stimulation in an MDA-MB-231 cell. The cell is presented before (left) and after (right) the addition of TFLLR. Scale bar: 10 µm. (H) Kymograph plotted from the signal recorded under the dashed line H′ in panel G, the point at which TFLLR is added is indicated. Scale bars: 2 min (horizontal), 10 µm (vertical). (I) Quantification of blebbing in MDA-MB-231 cell populations before and after TFLLR treatment. Bars represent the mean±s.d. from three experiments. (J) Effect of TFLLR-treatment on cytosolic Ca2+. The plot represents the mean±s.e.m. over time for n=95 cells from one experiment. (K) Examples of TFLLR-induced Ca2+ responses from individual cells from the data set in J. (L) Quantification of Ca2+ AUC/cell for the durations indicated by the color-coded bars in J (n=392 cells from the three experiments in I). (M) Quantification of blebbing in MDA-MB-231 cell populations before and after thrombin treatment, and with or without pre-treatment (1 h) with para-aminoblebbistatin (paBlebbistatin). Bars represent the mean±s.d. for three experiments. (N) Maximum intensity z-projection images, collected by confocal microscopy, of control (Ctrl) and thrombin treated (+Thrombin) MDA-MB-231 cells immunostained for pMLC2 and counterstained with WGA for the plasma membrane, and NucBlue (Nuc) for nuclei. The peripheries of the pMLC2-stained Ctrl cells are outlined with a dashed green line. The inset in the lower right panel encloses a single bleb and illustrates pMLC2 distribution relative to the bleb membrane. Scale bars: 10 µm. (O) Immunoblotting for pERMs (pE, phospho-ezrin; pR, pospho-radixin; pM, phospho-moesin) in MDA-MB-231 cells pre-treated (1 h) with or without para-aminoblebbistatin (20 µM), followed by thrombin (1 U/ml) exposure for 5 min. α-tubulin was used as a loading control. The sample lanes for each condition represent biological replicates from the same experiment. (P) Quantification of pERM levels relative to α-tubulin, induced by thrombin with and without para-aminoblebbistatin pre-treatment from the blots in O; bars represent the mean±s.d. (Q) Maximum intensity z-projection image, collected by confocal microscopy, of a thrombin-treated MDA-MB-231 cell immunostained for pERMs and counterstained with WGA and NucBlue. A single z-plane from region 1, which is framed and enlarged, illustrates enrichment of pERMs associated with the bleb membrane. Scale bar: 5 µm. The P-values were determined by using an unpaired two-tailed Student's t-test in C, I and P, one-way ANOVA with Tukey's multiple comparisons in M, and Wilcoxon matched-pairs signed rank test in F and L. ns, not significant.
Fig. 2.
Fig. 2.
Contact compression attenuates spontaneous blebbing. (A) Overview of the cell press setup mounted on a confocal microscope stage. MDA-MB-231 cells were subjected to compression using a PDMS pillar attached to a vertical piezoelectric track. Force measurements were recorded using a Futek donut load cell. (B) Cells were imaged during no contact, contact compression, deformation compression, and after release of compression. The cartoon presents a side-on view (xz-view) of the cell during the different compression states. (C) Time-lapse microscopy of cell (DIC) and nucleus (NucBlue) morphological changes during deformation-induced bleb formation and following release of compression. Scale bars: 10 µm (top), 5 µm (bottom). (D) Quantitative analysis of the projected nuclear area of individual cells before and after deformation-induced bleb formation (n=17 cells). The P-value was determined by paired two-tailed Student's t-test. (E) Quantitative analysis of contact-mediated attenuation of spontaneous blebbing (n=21 cells). The P-value was determined by Fisher's exact test. (F) Time-lapse images of bleb attenuation following contact compression (C1). Blebbing did not reoccur following release of compression or by a second gentle contact compression event (C2). Scale bar: 10 µm. (G) Kymographs of the changes in cytosolic Ca2+ (left) and cell morphology (right), recorded by confocal and DIC microscopy, respectively. Signals were plotted from under the vertical dashed line G′ in panel F. See Materials and Methods for details of how the ratiometric images were prepared. Scale bars: 2 min (horizontal), 10 µm (vertical). (H) Force measurements during the indicated states of contact compression, deformation compression and release. (I) Changes in cytosolic Ca2+ during the different compressive states outlined above the traces. (J) Changes in projected nuclear area during the different compressive states outlined above the traces. Individual traces from a sample of n=20 cells from one experiment are shown in I and J. (K) Time-lapse imaging of a blebbing MDA-MB-231 cell in which blebbing was first attenuated by contact compression, after which compression was released and the cell was subsequently subjected to deformation compression, which induced bleb formation, which was reversed upon release of compression. The projected nuclear area measurements are shown to the right. Scale bars: 10 µm (top), 5 µm (bottom).
Fig. 3.
Fig. 3.
Contact compression attenuates thrombin-induced blebbing. (A) Thrombin- (1 U/ml) and contact-induced changes in cytosolic Ca2+ in MDA-MB-231 cells. The plot represents the mean±s.e.m. over time (n=163 cells, from one experiment). (B) Examples of individual thrombin- and contact-induced Ca2+ responses from individual MDA-MB-231 cells. (C) Quantification of Ca2+ AUC/cell for the durations indicated by the color-coded bars in A for n=556 cells from three experiments. (D) Time-lapse of an MDA-MB-231 cell illustrating thrombin-induced blebbing and its attenuation by gentle contact compression (see also Movie 3). Scale bar: 10 µm. (E) Kymograph of the time-lapse sequence plotted from under the vertical dashed line E′ in panel D. Timepoints for thrombin addition, contact compression and release of compression are annotated. Scale bars: 2 min (horizontal), 10 µm (vertical). (F) Quantification of blebbing in MDA-MB-231 cell populations in the presence of thrombin before and after contact compression. Bars represent the mean±s.d., for the same three experiments analyzed in C. The P-values were determined by using the Friedman test with Dunn's multiple comparisons in C, and by unpaired two-tailed Student's t-test in F.
Fig. 4.
Fig. 4.
Piezo1 activation by Yoda1 attenuates thrombin-induced blebbing. (A) Maximum intensity z-projection image, collected by confocal microscopy, of an MDA-MB-231 cell immunostained for Piezo1 and counterstained with WGA and NucBlue. A single z-plane from the same z-stack reveals Piezo1 distribution in the most basal region of the plasma membrane, and the framed and enlarged region 1 illustrate the presence of Piezo1 enrichment at the periphery of the cell. Scale bar: 10 µm. (B) TIRF microscopy images of a cell stained for Piezo1 and F-actin. Scale bar: 10 µm. (C) Enlarged and rotated view of the area enclosed by the rectangle in panel B. Scale bar: 5 µm. (D) Relative fluorescence intensity profile of Piezo1 and F-actin staining under linear regions of interest similar to that indicated by the dashed line in C, i.e. plotted transversely through F-actin filaments. The plot represents the mean±s.e.m. from 11 structures from three cells. (E) Kymographs of the changes in cytosolic Ca2+ (top) and cell morphology (bottom) before and after sequential addition of thrombin, DMSO and Yoda1 in a single MDA-MB-231 cell, recorded by confocal and DIC microscopy (see also Movie 4). Scale bars: 2 min (horizontal), 10 µm (vertical). (F) Quantification of blebbing in MDA-MB-231 cell populations before and after sequential addition of thrombin, DMSO, and Yoda1. Bars represent the mean±s.d. from three experiments. (G) Changes to cytosolic Ca2+ (relative F4/FuR ratio) in cells before and after thrombin (1 U/ml), DMSO and Yoda1 (20 µM) addition. The plot represents the mean±s.e.m. over time (n=148 cells). (H) Examples of individual Ca2+ responses during sequential thrombin, DMSO and Yoda1 treatment from individual cells. (I) Quantification of Ca2+ AUC/cell from the relative F4/FuR plots for the durations indicated by the color-coded bars in G (n=401 cells from the same three experiments analyzed in F). (J) Changes to cytosolic Ca2+ (relative F4/FuR ratio) in cells before and after thrombin (1 U/ml) and the TRPV4 agonist GSK1016790A (5 µM) addition. Plots from individual cells (n=24) from one experiment are presented. (K) Quantification of Ca2+ AUC/cell from the relative F4/FuR plots for the durations indicated by the color-coded bars in J (n=106 cells from three experiments). (L) Quantification of blebbing in MDA-MB-231 cell populations before and after sequential addition of thrombin and GSK1016790A. Bars represent the mean±s.d. from the same three experiments analyzed in K. The P-values were determined by using one-way ANOVA with Tukey's multiple comparisons in F and L, and the Friedman test with Dunn's multiple comparisons in I and K.
Fig. 5.
Fig. 5.
Piezo1 depletion impairs the capacity of Yoda1 to attenuate blebbing. (A) Relative expression of Piezo1 mRNA in cells transfected with control siRNA (siCtrl) or two siRNAs targeting Piezo1 (siPz1 1.1 and 1.2). Bars represent the mean±s.d. from two transfections. (B) Yoda1 (20 µM) induced changes to cytosolic Ca2+ in siCtrl or siPz1 transfected cells. The plot represents the mean±s.e.m. over time for n=30 siCtrl and n=40 siPz1 cells. (C) Quantification of Yoda1-induced Ca2+ AUC fold change/cell from the relative F4/FuR plots in B for the durations indicated by the color-coded bars. (D) Effects of sequential treatments with thrombin (1 U/ml) and Yoda1 (20 µM) on cytosolic Ca2+ in siCtrl and siPiezo1 transfected cells. The plot represents the mean±s.e.m. (n=130 for siCtrl and n=95 for siPz1 transfected cells, each from one experiment). (E,F) Quantification of thrombin- and Yoda1-induced Ca2+ increase from the relative F4/FuR plots for the durations indicated by the color-coded bars in D (n=365 siCtrl cells and n=370 siPz1 cells from three experiments). (G) Quantification of blebbing in siCtrl- and siPz1-transfected cells from the experiments in D–F. (H) Quantification of blebbing induced by thrombin in siCtrl and siPz1. (I) Quantification of blebbing attenuation in siCtrl and siPz1 cells in response to Yoda1. In G–I, bars represent the mean±s.d. The P-values were determined by using the Mann–Whitney test in C, E and F, and unpaired two-tailed Student's t-test in H and I.
Fig. 6.
Fig. 6.
Pretreatment with Yoda1 inhibits thrombin-induced blebbing and ERM phosphorylation. (A) Yoda1- (20 µM) and thrombin- (1 U/ml) induced changes to cytosolic Ca2+ in MDA-MB-231 cells. The plot represents the mean±s.e.m. over time for n=70 cells from one experiment. (B) Quantification of Ca2+ AUC/cell for the durations indicated by the color-coded bars in A (n=258 cells from three experiments). P-values were determined by the Friedman test with Dunn's multiple comparisons. (C) Quantification of blebbing in cell populations treated sequentially with Yoda1 and then thrombin as indicated; bars represent the mean±s.d. for the same three experiments analyzed in B. P-values were determined by one-way ANOVA with Tukey's multiple comparisons. (D) Immunoblotting for pERMs in cells pre-treated for 15 min with or without Yoda1 (20 µM), followed by thrombin (1 U/ml) exposure for 5 min. (E) Quantification of pERM band intensities relative to α-tubulin loading controls for the samples in panel D. Bars represent the mean±s.d. for three samples. (F) Quantitative image analysis of pMLC2 immunofluorescence/cell in untreated control cells, or cells treated with thrombin (5 min), followed by 10 min incubation with or without Yoda1. Plots represent average pMLC2 intensity for n=26, 30 and 35 cells, respectively from one experiment. P-values were determined by Kruskal–Wallis test with Dunn's multiple comparisons. (G) Immunoblotting for phosphorylated ERMs in cells incubated with or without Calyculin A (50 nM); the Ctrl and Calyculin A panels in G were cropped from the same immunoblotted membrane. (H) Immunoblotting for pERMs in cells first stimulated with thrombin (1 U/ml) followed by 5 min treatment with Calyculin A (50 nM) or Cyclosporin A (250 nM), and subsequently (5 min later) treated with or without Yoda1 (20 µM) for 15 min. α-tubulin was used as a loading control in D, G and H. (I) Quantification of pERM band intensities relative to α-tubulin loading controls for the samples in F. Bars represent the mean±s.d. The P-values were determined by unpaired two-tailed Student's t-test. For the immunoblots in D, G and H, the sample lanes for each condition represent biological replicates from the same experiment.

References

    1. Adyshev, D. M., Dudek, S. M., Moldobaeva, N., Kim, K.-M., Ma, S.-F., Kasa, A., Garcia, J. G. N. and Verin, A. D. (2013). Ezrin/radixin/moesin proteins differentially regulate endothelial hyperpermeability after thrombin. Am. J. Physiol. Lung Cell. Mol. Physiol. 305, L240-L255. 10.1152/ajplung.00355.2012 - DOI - PMC - PubMed
    1. Agarwal, P., Lee, H.-P., Smeriglio, P., Grandi, F., Goodman, S., Chaudhuri, O. and Bhutani, N. (2021). A dysfunctional TRPV4–GSK3β pathway prevents osteoarthritic chondrocytes from sensing changes in extracellular matrix viscoelasticity. Nat. Biomed. Eng. 5, 1472-1484. 10.1038/s41551-021-00691-3 - DOI - PMC - PubMed
    1. Ahn, J.-H., Sung, J. Y., Mcavoy, T., Nishi, A., Janssens, V., Goris, J., Greengard, P. and Nairn, A. C. (2007). The B″/PR72 subunit mediates Ca2+-dependent dephosphorylation of DARPP-32 by protein phosphatase 2A. Proc. Natl Acad. Sci. USA 104, 9876-9881. 10.1073/pnas.0703589104 - DOI - PMC - PubMed
    1. Aoki, K., Maeda, F., Nagasako, T., Mochizuki, Y., Uchida, S. and Ikenouchi, J. (2016). A RhoA and Rnd3 cycle regulates actin reassembly during membrane blebbing. Proc. Natl Acad. Sci. USA 113, E1863-E1871. 10.1073/pnas.1600968113 - DOI - PMC - PubMed
    1. Ben-Aissa, K., Patino-Lopez, G., Belkina, N. V., Maniti, O., Rosales, T., Hao, J.-J., Kruhlak, M. J., Knutson, J. R., Picart, C. and Shaw, S. (2012). Activation of moesin, a protein that links actin cytoskeleton to the plasma membrane, occurs by phosphatidylinositol 4,5-bisphosphate (PIP2) binding sequentially to two sites and releasing an autoinhibitory linker. J. Biol. Chem. 287, 16311-16323. 10.1074/jbc.M111.304881 - DOI - PMC - PubMed