. 2022 May 13;208(1):83-94.
doi: 10.1093/cei/uxac013.

Differentiation of circulating monocytes into macrophages with metabolically activated phenotype regulates inflammation in dyslipidemia patients

Affiliations

Differentiation of circulating monocytes into macrophages with metabolically activated phenotype regulates inflammation in dyslipidemia patients

Elena Berenice Martínez-Shio et al. Clin Exp Immunol. .

Abstract

Macrophages are mediators of inflammation having an important role in the pathogenesis of cardiovascular diseases. Recently, a pro-inflammatory subpopulation, known as metabolically activated macrophages (MMe), has been described in conditions of obesity and metabolic syndrome where they are known to release cytokines that can promote insulin resistance. Dyslipidemia represents an important feature in metabolic syndrome and corresponds to one of the main modifiable risk factors for the development of cardiovascular diseases. Circulating monocytes can differentiate into macrophages under certain conditions. They correspond to a heterogeneous population, which include inflammatory and anti-inflammatory subsets; however, there is a wide spectrum of phenotypes. Therefore, we decided to investigate whether the metabolic activated monocyte (MoMe) subpopulation is already present under dyslipidemia conditions. Secondly, we assessed whether different levels of cholesterol and triglycerides play a role in the polarization towards the metabolic phenotype (MMe) of macrophages. Our results indicate that MoMe cells are found in both healthy and dyslipidemia patients, with cells displaying the following metabolic phenotype: CD14varCD36+ABCA1+PLIN2+. Furthermore, the percentages of CD14++CD68+CD80+ pro-inflammatory monocytes are higher in dyslipidemia than in healthy subjects. When analysing macrophage differentiation, we observed that MMe percentages were higher in the dyslipidemia group than in healthy subjects. These MMe have the ability to produce high levels of IL-6 and the anti-inflammatory cytokine IL-10. Furthermore, ABCA1 expression in MMe correlates with LDL serum levels. Our study highlights the dynamic contributions of metabolically activated macrophages in dyslipidemia, which may have a complex participation in low-grade inflammation due to their pro- and anti-inflammatory function.

Keywords: Metabolically activated macrophages; dyslipidemia; immune regulation; interleukin-10 (IL-10); monocytes.


Figures

Graphical Abstract
Graphical Abstract
Figure 1.
Figure 1.
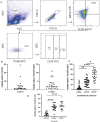
Circulating monocytes express metabolic markers. Peripheral blood was obtained from healthy and dyslipidemic individuals to analyse metabolic markers in circulating monocytes. (A) Cells were analysed by multiparametric flow cytometry. (B) Bloodstream monocytes with metabolic phenotype (MoMe) levels according to ABCA1, CD36 (n = 19) and PLIN2 (n = 20) expression in healthy subjects. (C, D) CD14 expression in metabolic monocytes. Data shown in panel B had a non-Gaussian distribution and correspond to the median and Q1 and Q3. Groups in panel C were compared using one-way ANOVA (Friedman test). Groups in panel D were compared using repeated-measures ANOVA. ∗P < 0.05, ∗∗P < 0.01, ∗∗∗P < 0.001, ∗∗∗∗P < 0.0001.
Figure 2.
Figure 2.
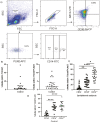
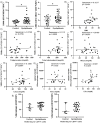
Metabolic monocytes in healthy individuals and in patients with dyslipidemia. Bloodstream MoMe percentages from subjects with elevated lipid levels (triglycerides >150 mg/dl, total cholesterol >200 mg/dl) and healthy subjects. (A) MoMe percentages evaluated with 2 (n = control 19, dyslipidemia 31) and 3 (n = control 20, dyslipidemia 32) metabolic markers. Relative expression of PPAR-γ mRNA in healthy individuals (n = 4) and in patients with dyslipidemia (n = 8). (B) Different MoMe subsets according to their CD14 expression, divided into CD14 negative (n = control 20, dyslipidemia 31), dim (n = control 19, dyslipidemia 31) and high (n = control 19, dyslipidemia 31) expression. (C) Correlations between metabolic monocytes percentages and total cholesterol (n = 29) or triglycerides (n = 29) or body mass index (D, n = 27) in subjects with dyslipidemia. All data shown had a non-Gaussian distribution and correspond to the median and Q1 and Q3. Groups were compared using Mann-Whitney test in panel A and B. Spearman r analysis was performed in panel C. Linear regression was performed. P value represents the likelihood of a nonzero slope.
Figure 3.
Figure 3.
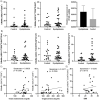
Evaluation of M1- and M2-like monocytes levels in healthy subjects and in patients with dyslipidemia. (A) Using flow cytometry, starting from monocytes gate defined by FSC and SSC parameters, doble cells were eliminated and then, CD14 expression was evaluated. (B) CD14 expression in M1-like monocytes (n = 26) from dyslipidemia subjects, control subjects (n = 11) and CD14++CD68+CD80+ comparation between patients (n = 26) and controls (n = 11). (C) CD14 expression in M2-like monocytes from subjects with dyslipidemia (n = 26), control subjects (n = 11) and CD14+CD163+CD206+ comparation between patients (n = 26) and controls (n = 12). Data shown in bars graph B and healthy subjects individual values graphs C had a non-Gaussian distribution and correspond to the median and Q1 and Q3. Data shown in individual values graphs and bars graph C had a normal distribution and correspond to the arithmetic mean and SD. Groups were compared using paired t-test, Mann-Whitney test, Wilcoxon test or unpaired t-test. ∗P < 0.05, ∗∗∗P < 0.001, ∗∗∗∗P < 0.0001.
Figure 4.
Figure 4.
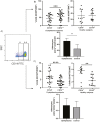
Metabolic stimuli promote differentiation to metabolically activated (MMe), classical (M1), and alternative macrophages (M2). Monocytes were purified from healthy and dyslipidemia subjects, cells were incubated with metabolic stimuli, dyed, and analysed by flow cytometry for the expression of characteristic polarization markers, M1 (CD14+CD68+CD80+), M2 (CD14+CD163+CD206+) and MMe (CD14+ABCA1+CD36+PLIN2+). (A) Cell culture conditions and MMe gating strategy. (B) Comparison of MMe, M1 and M2 percentages, obtained from the incubation with metabolic stimuli of monocytes from dyslipidemia patients (n = 9) and control subjects (n = 6). Groups were compared using two-way repeated-measures ANOVA. ∗P < 0.05, ∗∗∗P < 0.001.
Figure 5.
Figure 5.
Metabolically activated (MMe), classical (M1), and alternative (M2) macrophage differentiation in dyslipidemia and healthy subjects. MMe (glucose, insulin, palmitate), M1 (IFN-γ, LPS) and M2 (IL-4) macrophages obtained from culture from dyslipidemia and healthy subjects. (A) MMe comparison between control and dyslipidemia subjects evaluated with 2 (n = control 21, dyslipidemia 28; median and IQR) and 3 (n = control 21, dyslipidemia 28; arithmetic mean and SD) metabolic markers. (B) Correlation between MMe percentages and body mass index (n = 24). (C) Correlation between MMe percentages and triglycerides (n = 27), total cholesterol (n = 27), HDLc (n = 27) and LDLc (n = 26). (D) ABCA1 MFI compared with HDLc (n = 27) and LDLc (n = 25). (E) Monocyte-derived M1 (n = control 9, dyslipidemia 23) and M2 (n = control 9, dyslipidemia 22) macrophages in control and dyslipidemia subjects. Groups were compared using Mann-Whitney test or unpaired t-test. Spearman r analysis was performed. Linear regression was performed. P value represents the likelihood of a nonzero slope. ∗P < 0.05.
Figure 6.
Figure 6.
Cytokine production by macrophages from dislypidemic patients and healthy controls. Supernatants from polarization cultures with metabolic stimuli or LPS were collected and analysed by flow cytometry using a Cytometric Bead Array kit. (A) IL-12 quantification in M1 and MMe cell culture supernatants from healthy subjects (n = 7). (B) IL-10 (n = 8) and IL-6 (n = 7) quantification in M1 and MMe cell culture supernatants from patients. Representative plot of flow cytometry (n = 3) for CD14+CD36+PLIN2+ macrophages expressing IL-10 (red) compared with undyed control (blue). (C) Cytokine concentrations produced by MMe from healthy and dyslipidemia subjects. (D) IL-12 quantification in serum from control (n = 7) and dyslipidemia subjects (n = 13). Data shown in A, B and D had a non-Gaussian distribution and correspond to the median and Q1 and Q3. Groups were compared using Wilcoxon matched-pairs signed-rank test or Mann-Whitney test. Groups were compared using two-way ANOVA. ∗P < 0.05, ∗∗∗P < 0.001.

References

    1. World Health Organization. Cardiovascular Diseases (CVDs). 2021. https://www.who.int/en/news-room/fact-sheets/detail/cardiovascular-disea...
    1. Ebbert JO, Jensen MD. Fat depots, free fatty acids, and dyslipidemia. Nutrients 2013, 5, 498–508. doi:10.3390/nu5020498. - DOI - PMC - PubMed
    1. Ooga T, Sato H, Nagashima A, et al. . Metabolomic anatomy of an animal model revealing homeostatic imbalances in dyslipidaemia. Mol Biosyst 2011, 7, 1217–23. doi:10.1039/c0mb00141d. - DOI - PubMed
    1. Ameer F, Scandiuzzi L, Hasnain S, Kalbacher H, Zaidi N. De novo lipogenesis in health and disease. Metab Clin Exp 2014, 63, 895–902. doi:10.1016/j.metabol.2014.04.003. - DOI - PubMed
    1. Norata GD, Caligiuri G, Chavakis T, et al. . The cellular and molecular basis of translational immunometabolism. Immunity. 2015, 43, 421–34. doi:10.1016/j.immuni.2015.08.023. - DOI - PubMed

Publication types