. 2022 Jun 1;43(8):2419-2443.
doi: 10.1002/hbm.25773. Epub 2022 Mar 11.

A novel method for estimating connectivity-based parcellation of the human brain from diffusion MRI: Application to an aging cohort

Affiliations

A novel method for estimating connectivity-based parcellation of the human brain from diffusion MRI: Application to an aging cohort

Ana Coelho et al. Hum Brain Mapp. .

Abstract

Connectivity-based parcellation (CBP) methods are used to define homogenous and biologically meaningful parcels or nodes-the foundations of brain network fingerprinting-by grouping voxels with similar patterns of brain connectivity. However, we still lack a gold standard method and the use of CBPs to study the aging brain remains scarce. Our study proposes a novel CBP method from diffusion MRI data and shows its potential to produce a more accurate characterization of the longitudinal alterations in brain network topology occurring in aging. For this, we constructed whole-brain connectivity maps from diffusion MRI data of two datasets: an aging cohort evaluated at two timepoints (mean interval time: 52.8 ± 7.24 months) and a normative adult cohort-MGH-HCP. State-of-the-art clustering techniques were used to identify the best performing technique. Furthermore, we developed a new metric (connectivity homogeneity fingerprint [CHF]) to evaluate the success of the final CBP in improving regional/global structural connectivity homogeneity. Our results show that our method successfully generates highly homogeneous parcels, as described by the significantly larger CHF score of the resulting parcellation, when compared to the original. Additionally, we demonstrated that the developed parcellation provides a robust anatomical framework to assess longitudinal changes in the aging brain. Our results reveal that aging is characterized by a reorganization of the brain's structural network involving the decrease of intra-hemispheric, increase of inter-hemispheric connectivity, and topological rearrangement. Overall, this study proposes a new methodology to perform accurate and robust evaluations of CBP of the human brain.

Keywords: aging; brain parcellation; clustering; diffusion MRI; network neuroscience; structural connectivity.


Conflict of interest statement

The authors declare that they have no conflict of interests.

Figures
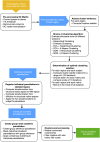
FIGURE 1
FIGURE 1
Overview of the workflow employed for the CBP method. Yellow boxes represent the initial input, blue boxes represent intermediate outputs, and green boxes the final output
FIGURE 2
FIGURE 2
Example of silhouette scores of one brain region for k‐means clustering in conjunction with SOM data dimensionality reduction technique. Different clustering solutions (2–6 clusters) were tested. The black dashed line represents the mean silhouette score across all data samples. This approach (SOM + k‐means clustering) presents the highest values of silhouette coefficient and with more balanced cluster sizes
FIGURE 3
FIGURE 3
Mean connectivity homogeneity fingerprint (CHF) scores for each group parcellation and for the 100 rotated parcellations, in the SWITCHBOX dataset. Red line represents CHF of each group parcellation (Silhouette, Davies–Bouldin, Calinski–Harabasz, and Elbow), blue line represents the average CHF of the 100 rotated parcellations, and gray dots represent CHF of each rotated parcellation. For all the four parcellations, the CHF is higher than for the mean of the rotated null parcellations
FIGURE 4
FIGURE 4
Mean connectivity homogeneity fingerprint (CHF) scores of the different group parcellations for all subjects. The four solutions resulted in parcellations with higher CHF in comparison to the original partition. Calinski–Harabasz parcellation had the highest homogeneity values but also the highest number of clusters
FIGURE 5
FIGURE 5
Mean connectivity homogeneity fingerprint (CHF) scores of the regions of the original partition and the individual clusters of the four group parcellations. Red line represents CHF of the original parcellation (DKT40) and blue dots represent CHF of each individual cluster of the group parcellations (Silhouette, Davies–Bouldin, Calinski–Harabasz, and Elbow). Individual clusters belonging to the same region of the original partition present the same value in the x‐axis. For all the group parcellations, the CHF of the individual clusters is higher than the CHF of the original region
FIGURE 6
FIGURE 6
Mean CHF values for the two timepoints and the initial parcellation. At both timepoints, the homogeneity is higher in comparison to the original partition
FIGURE 7
FIGURE 7
Significant changes in structural connectivity between timepoints. (a) Binarized version of the connected component of significantly altered structural connectivity. (b) Weighted version of (a), with edge thickness representing the amplitude of differences. Blue represents decreases in connectivity strength between timepoints and red represents increases. Connections with decreases are mostly intra‐hemispheric, while most of the increases are composed of intra‐hemispheric connections
FIGURE 8
FIGURE 8
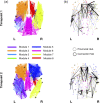
Modularity structure (a) and connector‐hub connectivity (b) at Timepoint 1 (top row) and Timepoint 2 (bottom row). Filled circles represent connector hubs and unfilled circles represent provincial hubs. The same number of modules was found at both timepoints but there were evident differences in modular arrangements (a) and in the undirected structural connectivity profile for the connector hubs (b). These differences are probably due to the higher number of connector hubs at the last timepoint. Giving the role of connector hubs in inter‐modular communication, the increase in their number between timepoints reflects an increase in integration of brain structural networks in aging
FIGURE 9
FIGURE 9
Hubs (global, provincial, and connector) identified in the two timepoints. Blue represents hubs only identified at Timepoint 1, green represents hubs only identified at Timepoint 2, and red represents hubs identified at both timepoints. We observe an increase in all type of hubs (global, provincial, and connector) between timepoints. Furthermore, some hubs change their role between timepoints (from provincial to connector—left precuneus 2, right precuneus 2, and right precentral 1; and from connector to provincial—left putamen 2 and right putamen 1)
FIGURE 10
FIGURE 10
Fingerprints of modular connectivity at Timepoint 1 (top row) and Timepoint 2 (bottom row). Left column represents the inter‐modular connectivity, middle column the intra‐module connectivity, and right column the connector‐hub driven inter‐modular connectivity. Modular connectivity strength is quantified as the total number of connections (degree) of all nodes forming a module. Community structure of Timepoint 2 was selected as the reference scheme, since it had higher group goodness‐of‐fit. We observe different patterns only in connector‐hub driven inter‐modular connectivity. Overall, there was an increase of around 33% in this connectivity between timepoints, which is probably due to the increase in the number of connector hub. This results again suggests an increase in integration of brain SC during aging

Similar articles

References

    1. Abivardi, A. , & Bach, D. R. (2017). Deconstructing white matter connectivity of human amygdala nuclei with thalamus and cortex subdivisions in vivo. Human Brain Mapping, 38(8), 3927–3940. 10.1002/hbm.23639 - DOI - PMC - PubMed
    1. Adolfsson, A. , Ackerman, M. , & Brownstein, N. C. (2019). To cluster, or not to cluster: An analysis of clusterability methods. Pattern Recognition, 88, 13–26. 10.1016/j.patcog.2018.10.026 - DOI
    1. Anwander, A. , Tittgemeyer, M. , von Cramon, D. Y. , Friederici, A. D. , & Knosche, T. R. (2007). Connectivity‐based parcellation of Broca's area. Cerebral Cortex, 17(4), 816–825. 10.1093/cercor/bhk034 - DOI - PubMed
    1. Arslan, S. , Ktena, S. I. , Makropoulos, A. , Robinson, E. C. , Rueckert, D. , & Parisot, S. (2018). Human brain mapping: A systematic comparison of parcellation methods for the human cerebral cortex. NeuroImage, 170, 5–30. 10.1016/j.neuroimage.2017.04.014 - DOI - PubMed
    1. Bach, D. R. , Behrens, T. E. , Garrido, L. , Weiskopf, N. , & Dolan, R. J. (2011). Deep and superficial amygdala nuclei projections revealed in vivo by probabilistic tractography. The Journal of Neuroscience, 31(2), 618–623. 10.1523/JNEUROSCI.2744-10.2011 - DOI - PMC - PubMed

Publication types