. 2022 May 1;33(5):ar41.
doi: 10.1091/mbc.E21-05-0275. Epub 2022 Mar 11.

DLC-1 facilitates germ granule assembly in Caenorhabditis elegans embryo

Affiliations

DLC-1 facilitates germ granule assembly in Caenorhabditis elegans embryo

Nicholas J Day et al. Mol Biol Cell. .

Abstract

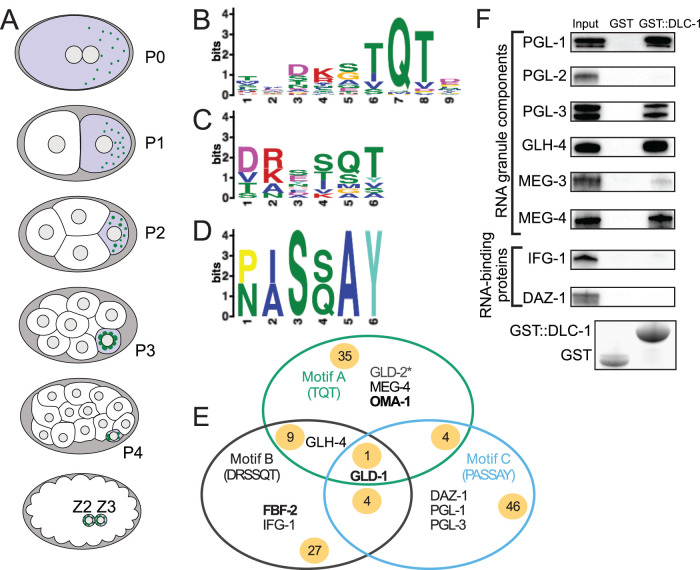
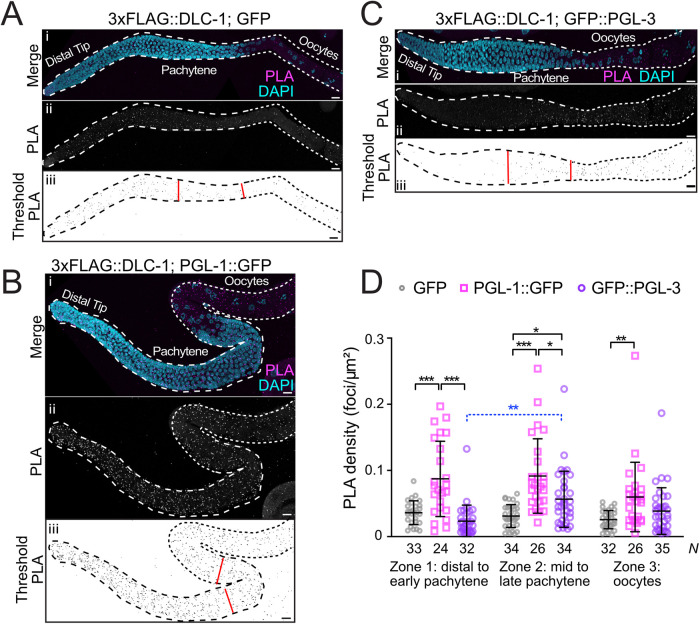
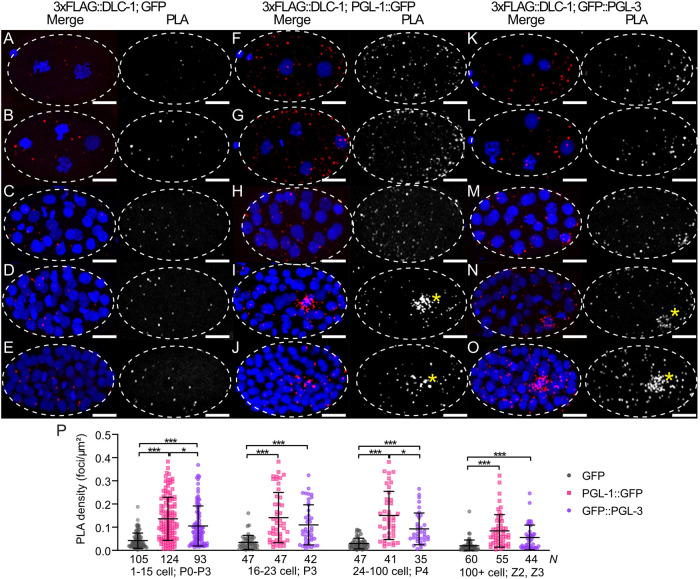
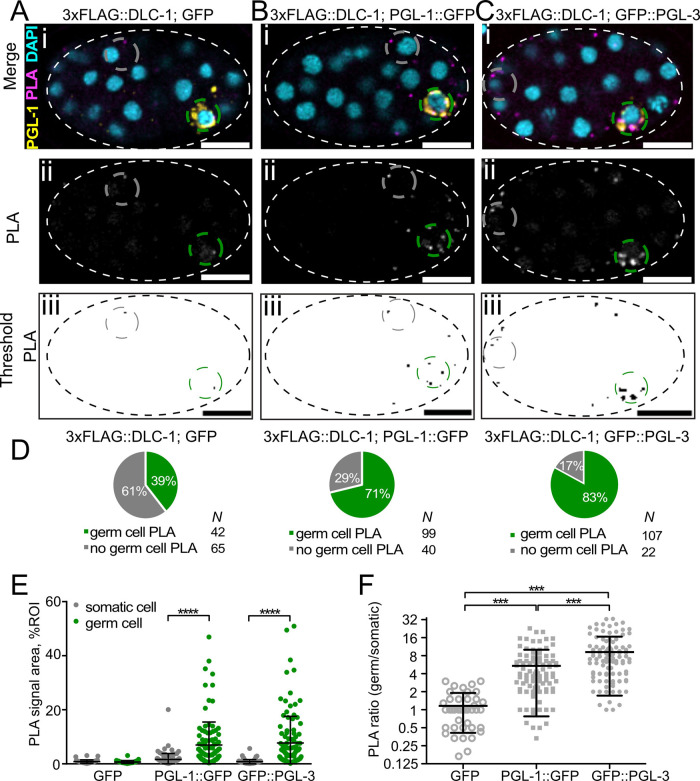
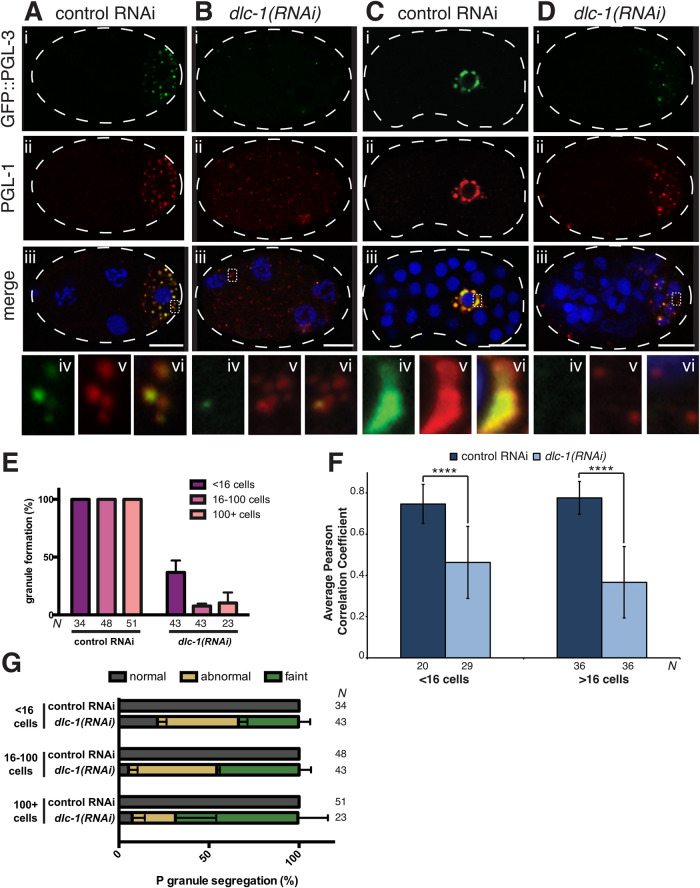
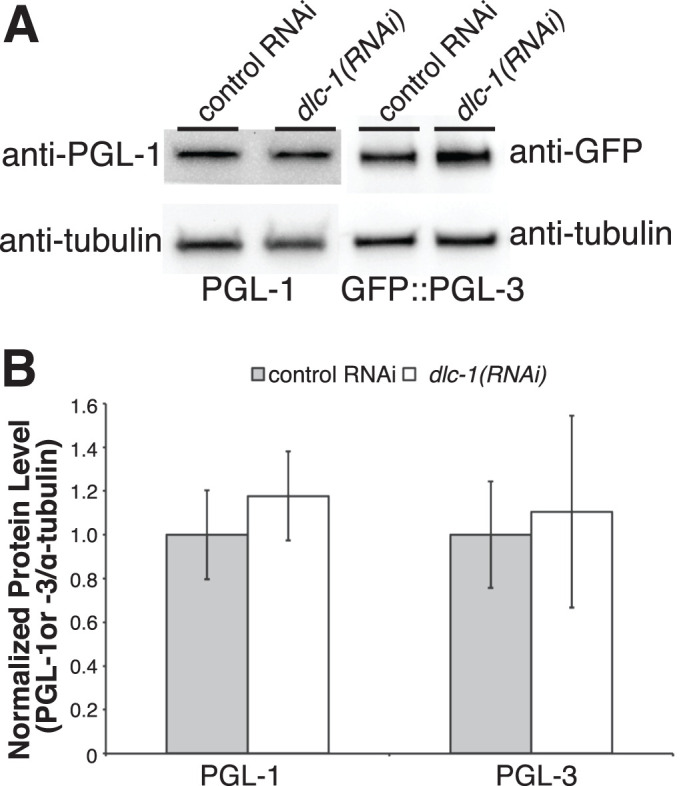
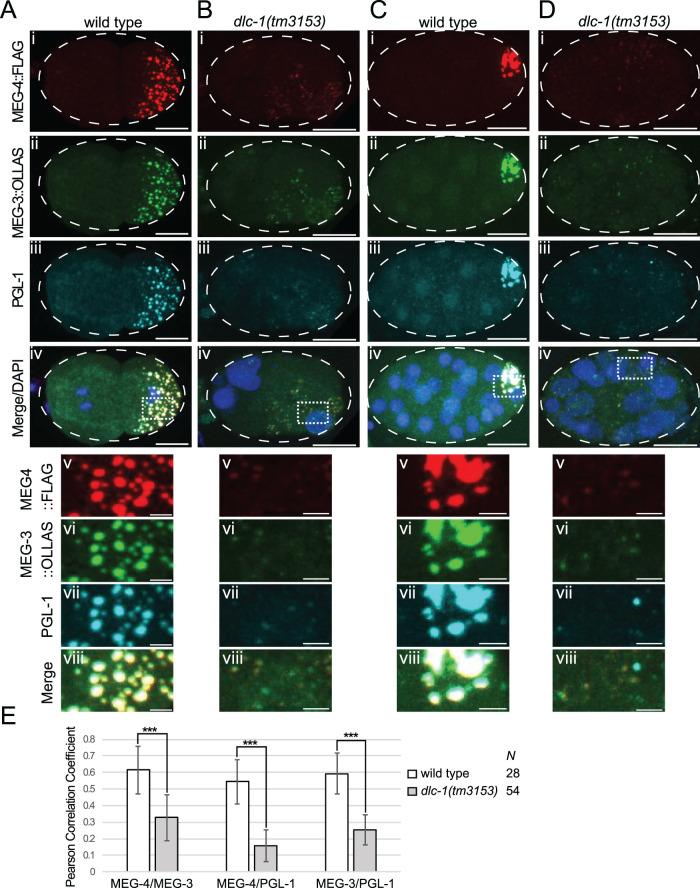
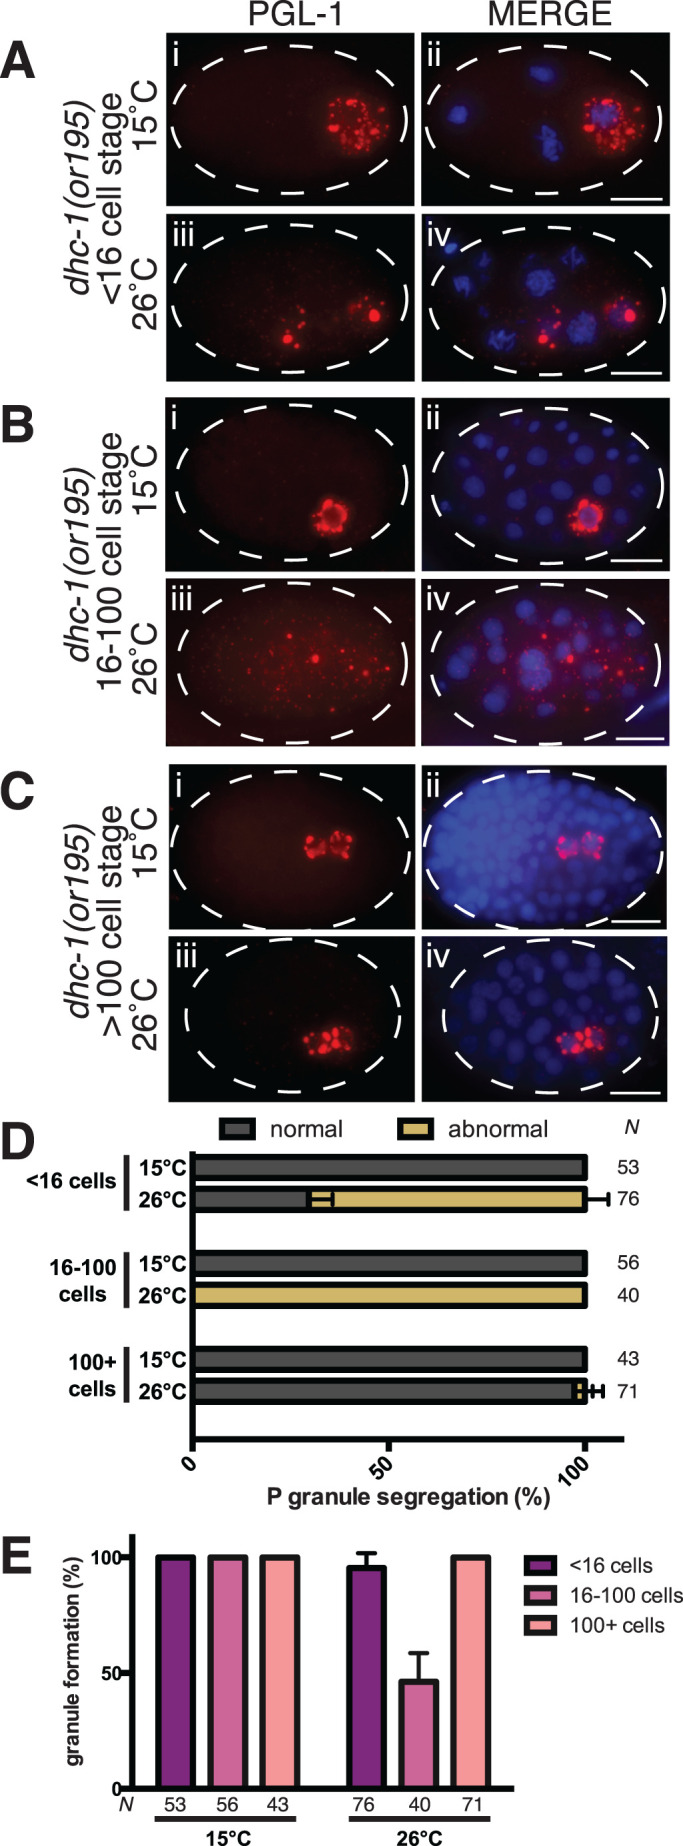
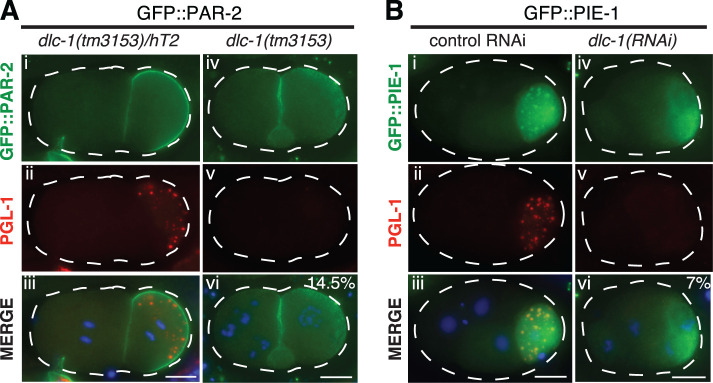
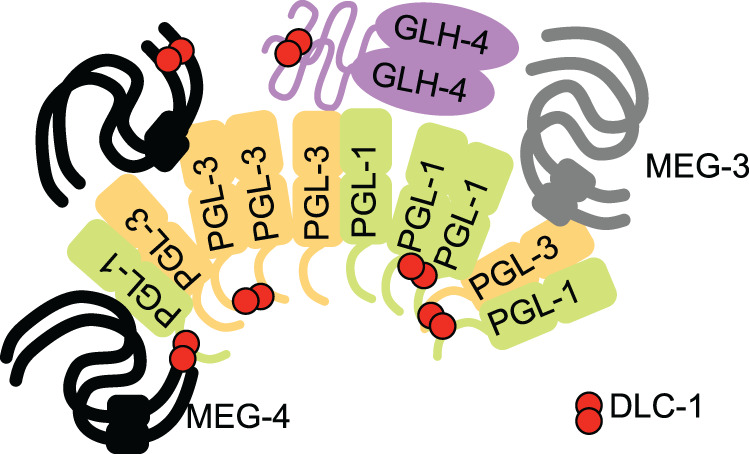
Germ granules are cytoplasmic assemblies of RNA-binding proteins (RBPs) required for germ cell development and fertility. During the first four cell divisions of the Caenorhabditis elegans zygote, regulated assembly of germ (P) granules leads to their selective segregation to the future germ cell. Here we investigate the role of DLC-1, a hub protein implicated in stabilization and function of diverse protein complexes, in maintaining P granule integrity. We find that DLC-1 directly interacts with several core P granule proteins, predominantly during embryogenesis. The loss of dlc-1 disrupts assembly of P granule components into phase-separated organelles in the embryos, regardless of whether or not DLC-1 directly interacts with these proteins. Finally, we infer that P granule dispersal in the absence of dlc-1 is likely independent of DLC-1's function as a subunit of the dynein motor and does not result from a loss of cell polarity.


Figures

FIGURE 1:
FIGURE 1:
Motif scans identify C. elegans DLC-1–interacting proteins. (A) Schematics of early C. elegans embryos from the one-cell stage to the ∼100-cell stage. Germ cells are highlighted in purple, and P granules are depicted as green puncta. (B) MEME analysis of published LC8-binding sites generates the canonical binding motif A (“TQT”) similar to the one reported previously (Rapali et al., 2011b). (C) MEME analysis of divergent LC8-binding sites including the sites from GLD-1 (Ellenbecker et al., 2019) and FBF-2 (Wang et al., 2016) generates an alternative motif B (“DRRSQT”). (D) MEME analysis of divergent LC8-binding sites including the site from GLD-1 and additional atypical LC8-binding sites from Rodríguez-Crespo et al. (2001) generates an alternative motif C (“PASSAY”). (E) Scanning the C. elegans proteome with motifs A–C returns 126 proteins previously identified as RBPs (Tamburino et al., 2013; Matia-González et al., 2015). The green, black, and blue circles represent the results from each respective motif scan. Examples of RBPs found exclusively by each motif scan are listed in each circle. Examples of RBPs found by more than one scan are shown in regions where circles overlap. The numbers on yellow background indicate how many RBPs were identified in each specific group or overlap between groups. The RBPs listed have been tested for interaction with DLC-1 in this report or previously. Bold text indicates RBPs previously found to interact with DLC-1, while an asterisk indicates no interaction with DLC-1 in a previous study. (F) GST pull downs confirm several interactions between GST::DLC-1 and RBPs identified by the proteome scan. All RBPs tested were 6xHis tagged with the exception of MEG-3, MEG-4, and DAZ-1, which were MBP tagged. RBP constructs were detected by Western blotting with anti-6xHis or anti-MBP antibodies, and GST alone or GST::DLC-1 was detected by stain-free chemistry. PGL-2 and MEG-3 were included for comparison against their paralogues PGL-1, PGL-3, and MEG-4, which were recovered with the motif scan.
FIGURE 2:
FIGURE 2:
Proximity ligation detects formation of DLC-1/PGL complexes in the adult germline. (A–C) Extruded adult germlines of 3xFLAG::DLC-1; GFP (A), 3xFLAG::DLC-1; PGL-1::GFP (B), and 3xFLAG::DLC-1; GFP::PGL-3 (C) with PLA in magenta and DNA labeled with DAPI (4′,6-diamidino-2-phenylindole; cyan). The individual PLA channels (Aii, Bii, Cii) are also shown in grayscale for better contrast. For quantification, the PLA foci in the grayscale PLA channels were subjected to the particle thresholding procedure (Aiii, Biii, Ciii). Red lines separate the three zones used for quantitative analysis in D. In each image, the stem cells and meiotic pachytene are outlined with dashed lines, while the oocytes are outlined with dotted lines. Images were acquired with a confocal microscope. Scale bars are 10 µm. (D) The PLA density (number of PLA foci per μm2) was measured for germlines of each genetic background segmented into three zones (see Materials and Methods) as denoted by the red lines (Aiii, Biii, Ciii). Average and SD are indicated for each column. The number of germlines analyzed (N) for each strain in each zone is shown below the graph. Differences in PLA density for each protein pair and each zone were evaluated by one-way analysis of variance (ANOVA) followed by Sidak’s multiple comparison test. The sole significant cross-zone difference in PLA density is shown with a blue dashed bracket. Asterisks denote statistical significance (***, < 0.001; **, < 0.01; *, < 0.05). Data are representative of three biological replicates.
FIGURE 3:
FIGURE 3:
DLC-1 forms complexes with PGL-1 and PGL-3 in early embryos. (A–O) PLA (red) in 3xFLAG::DLC-1; GFP (A–E), 3xFLAG::DLC-1; PGL-1::GFP (F-J), and 3xFLAG::DLC-1; GFP::PGL-3 (K–O) embryos. Rows 1 (A, F, and K) and 2 (B, G, and L): two- and four-cell-stage embryos, where cytoplasmic P granules segregate into the germ cell P1 or P2. Row 3 (C, H, and M): 16–23-cell embryos, where P granules transition to the perinuclear location in the late P3 germ cell. Row 4 (D, I, and N): 24–100-cell embryos, where P granules are located at the nucleus of the P4 germ cell. Row 5 (E, J, and O): embryos at ∼100-cell stage, where autophagy clears PGL proteins from somatic cells, with P granules remaining in Z2 and Z3 primordial germ cells. DNA is labeled with DAPI (blue in the merged images). The PLA channels are also shown in grayscale for better contrast. Images were acquired using a confocal microscope. Yellow asterisks in I, J, N, and O indicate PLA foci enriched in germ cells. Embryos in this and the following figures are oriented with anterior to the left. Scale bars = 10 µm. (P) PLA density (PLA foci per μm2) was measured within each whole embryo coexpressing 3xFLAG::DLC-1 with either of GFP (negative control), PGL-1::GFP, or GFP::PGL-3. The values were subsequently binned into groups based on developmental stage of the embryo (as indicated along the X-axis). Average and SD are indicated for each column. N values for each strain and developmental stage are shown under each column. Differences in PLA density for each protein pair were evaluated by one-way ANOVA followed by Sidak’s multiple comparison test. Asterisks denote statistical significance (***, < 0.001; *, < 0.05). Data are representative of four biological replicates.
FIGURE 4:
FIGURE 4:
DLC-1/PGL complexes are enriched in P4 and Z2/Z3 germ cells. (A–C) PLA foci (magenta) in 3xFLAG::DLC-1; GFP (A), 3xFLAG::DLC-1; PGL-1::GFP (B), and 3xFLAG::DLC-1; GFP::PGL-3 (C) single confocal planes of embryos at approximately the 40-cell stage. DNA is labeled with DAPI (cyan). P granules (yellow) are immunostained by anti–PGL-1. The PLA channels are also shown in grayscale (Aii, Bii, Cii) for better contrast. For quantification, the PLA foci in the grayscale PLA channels of each embryo image were subject to particle thresholding (Aiii, Biii, Ciii). The green dashed circle delineates the germ cell ROI, while the gray dashed circle delineates the somatic cell. Scale bars = 10 µm. (D–F) Quantitative analysis of PLA. The PLA signal in test and control strains was evaluated by three different metrics using the same embryo images for all analyses. PGL-1::GFP data were collected across five biological replicates, GFP::PGL-3 data in four biological replicates, and GFP data in three biological replicates. (D) DLC-1/PGL complexes are present in germ cells. Pie charts represent proportions of embryos that had PLA foci present in germ cells. The number of observations (N) for each group is shown next to each pie chart legend. (E) The relative area occupied by the PLA signal of DLC-1/PGL complexes is greater in the germ cells than in the somatic cells. The relative PLA area in somatic and germ cells (gray and green circles) is plotted for embryos of each strain. The embryos with no signal in the germ cells were excluded from this data set. Average and SD are shown for each column. Differences in relative PLA areas were evaluated by one-way ANOVA followed by comparisons of somatic vs. germ cells for each strain with Sidak’s multiple comparison test (****, < 0.0001). (F) The germ cell enrichment of DLC-1/PGL-3 complex is greater than that of the DLC-1/PGL-1 complex. The ratios of relative PLA areas in germ cell over somatic cell of the same embryo are plotted for each strain (the Y-axis is log-scale). Average and SD are indicated for each column. Differences in germ/somatic cell PLA area ratio for each target protein were evaluated by one-way ANOVA followed by Tukey multiple comparison test. Asterisks denote statistical significance (***, < 0.001).
FIGURE 5:
FIGURE 5:
dlc-1 is required for PGL-1 and PGL-3 assembly into embryonic P granules. (A–D) P granule components PGL-1 (red) and GFP::PGL-3 (green) detected by immunostaining of control or dlc-1(RNAi) embryos. (A, B) Four-cell embryos. (C, D) Forty-cell embryos. DNA is labeled with DAPI (blue). Panels iv–vi are zoomed-in regions (dotted outlines) of panel iii to highlight differences in P granule assembly and size between control RNAi and dlc-1(RNAi)–treated embryos. Images were acquired using a confocal microscope. Scale bars in i–iii are 10 µm. (E) P granules are disrupted in a large fraction of dlc-1(RNAi) embryos. Plotted are the average percents of embryos with distinct cytoplasmic PGL-1 foci following control or dlc-1(RNAi). Error bars represent the SD, and the number of embryos observed (N) for each condition is indicated below each bar. Data were collected in three biological replicates. (F) Pearson’s correlation analysis quantifying colocalization between PGL-1 and GFP::PGL-3 in wild-type and dlc-1(RNAi) embryos. Plotted values are means ± SD. The difference between the control and dlc-1(RNAi) was significant in both early and later-stage embryos. The P values were determined using a two-tailed/equal variance t test where **** = < 0.0001. The number of embryos observed (N) in each RNAi experiment is noted under each bar. Data were collected in three biological replicates. (G) Defects in P granule segregation are frequently observed in dlc-1(RNAi) embryos. P granule segregation was classified as normal for each developmental stage (gray) or abnormal with P granules found in somatic cells (dark olive). A fraction of dlc-1(RNAi) embryos had very diffuse PGL-1 signal, where it was hard to ascertain the fidelity of segregation into specific cells (faint, light olive color). Plotted values are means ± SD. The number of embryos observed (N) in each RNAi condition is indicated next to each bar. The same embryos were scored to generate panels E and G.
FIGURE 6:
FIGURE 6:
dlc-1(RNAi) does not affect the levels of PGL-1 and PGL-3 in embryos. (A) Western blot of embryo lysates following control or dlc-1(RNAi). PGL-1 and GFP::PGL-3 abundance does not decrease following dlc-1(RNAi). Tubulin is used as a loading control. (B) Average PGL-1 and GFP::PGL-3 protein levels normalized to tubulin over three biological replicates. Error bars represent the SD from the mean. No significant differences were observed between the control and dlc-1(RNAi) (PGL-1: > 0.3; PGL-3: > 0.7), calculated by Student’s unpaired t test.
FIGURE 7:
FIGURE 7:
dlc-1 is required for embryonic P granule integrity. (A–D) Maximum-intensity projections of wild-type or dlc-1 mutant embryos coimmunostained for P granule components MEG-4::3xFLAG (red), MEG-3::OLLAS (green), and PGL-1 (cyan), respectively. DNA was labeled with DAPI (blue in the merged images). (A, B) Two- to four-cell-stage embryos. (C, D) Twenty-three- to twenty-four-cell-stage embryos. Rows v–viii are zoomed-in regions (dotted outlines in panel iv) split into single channels for clarity. Images were acquired using a confocal microscope. Scale bars: 10 µm (i–iv); 2 µm (v–viii). (E) Average colocalization coefficients (Pearson correlation based on Costes’ automatic threshold) for each indicated pair of P granule proteins in wild-type and dlc-1 mutant embryos. For each pair of P granule proteins examined, the difference between the wild type and mutant was significantly different. The P values were determined using a two-tailed, equal variance t test, *** = < 0.0005. Error bars represent SD from the mean. The numbers of wild-type or dlc-1 mutant embryos observed (N) are denoted in the bar plot legend. The data were collected over three biological replicates.
FIGURE 8:
FIGURE 8:
P granule integrity is likely independent of dynein motor function. (A–C) PGL-1 (red) detected by immunostaining of dhc-1(or195) embryos at the permissive (15°C, subpanels i and ii) or restrictive (26°C, subpanels iii and iv) temperature. (A) Four-cell embryos. (B) Approximately 40–cell embryos. (C) Approximately 100-cell embryos. DNA is labeled with DAPI (blue). Images were acquired using an epifluorescence microscope. Scale bars: 10 µm. (D) Inactivation of dynein motor causes defects in P granule segregation in the early embryos. P granule segregation was classified as normal for each developmental stage (gray) or abnormal where P granules were localized to somatic cells (tan). The number of embryos scored (N) in each experiment is indicated next to each bar. Data were collected in three biological replicates. (E) Perinuclear P granules are disrupted in 16- to 100-cell embryos upon inactivation of dynein motor. Plotted are the average percent of embryos with PGL-1 granules of a normal size following incubation at either permissive (15°C) or restrictive (26°C) temperature. Error bars represent the SD, and the number of embryos observed (N) in each experiment is below each bar. The same embryos were scored to generate panels D and E.
FIGURE 9:
FIGURE 9:
Normal polarity in two- to four-cell embryos with dispersed P granules. GFP fusion proteins (green) and PGL-1 (red) detected by immunostaining in two- to four-cell embryos. (A) GFP::PAR-2 transgene in the progeny of dlc-1 heterozygous (i–iii) or homozygous mutant (iv–vi) mothers. (B) GFP::PIE-1 transgene in the progeny of hermaphrodites treated with control (i–iii) or dlc-1(RNAi) (iv–vi). DNA is labeled with DAPI (blue). Percent of scored embryos with severely dispersed P granules is shown in merge subpanels (vi). Early embryos were scored in three biological replicates, and N = 48 (GFP::PAR-2) and 55 (GFP::PIE-1). Images were acquired using an epifluorescence microscope. Scale bars: 10 µm.
FIGURE 10:
FIGURE 10:
Model of DLC-1 contribution to P granule assembly in C. elegans embryo. P granules assemble through multivalent interactions of their constituent proteins. Structured domains are pictured as ovals or rectangles, and presumed disordered proteins or domains are indicated with lines. PGL-1 and PGL-3 form homo/heterodimers and likely oligomeric assemblies. Both PGLs and MEGs interact with RNAs, which is omitted for clarity. We speculate that binding of DLC-1 dimer (red) provides additional multivalent contacts that stabilize protein complexes and might additionally facilitate conformational changes promoting assembly of P granule components in the embryo.

Similar articles

Cited by

References

    1. Amiri A, Keiper BD, Kawasaki I, Fan Y, Kohara Y, Rhoads RE, Strome S (2001). An isoform of eIF4E is a component of germ granules and is required for spermatogenesis in C. elegans. Development 128, 3899–3912. - PMC - PubMed
    1. Aoki ST, Lynch TR, Crittenden SL, Bingman CA, Wickens M, Kimble J (2021). C. elegans germ granules require both assembly and localized regulators for mRNA repression. Nat Commun 12, 996. - PMC - PubMed
    1. Aoki ST, Porter DF, Prasad A, Wickens M, Bingman CA, Kimble J (2018). An RNA-binding multimer specifies nematode sperm fate. Cell Rep 23, 3769–3775. - PMC - PubMed
    1. Bagchi S, Fredriksson R, Wallén-Mackenzie Å (2015). In situ proximity ligation assay (PLA). Methods Mol Biol 1318, 149–159. - PubMed
    1. Bailey TL (2011). Dreme: motif discovery in transcription factor chip-seq data. Bioinformatics 27, 1653–1659. - PMC - PubMed

Publication types

MeSH terms