. 2022 May 1;33(5):ar40.
doi: 10.1091/mbc.E21-06-0334. Epub 2022 Mar 11.

Septins guide noncentrosomal microtubules to promote focal adhesion disassembly in migrating cells

Affiliations

Septins guide noncentrosomal microtubules to promote focal adhesion disassembly in migrating cells

Daniel Merenich et al. Mol Biol Cell. .

Abstract

Endothelial cell migration is critical for vascular angiogenesis and is compromised to facilitate tumor metastasis. The migratory process requires the coordinated assembly and disassembly of focal adhesions (FA), actin, and microtubules (MT). MT dynamics at FAs deliver vesicular cargoes and enhance actomyosin contractility to promote FA turnover and facilitate cell advance. Noncentrosomal (NC) MTs regulate FA dynamics and are sufficient to drive cell polarity, but how NC MTs target FAs to control FA turnover is not understood. Here, we show that Rac1 induces the assembly of FA-proximal septin filaments that promote NC MT growth into FAs and inhibit mitotic centromere-associated kinesin (MCAK)-associated MT disassembly, thereby maintaining intact MT plus ends proximal to FAs. Septin-associated MT rescue is coupled with accumulation of Aurora-A kinase and cytoplasmic linker-associated protein (CLASP) localization to the MT between septin and FAs. In this way, NC MTs are strategically positioned to undergo MCAK- and CLASP-regulated bouts of assembly and disassembly into FAs, thereby regulating FA turnover and cell migration.


Figures
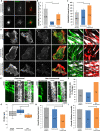
FIGURE 1:
FIGURE 1:
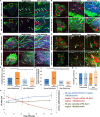
NC MTs polymerize into FAs and reduce FA size. (A) HUVEC expressing mApple-Golgi and GFP-CAMSAP2 showing CAMSAP2 localization in conditions of centrosomal (top row) or NC (bottom row) MTs. (B, C) Quantification of CAMSAP2 stretch length (B) and count (C). (D) HUVECs expressing mCherry-F-Tractin and GFP-EB3 and white paxillin in control (all MTs; top row), centrosomal MT (middle row), and NC MT (bottom row) cells. Yellow boxes in overlay images indicate the zoom regions shown to the right. Zoom regions show MT organization (yellow arrows in green EB max-intensity projections) relative to FAs (white) and actin organization (red) relative to the same FAs (far right panels). (E) Representative kymographs of GFP-EB3 and FA dynamics (paxillin; white) in cells with centrosomal MTs (left) or NC MTs (right; related to Supplemental Video 1 and 2). (F) Quantification of the percent change in EB growth into FAs. (G–I) Comparison of FA size (G), MT growth speed (H), and MT growth lifetime (I) in HUVECs with control, centrosomal, or NC MTs. Error bars show ±SD in B and C and ±SE in H and I. Scale bars = 10 µm, whole cell view; 1 µm, zoomed view. Student’s t test; p (*) < 0.05.
FIGURE 2:
FIGURE 2:
Septin directs NC MTs to FAs and regulates FA dynamics. (A) HUVEC expressing GFP-EB3 and white FAs (paxillin). Zoomed region (yellow box) showing max-intensity time-lapse images of MTs polymerizing into FAs. White arrows indicate the plus ends of different MTs that polymerize into FAs. (B) HUVEC expressing GFP-EB3 (green), mCherry-Septin 7 (red), and paxillin (white). The assembling MT (yellow arrow) grows toward Septin 7, colocalizes with Septin 7 (yellow asterisk), and changes trajectory while continuing to polymerize into a FA (yellow circle; related to Supplemental Video 3). (C) Quantification of phenomenon described in B. (D) Septin 7 KD verification of Septin 7 Isoform 5 compared with a nontargeting control. Densitometry an average of three replicates. (E) Quantification of MT colocalization with Septin 7 (top), Septin 7-associated MT growth into FAs (middle), and MT growth into FAs, comparing centrosomal and NC MTs. (F, G) Measurement of MT growth speed (F) or MT growth lifetime (G) comparing centrosomal and NC MTs that colocalized with Septin 7, those that did not colocalize with Septin 7, and MTs with septin KD. (H) Comparison of FA size between control and Septin KD conditions. (I–J) Focal adhesion analysis of assembly and disassembly between centrosomal and NC (I) and control and Septin KD cells (H). Error bars show ±SE in C and ±SD in D, F, and G. Scale bars = 10 µm, whole cell view; 1 µm, zoomed view. Student’s t test; p (*) < 0.05.
FIGURE 3:
FIGURE 3:
CLASP regulates septin-associated MT dynamics to control FA size. (A) HUVEC expressing GFP-CLASP1 and fluorescently labeled paxillin (white) showing examples of 1) FA-associated, 2) lattice-associated, or 3) polymerizing CLASP in the same cell. Yellow boxes shows zoom regions with yellow arrows showing examples of CLASP localization. (B) Whole-cell view with white box indicating the region of the kymograph. Representative kymographs of GFP-CLASP1, mCherry-Septin 7, paxillin (white), and overlay in NC cells showing CLASP growth from Septin 7 (yellow asterisk) to paxillin and CLASP-FA dynamics (red arrow). (C) Whole-cell view with white box indicating the region of kymograph. Representative kymograph of GFP-CLASP1, mCherry-Septin 7, and EB3 (white), and overlay in NC cells showing CLASP and MT dynamics. Red arrow shows depolymerization to Septin 7 with yellow asterisk showing regrowth away from Septin 7. (D, E) Comparison of FA size in endogenous, CLASP expressing, GSK3β, LL5β KD, and CLASP expression with Septin 7 KD between centrosomal (D) and NC (E) cells. (F) HUVEC expressing GFP-CLASP1, mCherry-EB1N, and unlabeled EB1C and zoom (yellow boxes) showing dissociation of CLASP from the growing MT plus end. White arrows indicate the loss of GFP-CLASP1 after dissociation of unlabeled EB1C. (G) Paxillin-labeled FAs (white) and zoom (yellow boxes) showing a visual increase in FA size following CLASP dissociation from MT plus ends (white arrows). (H) Quantification of FA size after dissociation compared with no dissociation. Error bars show ±SE in H. Scale bars = 20 µm for kymograph whole cell view; 10 µm, whole-cell view; 1 µm zoomed view. Student’s t test; p (*) < 0.05.
FIGURE 4:
FIGURE 4:
MCAK and Aurora-A control the dynamics of septin-associated MTs to drive FA disassembly. (A) HUVEC expressing GFP-MCAK in conditions of centrosomal (top row) or NC (bottom row) MTs. (B) Whole-cell view with white box indicating region of kymograph. Representative kymograph of GFP-MCAK, mCherry-Septin 7, and paxillin (white) showing MT dynamics between Septin 7 and a FA. Growth events labeled with yellow asterisk. (C) Analysis of MCAK-labeled NC MT average time of growth from Septin 7 to FAs, time between growth excursions into FAs, and time spent at FAs. (D) Measurement of average GFP-MCAK puncta per MT in the presence or absence of mCherry-Septin 2/6/7 in vitro. (E, F) Still images of in vitro HiLyte-647-GMPCPP–stabilized MTs with purified GFP-MCAK in the absence (E) or presence (F) of mCherry-Septin 2/6/7 complex. White boxes represent the MTs used in G; related to Supplemental Videos 4 and 5). (G) Representative kymographs showing in vitro depolymerization assays with HiLyte-647-GMPCPP–stabilized MTs with purified GFP-MCAK without (top) and with (bottom) mCherry-SEPT2/6/7 complex. (H) Quantification of MCAK-mediated depolymerization rates for conditions described in E–G. (I) Time-lapse images showing in vitro depolymerization assays with HiLyte-647-GMPCPP–stabilized MTs with purified GFP-MCAK and increasing concentrations of mCherry-SEPT2/6/7. (J) Analysis of MT length measurements from experiments in I. (K, L) Representative kymographs of either wild-type Aurora-A kinase (white; K) or a kinase-dead Aurora-A mutant (white; L) with mCherry-Septin 7 and GFP-MCAK showing that the wild-type Aurora-A kinase accumulates and drives rescue of MCAK-labeled MTs at the distal edge of peripheral Septin 7 (yellow asterisk and yellow arrow; K). (M, N) Comparison of FA size between endogenous control cells and cells expressing either MCAK, Aurora-A kinase, the kinase-dead Aurora-A mutant with centrosomal (M) or NC (N) MTs. Error bars show ±SE in C, F, G, and I. Scale bars = 10 µm, whole-cell view; 1 µm, zoomed view. Student’s t test; p (*) < 0.05; p (***) < 0.001, p (****) < 0.0001.
FIGURE 5:
FIGURE 5:
CLASP and MCAK cooperate to control septin-associated NC MT dynamics to regulate FA size. (A, B) Representative kymographs showing behaviors of MCAK and CLASP dynamics relative to peripheral mCherry-Septin 7 with CLASP accumulation (A) or in the absence of CLASP accumulation (B). Whole-cell images to the left show the region of the kymograph (white box). Yellow asterisks indicate copolymerization of MCAK and CLASP adjacent to septin, and red arrows indicate MCAK disassembly back to Septin 7. (C) Representative kymograph showing behaviors of MCAK and CLASP dynamics relative to FAs (mApple-paxillin). Yellow asterisks indicate copolymerization of MCAK and CLASP that terminates within the FA (blue arrows). Whole-cell image to the left shows the region of the kymograph (white box). (D) Comparison of MT growth from Septin 7 between MTs that have CLASP only, MCAK only, or CLASP and MCAK labeling coming from Septin 7 (percent). (E, F) Still images from a time-lapse experiment showing HUVECs expressing GFP-CLASP1, mCherry-Septin 7, and paxillin (white) with Aurora-A kinase (E) or kinase-dead Aurora-A mutant (F) showing CLASP localization (yellow arrows) relative to Septin 7 (red). (G) HUVECs expressing GFP-MCAK, mCherry-Septin 7, and paxillin (white) with GSK3β or (H) LL5β KD showing MCAK localization (yellow arrows) relative to Septin 7 (red). (I, J) Comparison of FA size between endogenous control cells and cells expressing either LL5β KD with MCAK, GSK3β with MCAK, Aurora-A kinase with CLASP, or the kinase-dead Aurora-A mutant with CLASP expression in cells with centrosomal (I) or NC (J) MTs. Scale bars = 20 µm, whole-cell view for kymographs; 10 µm, whole-cell view; 1 µm, zoomed view. Student’s t test; p (*) < 0.05.
FIGURE 6:
FIGURE 6:
Rac1 promotes septin filament assembly proximal to peripheral FAs. (A) HUVECs expressing mCherry-Septin 7 and dominant negative Rac1 (DN-Rac1; top row), endogenous Rac1 (middle row), or constitutively active Rac1 (CA-Rac1; bottom row). Zoom regions (yellow boxes) show peripheral Septin 7 localization (white arrows in overlay zoom). (B) Quantification of peripheral Septin 7 in conditions shown in A. (C) HUVEC expressing GFP-paxillin and mCherry-Septin 7 with unlabeled-PA (photoactivatable) Rac1. (Top row) Time-lapse images showing a region of Rac1 photoactivation (yellow circle) at t = 0 min. Zoom region (white box) showing the assembly of mCherry-Septin 7 filaments proximal to peripheral FAs at t = 10 min (white circles). (Bottom row) Time-lapse images showing a region of Rac1 photoactivation (yellow circle) at t = 25 min. Zoom region (white boxes) showing assembly of Septin-7 filaments proximal to peripheral FAs at t = 40 min (white circles) within a second localized region of the same cell (related to Supplemental Video 6). (D) Time-lapse images showing FA disassembly following Rac1 photoactivation (yellow circles). Red arrows indicate the same FAs before and after Rac1 photoactivation. (E) Quantification of peripheral Septin 7 (red) and FA size (blue) within regions of Rac1 photoactivation and compared with FA size outside of regions of Rac1 photoactivation (green). Error bars show ±SD. Scale bars = 10 µm, whole-cell view; 1 µm, zoomed view. Student’s t test; p (*) < 0.05.
FIGURE 7:
FIGURE 7:
Septin effects on NC MT growth into FAs are dependent upon acto-myosin contractility. (A) HUVEC expressing GFP-F-Tractin, mCherry-Septin 7, and BFP-EB3 showing the effects on Septin 7 localization following the addition of (A) latrunculin (to disassemble actin filaments); (B) nocodazole to disassemble MTs; (C, D) blebbistatin to inhibit myosin-II contractility and actin organization (C) or FA organization (D) EB (green), Septin 7 (red) and FAs (paxillin; white). Yellow box indicates zoomed region. White arrows in A, B, and C track peripheral Septin 7 before and after treatment. Yellow arrows in D show growth of Septin 7 colocalized MTs into a FA before treatment and loss of growth into FAs after treatment. (E) Peripheral Septin 7 count before and after myosin-II inhibition in cells under conditions of centrosomal or NC MTs. (F) Analysis of MT growth into FAs after Septin 7 colocalization before and after myosin-II inhibition between centrosomal and NC MTs. (G) Quantification of FA size after myosin-II inhibition in cells under conditions of centrosomal (left) or NC (right) MTs. (H) Quantification of peripheral Septin 7 count (red) and FA size (blue) within the region of Rac1 photoactivation and compared with FA size outside of regions of Rac1 photoactivation (green) following myosin-II inhibition with blebbistatin. Error bars show ±SD. Scale bars = 10 µm, whole-cell view; 1 µm, zoomed view. Student’s t test; p (*) < 0.05.
FIGURE 8:
FIGURE 8:
Septin-mediated guidance of NC MTs promotes polarized EC migration. (A) Time-lapse images of HUVEC wound edge migration of control (all MTs: top row), centrosomal MTs (second row), NC MTs (third row), NC MTs with GSK3β (fourth row), NC MTs with Aurora-A kinase (fifth row), and NC MTs with Septin KD (bottom row). (B) Quantification of wound closure speed for the conditions shown in A with CLASP KD. (C) Still-frame images from a time-lapse wound edge migration experiment showing a HUVEC expressing GFP-paxillin (FAs) and mCherry Septin 7. Yellow boxes in left panel correspond to zoomed still-frame time-lapse images to the right. Yellow arrows highlight Septin 7 assembly proximal to FAs during cell migration (related to Supplemental Video 7). (D, E) Schematic diagram showing a proposed mechanism by which peripheral septins guide NC MT polymerization into FAs to promote FA disassembly and zoom (D; red box in C) of dynamic interplay between MCAK and CLASP on the MT plus tip proposed to drive FA turnover. Error bars show ±SE. Scale bars = 500 µm for wound edge; 10 µm for whole-cell max intensity; 1 µm for zoomed-in view. Student’s t test; p (*) < 0.05.

Similar articles

Cited by

References

    1. Aher A, Kok M, Sharma A, Rai A, Olieric N, Rodriguez-Garcia R, Katrukha EA, Weinert T, Olieric V, Kapitein LC, et al. (2018). CLASP suppresses microtubule catastrophes through a single TOG domain. Dev Cell 46, 40–58.e48. - PMC - PubMed
    1. Akhmanova A, Hoogengraad CC (2015). Microtubule minus-end-targeting proteins. Curr Biol 25, R162–R171. - PubMed
    1. Akhmanova A, Steinmetz MO (2010). Microtubule +TIPs at a glance. J Cell Sci 123, 3415–3419. - PubMed
    1. Aoki K, Nakamura T, Matsuda M (2004). Spatio-temporal regulation of Rac1 and Cdc42 activity during nerve growth factor-induced neurite outgrowth in PC12 cells. J Biol Chem 279, 713–719. - PubMed
    1. Applegate KT, Besson S, Matov A, Bagonis MH, Jaqaman K, Danuser G (2011). plusTipTracker: quantitative image analysis software for the measurement of microtubule dynamics. J Struct Biol 176, 168–184. - PMC - PubMed

Publication types

MeSH terms