. 2022 Apr 21;42(4):e0050521.
doi: 10.1128/mcb.00505-21. Epub 2022 Mar 11.

An Evolutionarily Conserved AU-Rich Element in the 3' Untranslated Region of a Transcript Misannotated as a Long Noncoding RNA Regulates RNA Stability

Affiliations

An Evolutionarily Conserved AU-Rich Element in the 3' Untranslated Region of a Transcript Misannotated as a Long Noncoding RNA Regulates RNA Stability

Emily A Dangelmaier et al. Mol Cell Biol. .

Abstract

One of the primary mechanisms of post-transcriptional gene regulation is the modulation of RNA stability. We recently discovered that LINC00675, a transcript annotated as a long noncoding RNA (lncRNA), is transcriptionally regulated by FOXA1 and encodes a highly conserved small protein that localizes to the endoplasmic reticulum, hence renamed as FORCP (FOXA1-regulated conserved small protein). Here, we show that the endogenous FORCP transcript is rapidly degraded and rendered unstable as a result of 3'UTR-mediated degradation. Surprisingly, although the FORCP transcript is a canonical nonsense-mediated decay (NMD) and microRNA (miRNA) target, we found that it is not degraded by NMD or miRNAs. Targeted deletion of an evolutionarily conserved region in the FORCP 3'UTR using CRISPR/Cas9 significantly increased the stability of the FORCP transcript. Interestingly, this region requires the presence of an immediate downstream 55-nt-long sequence for transcript stability regulation. Functionally, colorectal cancer cells lacking this conserved region expressed from the endogenous FORCP locus displayed decreased proliferation and clonogenicity. These data demonstrate that the FORCP transcript is destabilized via conserved elements within its 3'UTR and emphasize the need to interrogate the function of a given 3'UTR in its native context.

Keywords: 3’UTR; ARE; AU-rich; CRISPR/Cas9; FORCP; FOXA1; LINC00675; NMD; RNA stability; TMEM238L; conserved; lincRNA; lncRNA; mRNA decay; mRNA stability; miRNA; micropeptide; misannotated.


Conflict of interest statement

The authors declare no conflict of interest.

Figures

FIG 1
FIG 1
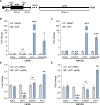
FORCP encodes a rapidly degraded RNA transcript. (A–D) RNA stability assays were performed for endogenous FORCP mRNA by measuring its levels by RT-qPCR after ActD treatment for the indicated time points in SW1222 (A), LS180 (B) and LS174T (C) cells or for exogenous FORCP mRNA overexpressed in HCT116 (D) cells. (E) LS180 cells were treated with DRB for 0, 1, 3, and 4 h and FORCP mRNA levels were measured by RT-qPCR. The half-life of FORCP is indicated as t1/2 (A–E). In these experiments (A–E), MALAT1 served as a stable RNA control and MYC as an unstable RNA control. GAPDH was used as a loading control. The graphs show the average of two biological replicates (N = 2). (F) Nascent FORCP RNA was measured after pulse-labeling with 5-ethynyl uridine (EU). LS180 cells were incubated with EU-containing media and harvested at time point 0 h or incubated with non-EU-containing media for 4 h before harvest and RNA extraction. EU-labeled RNA was isolated and FORCP mRNA levels were measured by RT-qPCR. MYC was used as unstable RNA control. Error bars in panels 1A-1E are from two biological replicates; panel 1F was from three independent experiments. *P < 0.05, **P < 0.01.
FIG 2
FIG 2
The NMD pathway does not regulate FORCP mRNA levels. (A) Diagram showing the features of FORCP mRNA indicating the nucleotide lengths of the ORF and 3’UTR. The 5’UTR, the intronic sequences, the upstream start codon (uAUG), and the translation start and stop codons are indicated. (B–C) RT-qPCR assays were performed for the indicated mRNAs upon 4 h of CHX treatment of LS180 (B) and SW1222 (C) cells. DMSO was used as vehicle control. (D–E) RT-qPCR assays were performed for the indicated mRNAs upon UPF1 knockdown in LS180 (D) and SW1222 (E) cells. SDHA served as a negative control. ATF3 and GADD45B are known NMD targets. GAPDH served as a loading control. Error bars in panels 2B-2E are from three independent experiments. *P < 0.05, **P < 0.01, ***P < 0.001.
FIG 3
FIG 3
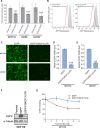
The 3’UTR of FORCP mRNA represses reporter expression. (A) Luciferase assays showing percent normalized luciferase activity of a construct containing the FORCP 3’UTR compared to empty vector from HCT116, LS180 and LS174T cells. (B) Flow cytometry analysis showing GFP fluorescence of HCT116 (left) or LS174T (right) cells stably expressing an EGFP transgene in the presence or absence of the FORCP 3’UTR. (C) Microscopy images of HCT116 (upper panel) and LS174T (lower panel) for the data shown in panel B. (D-E) RT-qPCR assays were performed from HCT116 (D) and LS174T (E) cells expressing EGFP or EGFP-FORCP-3’UTR mRNAs. GAPDH was used as a loading control. (F) Western blotting was performed from parental HCT116 cells or HCT116 expressing EGFP or EGFP-FORCP-3’UTR mRNAs. α-Tubulin was used as loading control. (G) RNA stability assays were performed after 0, 2, 4, and 6 h of ActD treatment of HCT116 cells expressing EGFP or EGFP-FORCP-3’UTR mRNAs. GAPDH was used as a loading control (N = 2). Error bars in panels 3A and 3D are from three independent experiments; panel 3G is from two biological replicates. **P < 0.01, ***P < 0.001.
FIG 4
FIG 4
The microRNA pathway does not regulate FORCP expression. RT-qPCR was performed for the indicated mRNAs upon DICER1 knockdown in SW1222 (A) and LS180 (C) cells. SDHA serves as a negative control. (B) The relative levels of miR-200a were also measured upon DICER1 siRNA treatment to confirm DICER1 knockdown. U6 was used for loading control. (D) Western blotting was performed from whole-cell lysates showing DICER1 knockdown at the protein level in LS180 and SW1222 cells. α-Tubulin was used for the loading control. (E-F) Luciferase assays were performed from parental and in isogenic DICER1 knockout 293T cells (E) or upon DICER1 knockdown in 293T cells using siRNAs (F). FORCP 3’UTR was cloned downstream of the luciferase gene but showed no effect by DICER1 knockout (E) or knockdown (F) (N = 2). An EGFP construct containing bulged miR-19 sites was used as a positive control in DICER1 KO cells. GAPDH served as a loading control for all the RT-qPCR assays. Error bars in panels 4A-4C and 4E-4F are from three independent experiments. **P < 0.01, ***P < 0.001.
FIG 5
FIG 5
The FORCP 3’UTR harbors an evolutionarily conserved AU-rich element that regulates FORCP mRNA stability. (A) Upper panel: Alignment of the 56 nt long sequence of the conserved region on FORCP 3’UTR between human (NR_036581.1) and mouse (NR_130645.1) genes using BLASTN. Bottom panel: Diagram showing the location of the conserved region (red box) and the target sites of the sgRNAs used for CRISPR are highlighted (top). The middle diagram depicts the 119-nt-long deleted region (orange box) upon CRISPR. The location of primers (blue bars) used in RT-qPCR experiments for detecting Total FORCP (middle-left), FORCP WT allele (middle-right), and FORCP upon deletion (bottom) of the conserved region are indicated. (B) Luciferase assays were performed from HCT116 cells transfected with psiCHECK-2 empty vector or psiCHECK-2 containing the human or mouse FORCP 3’UTR. (C) CRISPR/Cas9 technology was used to delete the conserved region on the 3’UTR of FORCP in LS174T cells. The panel shows the sequence of the WT FORCP gene and the sequence upon deletion (DEL-3 and DEL-4). A 6 bp deletion is observed on the other allele (DEL-1 and DEL-2). (D) RNA stability assays were performed 0, 1, 2, and 4 h after ActD treatment of FORCP heterozygous LS174T cells expressing FORCP WT from one allele and FORCT DEL from the other allele. The half-life of the transcripts is indicated as t1/2. GAPDH was used as a loading control. (E) RT-qPCR assays were performed to determine the relative levels of the indicated transcripts in LS174T after using sgRNAs to delete the conserved region in the 3’UTR of FORCP compared to WT cells. GAPDH was used as a loading control. Error bars in panels 5B, 5D and 5E are from three independent experiments. *P < 0.05, **P < 0.01, ***P < 0.001.
FIG 6
FIG 6
Deletion of the evolutionary conserved region in the FORCP 3’UTR does not alter translation of FORCP mRNA. (A) Luciferase assays showing normalized luciferase activity of a construct containing FORCP WT, FORCP DEL, a construct with the conserved region deleted (DEL-conserved) and a construct with the downstream 55 nt-long region deleted (DEL-55 nt) compared to the empty vector in LS180 cells. The right panel shows diagrams of the deletions made within each construct in colored boxes. (B) Representative polysome profile from cytoplasmic lysates from LS174T FORCP DEL cells fractionated through a sucrose gradient. Peaks corresponding to the 40S and 60S, small and large ribosomal subunits, respectively, are indicated, as well as peaks corresponding to 80S monosomes and polysomes. (C-D) Percentage fraction distribution of FORCP WT and FORCP DEL transcripts (C) and GAPDH and ACTB (D) from lysates fractionated as in panel B. Error bars in panels 6A, 6C and 6D are from three independent experiments. ***P < 0.001.
FIG 7
FIG 7
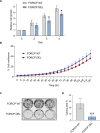
Deletion of the evolutionary conserved region in the FORCP 3’UTR region results in growth defects. (A) Cell growth assays showing the relative growth of LS174T expressing either FORCP WT or FORCP DEL. The cells were plated and counted for the days indicated. (B) Incucyte data analysis showing the cell confluence of LS174T expressing FORCP WT or FORCP DEL over time as indicated. (C-D) In vitro colony formation assays showing reduced clonogenicity of LS174T expressing FORCP DEL compared to FORCP WT (C). The graph (panel D) shows the percentage (%) area of the wells covered by the colonies. Error bars in panels 7A, 7B and 7D are from three independent experiments. *P < 0.05, ***P < 0.001.

Similar articles

Cited by

References

    1. Corbett AH. 2018. Post-transcriptional regulation of gene expression and human disease. Curr Opin Cell Biol 52:96–104. 10.1016/j.ceb.2018.02.011. - DOI - PMC - PubMed
    1. Audic Y, Hartley RS. 2004. Post-transcriptional regulation in cancer. Biol Cell 96:479–498. 10.1016/j.biolcel.2004.05.002. - DOI - PubMed
    1. Garcia-Cardenas JM, Guerrero S, Lopez-Cortes A, Armendariz-Castillo I, Guevara-Ramirez P, Perez-Villa A, Yumiceba V, Zambrano AK, Leone PE, Paz YMC. 2019. Post-transcriptional regulation of colorectal cancer: a focus on RNA-binding proteins. Front Mol Biosci 6:65. 10.3389/fmolb.2019.00065. - DOI - PMC - PubMed
    1. Jewer M, Findlay SD, Postovit LM. 2012. Post-transcriptional regulation in cancer progression: microenvironmental control of alternative splicing and translation. J Cell Commun Signal 6:233–248. 10.1007/s12079-012-0179-x. - DOI - PMC - PubMed
    1. Keene JD, Tenenbaum SA. 2002. Eukaryotic mRNPs may represent posttranscriptional operons. Mol Cell 9:1161–1167. 10.1016/s1097-2765(02)00559-2. - DOI - PubMed

Publication types

MeSH terms

Substances