Observational Study
. 2022 Mar 11:11:e74681.
doi: 10.7554/eLife.74681.

Innate lymphoid cells and COVID-19 severity in SARS-CoV-2 infection

Collaborators, Affiliations
Observational Study

Innate lymphoid cells and COVID-19 severity in SARS-CoV-2 infection

Noah J Silverstein et al. Elife. .

Abstract

Background: Risk of severe COVID-19 increases with age, is greater in males, and is associated with lymphopenia, but not with higher burden of SARS-CoV-2. It is unknown whether effects of age and sex on abundance of specific lymphoid subsets explain these correlations.

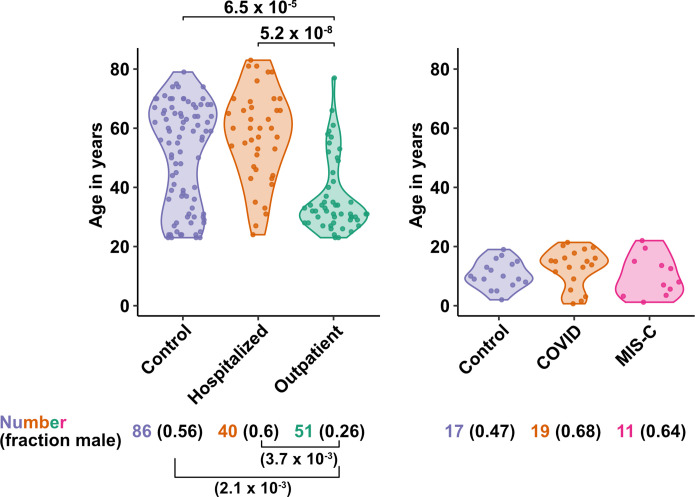
Methods: Multiple regression was used to determine the relationship between abundance of specific blood lymphoid cell types, age, sex, requirement for hospitalization, duration of hospitalization, and elevation of blood markers of systemic inflammation, in adults hospitalized for severe COVID-19 (n = 40), treated for COVID-19 as outpatients (n = 51), and in uninfected controls (n = 86), as well as in children with COVID-19 (n = 19), recovering from COVID-19 (n = 14), MIS-C (n = 11), recovering from MIS-C (n = 7), and pediatric controls (n = 17).

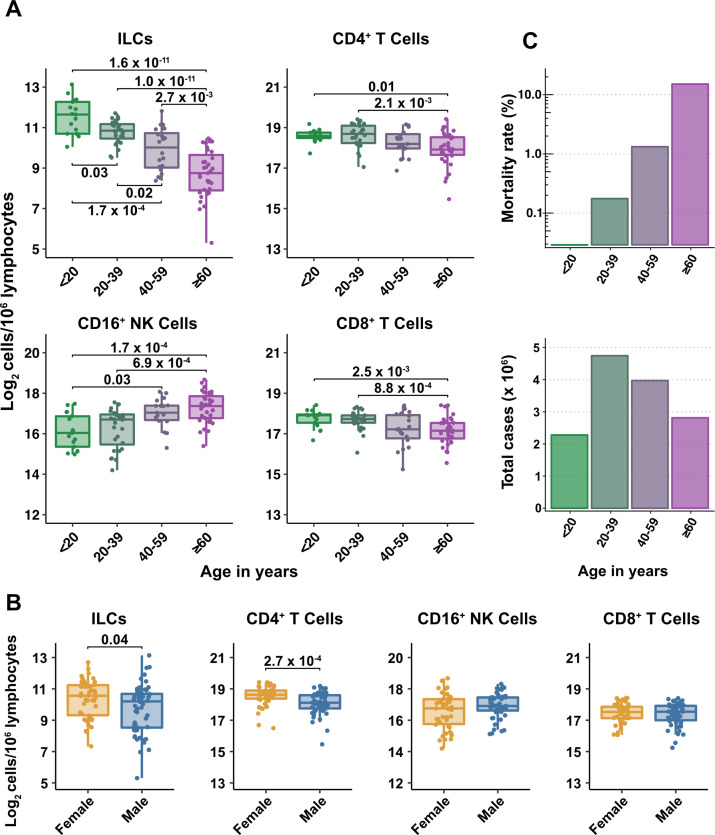
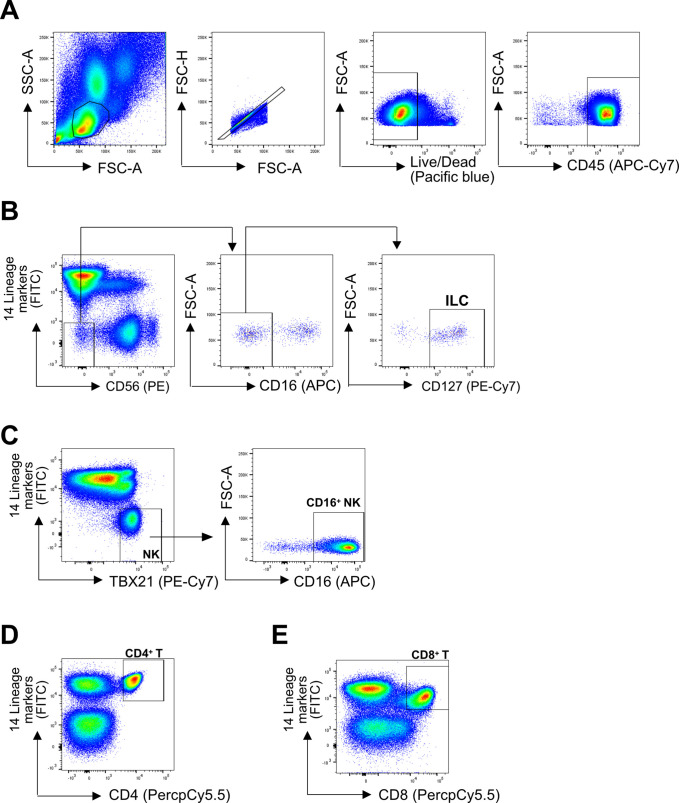
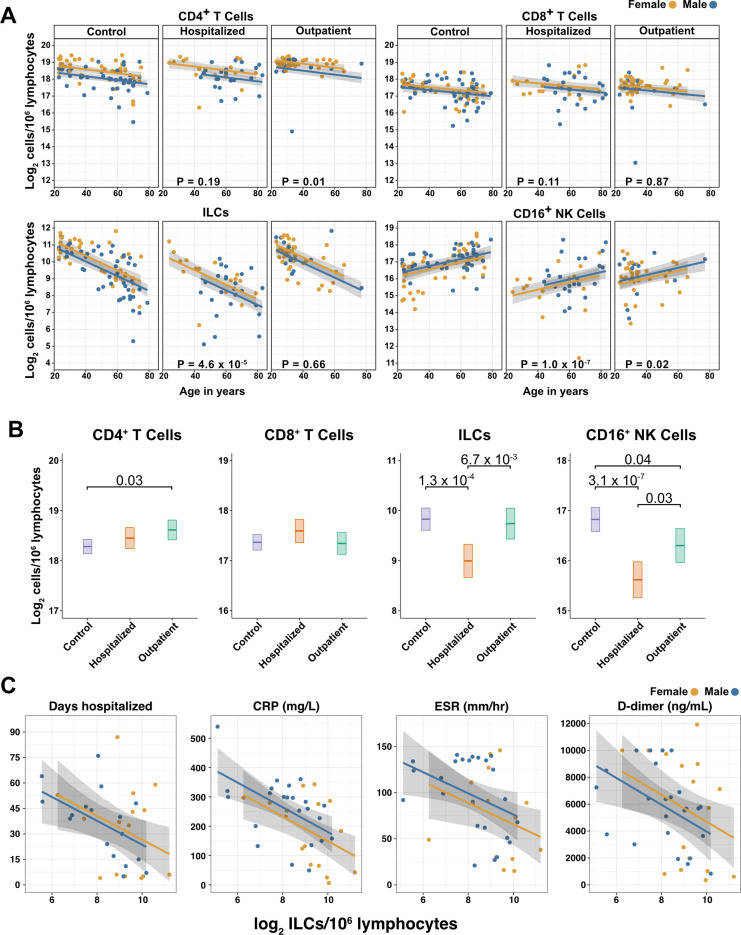
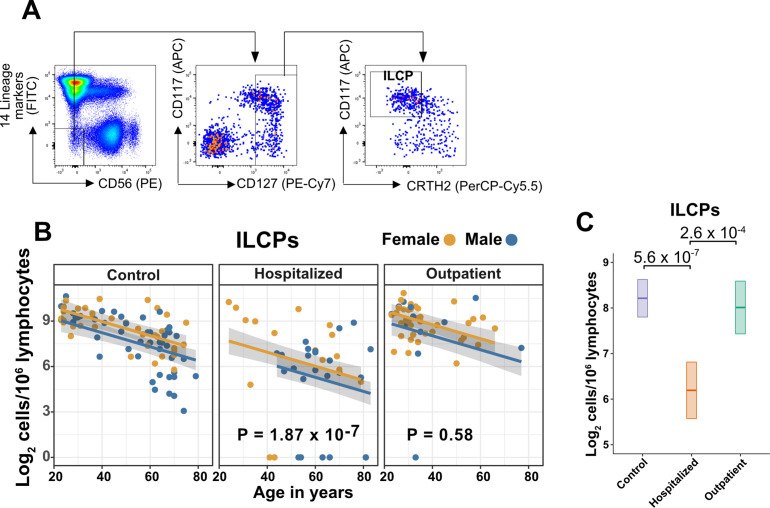
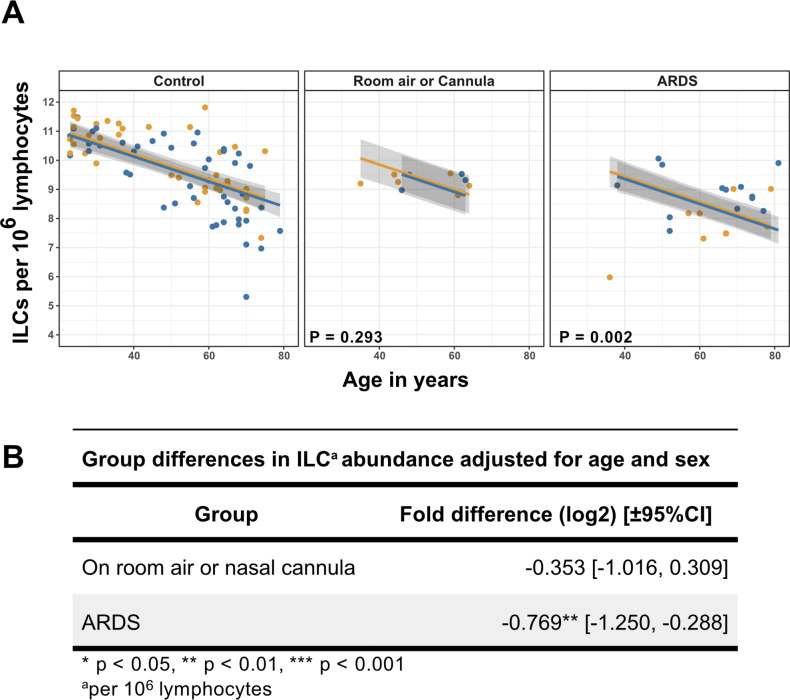
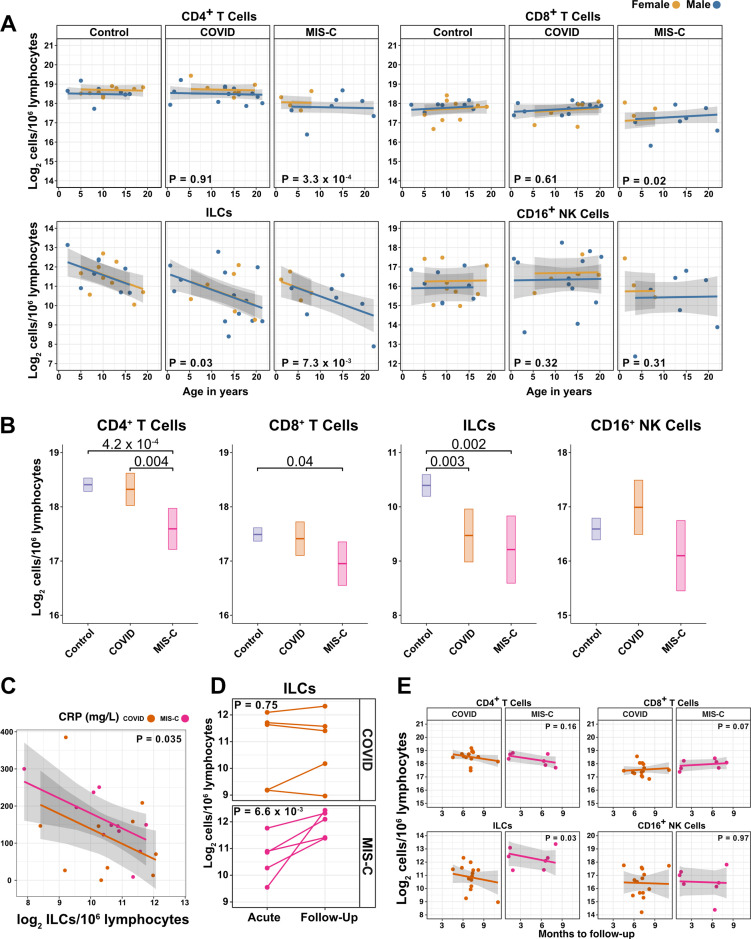
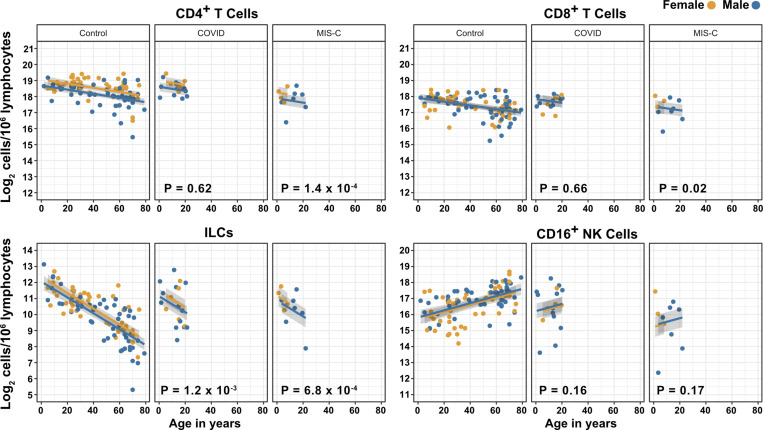
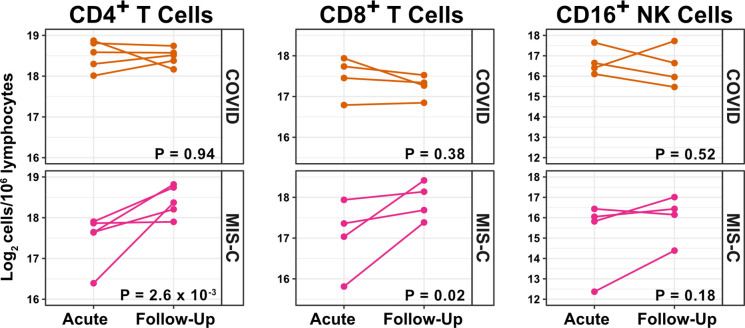
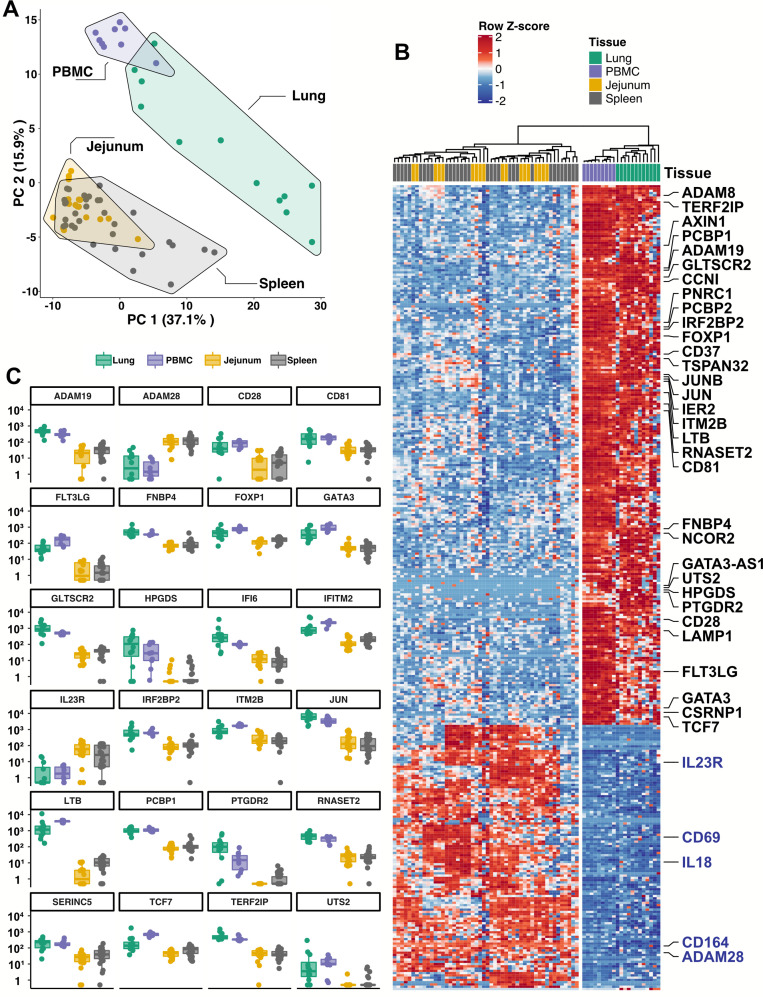
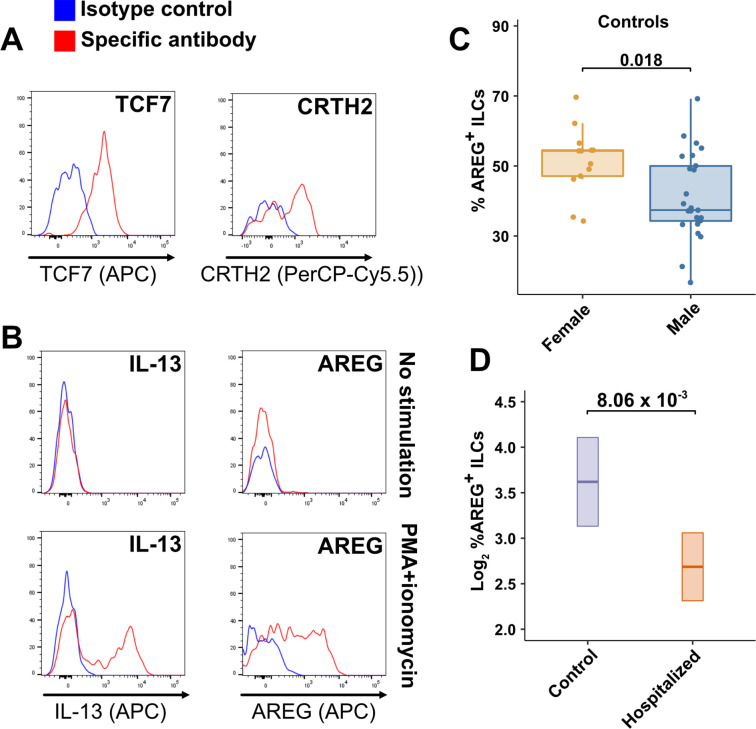
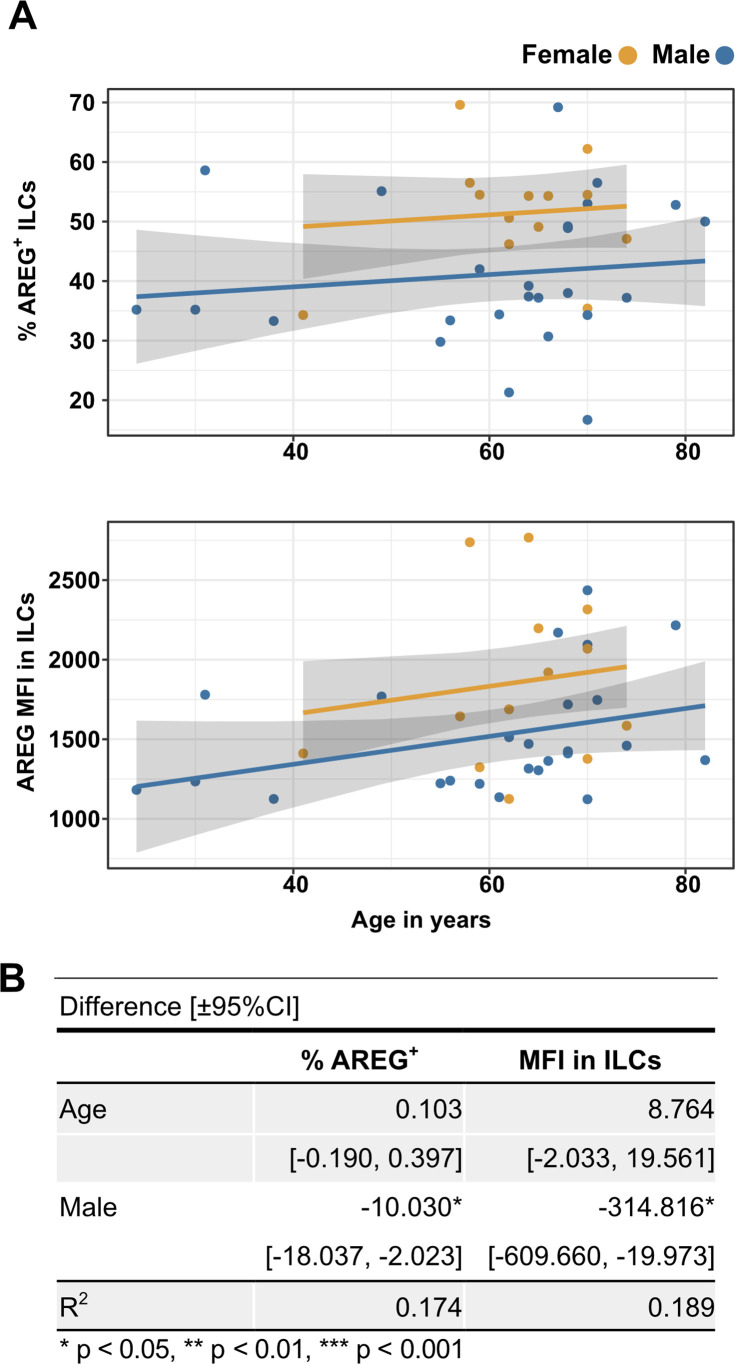
Results: This observational study found that the abundance of innate lymphoid cells (ILCs) decreases more than 7-fold over the human lifespan - T cell subsets decrease less than 2-fold - and is lower in males than in females. After accounting for effects of age and sex, ILCs, but not T cells, were lower in adults hospitalized with COVID-19, independent of lymphopenia. Among SARS-CoV-2-infected adults, the abundance of ILCs, but not of T cells, correlated inversely with odds and duration of hospitalization, and with severity of inflammation. ILCs were also uniquely decreased in pediatric COVID-19 and the numbers of these cells did not recover during follow-up. In contrast, children with MIS-C had depletion of both ILCs and T cells, and both cell types increased during follow-up. In both pediatric COVID-19 and MIS-C, ILC abundance correlated inversely with inflammation. Blood ILC mRNA and phenotype tracked closely with ILCs from lung. Importantly, blood ILCs produced amphiregulin, a protein implicated in disease tolerance and tissue homeostasis. Among controls, the percentage of ILCs that produced amphiregulin was higher in females than in males, and people hospitalized with COVID-19 had a lower percentage of ILCs that produced amphiregulin than did controls.

Conclusions: These results suggest that, by promoting disease tolerance, homeostatic ILCs decrease morbidity and mortality associated with SARS-CoV-2 infection, and that lower ILC abundance contributes to increased COVID-19 severity with age and in males.

Funding: This work was supported in part by the Massachusetts Consortium for Pathogen Readiness and NIH grants R37AI147868, R01AI148784, F30HD100110, 5K08HL143183.

Keywords: COVID-19; MIS-C; SARS-CoV-2; amphiregulin; disease tolerance; human; immunology; inflammation; innate lymphoid cells; medicine.


Conflict of interest statement

NS, YW, ZM, CC, AD, BB, ML, JD, ML, LK, NM, MB, JL, BW, XY, LY, JL No competing interests declared

Figures

Figure 1.
Figure 1.. Age and sex of control and SARS-CoV-2-infected blood donors.
Age of the subjects is shown, along with the number of subjects and fraction male in each group, for adult (left) and pediatric (right) cohorts, as indicated. The p-values are from pairwise, two-sided, Wilcoxon rank-sum test for ages and Fisher’s exact test for fraction male, with Bonferroni correction for multiple comparisons. Adjusted p-values < 0.05 are shown.
Figure 2.
Figure 2.. Blood ILC abundance decreases exponentially across the lifespan mirroring the mortality rate from SARS-CoV-2 infection.
(A–B) Log2 abundance per million lymphocytes of the indicated lymphoid cell populations in combined pediatric and adult control data plotted by 20 year bin or by sex, as indicated. Each dot represents an individual blood donor. Boxplots represent the distribution of the data with the center line drawn through the median with the upper and lower bounds of the box at the 75th and 25th percentiles respectively. The upper and lower whiskers extend to the largest or smallest values within 1.5 x the interquartile range (IQR). The p-values are from two-sided, Wilcoxon rank-sum tests with Bonferroni correction for multiple comparisons. Adjusted p-values < 0.05 are shown. (C) Case numbers and mortality rate within the indicated age ranges for cases reported in the United States between Jan 1, 2020, and June 6, 2021.
Figure 2—figure supplement 1.
Figure 2—figure supplement 1.. Representative gating strategy.
(A) All cell subsets were first gated on lymphoid cells, singlets, live/dead, and CD45+. Lineage (Lin) markers included antibodies against: CD3, CD4, TCRαβ, TCRγδ, CD19, CD20, CD22, CD34, FcεRIα, CD11c, CD303, CD123, CD1a, and CD14. (B) ILCs were identified as Lin-CD56-CD16-CD127+ (C) CD16+ NK cells were identified as Lin-TBX21+CD16+ (E) CD4+ T cells were identified as Lin+CD4+ (D), and CD8+ T cells were identified as Lin+CD8+.
Figure 3.
Figure 3.. Innate lymphoid cells are depleted in adults hospitalized with COVID-19 and ILC abundance correlates inversely with disease severity.
(A) Effect of age (X-axis) on log2 abundance per million total lymphocytes of the indicated lymphoid cell populations (Y-axis), as determined by the regression analysis in Table 2. Each dot represents an individual blood donor, with yellow for female and blue for male. Shading represents the 95% CI. The p-values are from the regression analysis for comparisons to the control group. (B) Log2 abundance per million lymphocytes of the indicated lymphoid cell populations, shown as estimated marginal means with 95% CI, generated from the multiple linear regressions in Table 2, and averaged across age and sex. The p-values represent pairwise comparisons on the estimated marginal means, adjusted for multiple comparisons with the Tukey method. Adjusted p-values < 0.05 are shown. (C) Association of the indicated clinical parameters with log2 abundance of ILCs per million lymphoid cells. Regression lines are from simplified multiple regression models to permit visualization on a two-dimensional plane. Shading represents the 95% CI. Results of the full models accounting for effects of both age and sex, are reported in Table 4 and the text.
Figure 3—figure supplement 1.
Figure 3—figure supplement 1.. Innate lymphoid cell precursors (ILCPs) decrease with age and are depleted in patients hospitalized with COVID-19.
(A) Representative gating for ILCP identification in PBMCs. Cells were first gated on lymphoid cells, singlets, live/dead, and CD45+. Lineage (Lin) markers included antibodies against: CD3, CD4, TCRαβ, TCRγδ, CD19, CD20, CD22, CD34, FcεRIα, CD11c, CD303, CD123, CD1a, and CD14. (B) Effect of age (X-axis) on log2 ILCP abundance per million total lymphocytes (Y-axis). Each dot represents an individual blood donor, with yellow for female and blue for male. Shading represents the 95% CI. The p-values are from the regression analysis for comparisons to the control group. (C) Lymphoid cell abundance by group, shown as estimated marginal means with 95% CI, generated from the multiple linear regressions in (B), and averaged across age and sex. The p-values represent pairwise comparisons on the estimated marginal means, adjusted for multiple comparisons with the Tukey method.
Figure 3—figure supplement 2.
Figure 3—figure supplement 2.. Association of blood ILC depletion with COVID-19 severity in an independent cohort of adults.
(A) Effect of age (X-axis) on log2 ILC abundance per million total lymphocytes (Y-axis) in adult controls from this paper and patients with COVID-19 from Kuri-Cervantes et al., 2020. Patients were stratified into two groups by disease severity. The first group included patients maintained on room air or treated with O2 by nasal cannula. The second group included those with ARDS. Each dot represents an individual blood donor, with yellow for female and blue for male. Shading represents the 95% CI. The p-values are from the regression analysis for comparisons to the control group. (B) Table of regression coefficients for log2 fold difference in ILC abundance for patients with COVID-19, in comparison to the adult healthy control cohort, adjusted for effects of age and sex.
Figure 4.
Figure 4.. ILCs are depleted in children with COVID-19 or MIS-C.
(A) Effect of age (X-axis) on log2 abundance per million lymphocytes of the indicated lymphoid cell populations (Y-axis), as determined by the regression analysis in Table 5. Each dot represents an individual blood donor, with yellow for female and blue for male. Shading represents the 95% CI. The p-values are from the regression analysis for comparisons to the control group. (B) Log2 abundance per million lymphocytes of the indicated lymphoid cell populations, shown as estimated marginal means with 95% CI, generated from the multiple linear regressions in Supplementary file 2g that included the combined pediatric and adult control data, and averaged across age and sex. The p-values represent pairwise comparisons on the estimated marginal means, adjusted for multiple comparisons with the Tukey method. Adjusted p-values < 0.05 are shown. (C) Association of CRP with log2 abundance of ILCs per million lymphocytes. Shading represents the 95% CI. Each dot represents a single blood donor, orange for COVID-19, magenta for MIS-C. The p-value is for the effect of ILC abundance on CRP as determined by linear regression. (D) Log2 ILC abundance per million lymphocytes in longitudinal pairs of samples collected during acute presentation and during follow-up, from individual children with COVID-19 or MIS-C. Each pair of dots connected by a line represents an individual blood donor. The p-values are for change in ILC abundance at follow-up, as determined with a linear mixed model, adjusting for age, sex, and group, and with patient as a random effect. (E) Effect of time to follow-up (X-axis) on log2 abundance per million lymphocytes of the indicated lymphoid cell populations (Y-axis). The p-values are for the difference between the COVID-19 and MIS-C follow-up groups, independent of time to follow-up as determined by multiple linear regression. Shading represents the 95% CI.
Figure 4—figure supplement 1.
Figure 4—figure supplement 1.. Effects of pediatric COVID-19 and MIS-C on blood lymphoid cell subsets in comparison to full combined adult and pediatric control group.
Effect of age (X-axis) on log2 abundance per million total lymphocytes of the indicated lymphoid cell populations (Y-axis). Each dot represents an individual blood donor, with yellow for female and blue for male. Shading represents the 95% CI. The p-values are from the regression analysis for comparisons to the control group.
Figure 4—figure supplement 2.
Figure 4—figure supplement 2.. T cells increase during follow-up from MIS-C.
Log2 ILC abundance per million lymphocytes in longitudinal pairs of samples collected during acute presentation and during follow-up, from individual children with COVID-19 or MIS-C. The p-values are for change in ILC abundance at follow-up, as determined with linear mixed models, adjusting for age, sex, and group, and with patient as a random effect. Differences in sample size among cell types was due to limited sample availability.
Figure 5.
Figure 5.. Blood ILCs are transcriptionally similar to lung ILCs.RNA-Seq of ILCs sorted from blood of 9 SARS-CoV-2-uninfected controls in comparison to RNA-Seq data of ILCs sorted from jejunum, lung, and spleen.
(A) PCA plot of first two principal components calculated from the top 250 most variable genes across all samples. Each dot represents an individual sample with blue for ILCs sorted from blood, green for lung, yellow for jejunum, and grey for spleen. (B) Heatmap of 355 genes differentially expressed (fold-change >1.5, padj <0.01 as determined with DESeq2) between either blood or lung ILCs and ILCs from the other tissues. (C) Select genes from (B) plotted as DESeq2 normalized counts. Each dot represents an individual sample with blue for ILCs sorted from blood, green for lung, yellow for jejunum, and grey for spleen. Boxplots represent the distribution of the data with the center line drawn through the median with the upper and lower bounds of the box at the 75th and 25th percentiles, respectively. The upper and lower whiskers extend to the largest or smallest values within 1.5 x the interquartile range (IQR).
Figure 6.
Figure 6.. Peripheral blood ILCs exhibit homeostatic ILC2 functions.
(A–B) Flow cytometry for the indicated proteins. Cells in (A) were assayed at steady-state and cells in (B) were assayed either at steady-state or after stimulation with PMA and ionomycin, as indicated. Detection of surface proteins was performed on ILCs gated as Lin-CD56-CD127+ and detection of intracellular proteins was performed on ILCs gated as Lin-TBX21-CD127+. (C) Percent of AREG+ ILCs in blood of control blood donors after stimulation with PMA and ionomycin and gated as Lin-TBX21-CD127+. Each dot represents an individual blood donor (N Female = 13, N Male = 25). Boxplots represent the distribution of the data with the center line drawn through the median with the upper and lower bounds of the box at the 75th and 25th percentiles respectively. The upper and lower whiskers extend to the largest or smallest values within 1.5 x the interquartile range (IQR). The p-value is from a two-sided, Wilcoxon rank-sum test. (D) Log2 percent AREG+ ILCs in blood of controls or people hospitalized with COVID-19 after stimulation with PMA and ionomycin and gated as Lin-TBX21-. Data shown as estimated marginal means with 95% CI, generated from the multiple linear regression reported in the text and averaged across age and sex. The p-value is from the regression analysis.
Figure 6—figure supplement 1.
Figure 6—figure supplement 1.. Males have lower percent AREG+ ILCs, and lower AREG MFI in ILCs, than do females, and there is no effect of age on these parameters.
(A) Effect of age (X-axis) on % AREG+ ILCs or MFI in ILCs (Y-axis as indicated). Each dot represents an individual blood donor, with yellow for female and blue for male. Shading represents the 95% CI. (B) Table of results for regression analyses plotted in (A).

Update of

References

    1. Alghamdi IG, Hussain II, Almalki SS, Alghamdi MS, Alghamdi MM, El-Sheemy MA. The pattern of Middle East respiratory syndrome coronavirus in Saudi Arabia: a descriptive epidemiological analysis of data from the Saudi Ministry of Health. International Journal of General Medicine. 2014;7:417–423. doi: 10.2147/IJGM.S67061. - DOI - PMC - PubMed
    1. Alkhouli M, Nanjundappa A, Annie F, Bates MC, Bhatt DL. Sex Differences in Case Fatality Rate of COVID-19: Insights From a Multinational Registry. Mayo Clinic Proceedings. 2020;95:1613–1620. doi: 10.1016/j.mayocp.2020.05.014. - DOI - PMC - PubMed
    1. Anegón I, Cuturi MC, Trinchieri G, Perussia B. Interaction of Fc receptor (CD16) ligands induces transcription of interleukin 2 receptor (CD25) and lymphokine genes and expression of their products in human natural killer cells. The Journal of Experimental Medicine. 1988;167:452–472. doi: 10.1084/jem.167.2.452. - DOI - PMC - PubMed
    1. Ardain A, Domingo-Gonzalez R, Das S, Kazer SW, Howard NC, Singh A, Ahmed M, Nhamoyebonde S, Rangel-Moreno J, Ogongo P, Lu L, Ramsuran D, de la Luz Garcia-Hernandez M, K Ulland T, Darby M, Park E, Karim F, Melocchi L, Madansein R, Dullabh KJ, Dunlap M, Marin-Agudelo N, Ebihara T, Ndung’u T, Kaushal D, Pym AS, Kolls JK, Steyn A, Zúñiga J, Horsnell W, Yokoyama WM, Shalek AK, Kløverpris HN, Colonna M, Leslie A, Khader SA. Group 3 innate lymphoid cells mediate early protective immunity against tuberculosis. Nature. 2019;570:528–532. doi: 10.1038/s41586-019-1276-2. - DOI - PMC - PubMed
    1. Arpaia N, Green JA, Moltedo B, Arvey A, Hemmers S, Yuan S, Treuting PM, Rudensky AY. A Distinct Function of Regulatory T Cells in Tissue Protection. Cell. 2015;162:1078–1089. doi: 10.1016/j.cell.2015.08.021. - DOI - PMC - PubMed

Publication types

Supplementary concepts

Associated data