. 2022 Mar 11;7(69):eabm0631.
doi: 10.1126/sciimmunol.abm0631. Epub 2022 Mar 11.

Tim-3 adapter protein Bat3 acts as an endogenous regulator of tolerogenic dendritic cell function

Affiliations

Tim-3 adapter protein Bat3 acts as an endogenous regulator of tolerogenic dendritic cell function

Ruihan Tang et al. Sci Immunol. .

Abstract

Dendritic cells (DCs) sense environmental cues and adopt either an immune-stimulatory or regulatory phenotype, thereby fine-tuning immune responses. Identifying endogenous regulators that determine DC function can thus inform the development of therapeutic strategies for modulating the immune response in different disease contexts. Tim-3 plays an important role in regulating immune responses by inhibiting the activation status and the T cell priming ability of DC in the setting of cancer. Bat3 is an adaptor protein that binds to the tail of Tim-3; therefore, we studied its role in regulating the functional status of DCs. In murine models of autoimmunity (experimental autoimmune encephalomyelitis) and cancer (MC38-OVA-implanted tumor), lack of Bat3 expression in DCs alters the T cell compartment-it decreases TH1, TH17 and cytotoxic effector cells, increases regulatory T cells, and exhausted CD8+ tumor-infiltrating lymphocytes, resulting in the attenuation of autoimmunity and acceleration of tumor growth. We found that Bat3 expression levels were differentially regulated by activating versus inhibitory stimuli in DCs, indicating a role for Bat3 in the functional calibration of DC phenotypes. Mechanistically, loss of Bat3 in DCs led to hyperactive unfolded protein response and redirected acetyl-coenzyme A to increase cell intrinsic steroidogenesis. The enhanced steroidogenesis in Bat3-deficient DC suppressed T cell response in a paracrine manner. Our findings identified Bat3 as an endogenous regulator of DC function, which has implications for DC-based immunotherapies.


Conflict of interest statement

Competing interests: All other authors declare that they have no competing interests.

Figures

Fig. 1.
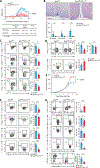
Fig. 1.. The absence of expression of Bat3 in DCs pro-foundly affects DC–T cells cross-talk.
(A) Top: Summary plot of mean clinical scores of Bat3fl/fl and Bat3fl/flCD11cCRE mice subjected to EAE induction by MOG35–55 emulsions. Bottom: Summary table of EAE disease of littermate control Bat3fl/fl and Bat3fl/flCD11cCRE mice (n = 15 to 29, linear mixed model). (B) Top: Representative hematoxylin and eosin–stained spinal cord section showing inflammatory foci in meninges and parenchyma of a representative Bat3fl/fl mouse. There is no inflammation in the Bat3fl/flCD11cCRE mouse. Bottom: Graph demonstrates counts of inflammatory foci. Scale bar, 100 μm. Tissues collected from the same experiment from (A). Unpaired multiple t test. (C) The activation status of cDCs (CD3CD19NK1.1Siglec FLy6F4/80CD45hiCD11chi cells) infiltrating the spinal cord and brain of Bat3fl/fl and Bat3fl/flCD11cCRE mice on day 9 after immunization with MOG35–55 emulsions (n = 5, unpaired Student’s t test). (D) The frequency of IFN-γ+, IL-17A+, or FoxP3+ CD4+ T cells infiltrating the spinal cord and brain of Bat3fl/fl and Bat3fl/flCD11cCRE mice at the peak of EAE disease (n = 5, unpaired Student’s CRE t test). (E) Tumor growth curve of MC38-OVAdim cells implanted in Bat3fl/fl and Bat3fl/flCD11cCRE mice subcutaneously (n = 6 to 7, linear mixed model). Mean tumor growth is shown. (F and G) Infiltrating myeloid cells and TILs were harvested from mice bearing MC38-OVAdim at a tumor size of 120 to 150 mm2 as determined by the growth observed in WT control (n = 6, unpaired Student’s t test). (F) Fluorescence- activated cell sorting (FACS) analysis of MHC-II, CD40, CD80, CD86, and PDL1 expression on cDCs. (G) FACS analysis of Tim-3+PD1+, TNF-α+, IFN- γ+, and CD107a+Granzyme B+CD8+ TILs. Data are representative of at least three independent experiments with similar results. Error bars show means ± SEM. *P < 0.05, **P < 0.01, and ***P < 0.001, and ****P < 0.0001.
Fig. 2.
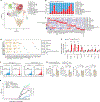
Fig. 2.. Bat3 regulates the functional plasticity of DCs in vivo.
(A) Schematic illustration of experimental procedures used for 2D2 naïve T cells transfer to mice subjected to EAE induction by MOG35–55 emulsions. (B to D) dLN and CNS infiltrating lymphocytes were obtained from the Bat3fl/fl and Bat3fl/flCD11cCRE mice at the onset (day 7) or the peak of disease with an average score of 3 (day 15) after EAE induction (n = 5). (B) Frequency of BrdU+ cells and 2D2 (Vα3.2+ CD4+ T) cells among the CD4+ T cells in dLN (left) and CNS (right). (C) Frequency of IFN-γ+, IL-17A+, and IL-10+ cells among the 2D2 cells in dLN (left) and CNS (right). (D) Frequency of FoxP3+ cells among the 2D2 cells in the dLN (left) and CNS (right). (E) Schematic illustration of BMDCs derived from Bat3fl/fl and Bat3fl/flCD11cCRE mice transfer to WT recipient mice subjected to EAE induction by MOG35–55 emulsions. (F) Left: Average clinical score of EAE in WT recipient mice. Right: The average histological score of CNS and spinal cord sections of the recipient mice (n = 4). (G) FACS analysis of the MHC-II+, CD40+, CD80+, CD86+, PDL1+, and PDL2+CD11chi cells from BMDCs derived from WT or Bat3fl/flCD11cCRE mice activated by LPS (500 ng/ml) for 24 hours (n = 5 to 6). (H and I) BMDCs derived from WT or Bat3fl/flCD11cCRE mice were cocultured with CellTrace Violet (CTV)–labeled 2D2 T cells for 72 hours. 2D2 cell proliferation and cytokine production were assessed by flow cytometry. (H) Frequency of proliferated 2D2 cells (n = 6). (I) Frequency of IFN-γ+, IL-17A+, IL-10+, and FoxP3+ cells gated on the proliferated 2D2 cells (n = 5). Data are representative of at least three independent experiments. Error bars show means ± SEM. (J) CellTrace Violet-dilution analysis of OT-I and OT-II cells co-cultured with OVA protein-pulsed tDCs isolated from tumor of dLN of Bat3fl/fl or Bat3fl/flCD11cCRE mice bearing MC38-OVAdim tumors for 2 weeks. *P < 0.05, **P < 0.01, ***P < 0.001, and ****P < 0.0001, unpaired Student’s t test.
Fig. 3.
Fig. 3.. The expression level of Bat3 is regulated by microenvironmental cues.
(A) Frequency of Bat3+CD11chi BMDCs activated by the indicated TLR agonists (LPS), STING agonist [cyclic guanosine monophosphate–adenosine monophosphate (cGAMP)], and IFN-γ, and indicated tolerance inducing reagents (TGF-β/IL-10, DEX, and rapamycin) (one-way ANOVA). (B) Frequency of Bat3+ DCs in the spleen and iLN in mice in steady state, with EAE or tumor-bearing status. Frequency of Bat3+ DCs was also compared between DC infiltrating the CNS in EAE and tumor mass in MC38-OVAdim cells implanted mice (one-way ANOVA, unpaired Student’s t test). Data are representative of at least three independent experiments (n = 3 to 6). Data are shown as means ± SEM. ****P < 0.0001.
Fig. 4.
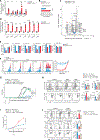
Fig. 4.. The CNS T cell landscape is altered in the absence of Bat3 expression in DCs.
(A) UMAP visualization of CNS-infiltrating T cells isolated from the Bat3fl/fl and Bat3fl/flCD11cCRE mice (n = 5 per genotype pooled) immunized with MOG35–55 emulsion. Colors indicate unbiased T cell classification via graph-based clustering. Each dot represents an individual cell. Tfh, T follicular helper. (B) Bar plots representing proportion of CNS-infiltrating T cells from Bat3fl/fl and Bat3fl/flCD11cCRE mice in the different clusters. (C) Heatmap reports scaled expression [log TPM (transcripts per million) values] of discriminative gene sets for each cluster defined in Fig. 6A. Tsc22d3 was enriched in CNS-infiltrating T cells from Bat3fl/flCD11cCRE mice. (D) Dot plot of top DE genes (DEGs) of different clusters of CNS-infiltrating T cells from Bat3fl/fl and Bat3fl/flCD11cCRE mice. Only the clusters that passed the log2 fold change of >1 (P < 0.05) are shown. (E) Expression of steroidogenesis genes in CD4+ T cells in the iLN from the Bat3fl/fl or Bat3fl/flCD11cCRE mice at day 8 after immunization with MOG35–55 emulsion (n = 5 to 10, unpaired multiple t test). (F and G) BMDCs derived from Bat3fl/fl or Bat3fl/flCD11cCRE mice were cocultured with CellTrace Violet–labeled naïve CD4+ T cells from either Nr3c1fl/fl or Nr3c1fl/fldLckCRE mice for 72 hours. T cell proliferation and cytokine production were assessed by flow cytometry. n = 6. (F) Frequency of proliferated T cells. (G) Frequency of proliferated T cells, division index, and IFN-γ+ and TNF-α+ cells among the proliferated cells (two-way ANOVA). (H) Clinical score of EAE in the MOG35–55 emulsion immunized Nr3c1fl/fl or Nr3c1fl/fl dLckCRE (GRcKO) that received BMDCs derived from either Bat3fl/fl or Bat3fl/flCD11cCRE mice (n = 4 to 6). Data are representative of three independent experiments. Error bars show means ± SEM. NS, not significant. *P < 0.05, **P < 0.01, and ***P < 0.001.
Fig. 5.
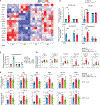
Fig. 5.. Enhanced activation of UPR leads to acquisition of regulatory-like features by Bat3-deficient DCs.
(A) Expression of the gene encoding enzymes involved in glucocorticoid biosynthesis in BMDCs derived from the Bat3fl/fl or Bat3fl/flCD11cCRE mice and treated with LPS (500 ng/ml) for 6hours (n=5) (unpaired multiple t test). (B) BMDCs were treated with LPS (500 ng/ml) for 96 hours, and the supernatant was collected. The corticosterone levels in the culture medium were quantified by ELISA (n = 5 per group, unpaired Student’s t test). (C) Volcano plot showing the DEGs between BMDCs derived from Bat3fl/fl and Bat3fl/flCD11cCRE mice on LPS stimulation; plotted values are normalized gene expression units (transcripts per million) and scaled across samples in all conditions (n=5). (D) Expression of Xbp1s, Sec61a1, Atf4, ERdj4, Ddit3, Grp94, Gadd34, and Grp78 in BMDCs derived from Bat3fl/fl and Bat3fl/fl CD11cCRE mice treated with LPS (500 ng/ml) (n = 5). Data were normalized to endogenous actin levels in each sample (unpaired multiple t test). (E and F) LPS-stimulated BMDCs derived from Bat3fl/fl or Bat3fl/flCD11cCRE mice were treated with 4PBA or vehicle control, respectively, for 8 hours (n=5). (E) Frequency of MHC-II+, CD40+, CD80+, CD86+, PDL1+, and PDL2+ CD11chi BMDCs in the indicated groups (two-way ANOVA). (F) Proliferation of CellTrace Violet–labeled 2D2 cell cocultured with BMDCs treated with indicated dose of 4PBA for 72hours (unpaired multiple t test). (G) Clinical score of EAE in MOG35–55 emulsion immunized WT mice that received indicated BMDCs subcutaneously at days 0 and 3 after immunization (n = 5 to 6, linear mixed model). (H) Frequency of total CD4+ T cells (among CD45hi) and IFN-γ + cells (among CD45hi CD4+ ) infiltrating in the CNS (n=5 to 6, one-way ANOVA). (I) OVA protein–pulsed BMDCs derived from Bat3fl/fl or Bat3fl/flCD11cCRE mice treated with 4PBA were administrated subcutaneously in WT mice implanted with MC38-OVAdim tumors. Mean tumor growth is shown (n = 5, linear mixed model). (J) Frequency of IFN-γ + CD8+ TILs (n = 5, one-way ANOVA). Data are representative of three independent experiments. Error bars show means ± SEM. *P< 0.01, ***P < 0.001, and ****P < 0.0001.
Fig. 6.
Fig. 6.. Bat3-mediated ER stress regulates regulatory phenotype of DCs by calibrating cell-intrinsic steroidogenesis.
(A) Heatmap representation of BMDCs subjected to qPCR. Plotted values are z score of fold changes normalized to endogenous actin levels in each sample (n = 5). (B) Relative levels of acetyl-CoA, citrate, fumarate, and cholesterol in control and Bat3ko DCs, represented as fold change of untreated controls (n = 5, two-way ANOVA). (C) ELISA in supernatants collected from BMDC treated with indicated conditions for 96 hours. The concentration of corticosterone in supernatant from WT BMDCs was scaled to 1.0 as control, and relative corticosterone levels were quantified as fold change of control group (n = 5, one-way ANOVA). (D and E) Cells were sorted from the inguinal LN of the Bat3fl/fl, Bat3fl/flCD11cCRE mice, or the Xbp1fl/flBat3fl/flCD11cCRE mice on day 8 after immunization with MOG35–55 emulsion (n = 5 to 10, one-way ANOVA). (D) Expression of the gene encoding enzymes involved in glucocorticoid biosynthesis in dLN-derived DCs. (E) Expression of the glucocorticoid-responsive genes in dLN-derived CD4+ T cells and CD8+ T cells. Data are representative of three independent experiments with similar results. Error bars show means ± SEM. *P < 0.05, **P < 0.01, ***P < 0.001, and ****P < 0.0001.
Fig. 7.
Fig. 7.. Proposed model for Bat3 regulating the DC function.
Loss of Bat3 activates ER stress, which, in turn, inhibits the TCA cycle, leading to the accumulation of citrate. Citrate serves as a substrate for the synthesis of cholesterol that is broken down to produce glucocorticoids. DC-derived glucocorticoids act on T cells to inhibit autoreactive T cell responses in EAE and antitumor T cell responses in MC38 colon carcinoma.

References

    1. Durai V, Murphy KM, Functions of murine dendritic cells. Immunity 45, 719–736 (2016). - PMC - PubMed
    1. Merad M, Sathe P, Helft J, Miller J, Mortha A, The dendritic cell lineage: Ontogeny and function of dendritic cells and their subsets in the steady state and the inflamed setting. Annu. Rev. Immunol 31, 563–604 (2013). - PMC - PubMed
    1. Cabeza-Cabrerizo M, Cardoso A, Minutti CM, Pereira da Costa M, Reis E Sousa C, Dendritic cells revisited. Annu. Rev. Immunol 39, 131–166 (2021). - PubMed
    1. C. A. Iberg, A. Jones, D. Hawiger, Dendritic cells as inducers of peripheral tolerance. Trends Immunol. 38, 793–804 (2017). - PMC - PubMed
    1. Benham H, Nel HJ, Law SC, Mehdi AM, Street S, Ramnoruth N, Pahau H, Lee BT, Ng J, Brunck ME, Hyde C, Trouw LA, Dudek NL, Purcell AW, O’Sullivan BJ, Connolly JE, Paul SK, Lê Cao KA, Thomas R, Citrullinated peptide dendritic cell immunotherapy in HLA risk genotype-positive rheumatoid arthritis patients. Sci. Transl. Med 7, 290ra287 (2015). - PubMed

Publication types

Substances