. 2022 Mar 11;16(3):e0010273.
doi: 10.1371/journal.pntd.0010273. eCollection 2022 Mar.

Predicting future community-level ocular Chlamydia trachomatis infection prevalence using serological, clinical, molecular, and geospatial data

Affiliations

Predicting future community-level ocular Chlamydia trachomatis infection prevalence using serological, clinical, molecular, and geospatial data

Christine Tedijanto et al. PLoS Negl Trop Dis. .

Abstract

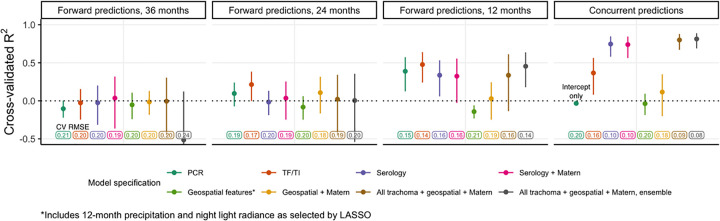
Trachoma is an infectious disease characterized by repeated exposures to Chlamydia trachomatis (Ct) that may ultimately lead to blindness. Efficient identification of communities with high infection burden could help target more intensive control efforts. We hypothesized that IgG seroprevalence in combination with geospatial layers, machine learning, and model-based geostatistics would be able to accurately predict future community-level ocular Ct infections detected by PCR. We used measurements from 40 communities in the hyperendemic Amhara region of Ethiopia to assess this hypothesis. Median Ct infection prevalence among children 0-5 years old increased from 6% at enrollment, in the context of recent mass drug administration (MDA), to 29% by month 36, following three years without MDA. At baseline, correlation between seroprevalence and Ct infection was stronger among children 0-5 years old (ρ = 0.77) than children 6-9 years old (ρ = 0.48), and stronger than the correlation between active trachoma and Ct infection (0-5y ρ = 0.56; 6-9y ρ = 0.40). Seroprevalence was the strongest concurrent predictor of infection prevalence at month 36 among children 0-5 years old (cross-validated R2 = 0.75, 95% CI: 0.58-0.85), though predictive performance declined substantially with increasing temporal lag between predictor and outcome measurements. Geospatial variables, a spatial Gaussian process, and stacked ensemble machine learning did not meaningfully improve predictions. Serological markers among children 0-5 years old may be an objective tool for identifying communities with high levels of ocular Ct infections, but accurate, future prediction in the context of changing transmission remains an open challenge.


Conflict of interest statement

The authors have declared that no competing interests exist.

Figures

Fig 1
Fig 1. Map of study area.
Inset (top right) highlights the Amhara Region (gray shading) of Ethiopia and the study area (black rectangle). Forty communities from three woredas (administrative level 3) in Amhara were included in the WUHA trial. The base map layer for this figure was downloaded from Stamen Maps (“Terrain”) and is available under the CC BY 3.0 license.
Fig 2
Fig 2
Predicted surface (A), variograms (B), and Moran’s I (C) for PCR-confirmed ocular C. trachomatis infection prevalence among 0–5-year-olds at each study month. Maps display prevalence for 40 study communities at each follow-up visit, spatially interpolated over the convex hull using kriging. Variograms capture similarity between community-level prevalence measurements as a function of distance between community pairs (in km), with smaller semivariance values representing increased similarity. Exponential (magenta) and Matérn (green) models were fit to each empirical variogram, and the effective range (dashed vertical line) is defined as the distance at which the fitted model reaches 95% of the sill. The Monte Carlo envelope (gray shading) displays pointwise 95% coverage of 1000 permutations, representing a null distribution. Moran’s I was calculated over 1000 permutations (gray bars, with observed value represented by red line), and a permutation-based p-value was calculated. The base map layer for panel A in this figure was downloaded from Stamen Maps (“Terrain”) and is available under the CC BY 3.0 license.
Fig 3
Fig 3. Correlations between trachoma indicators by age group and over time.
Panels display Spearman rank correlations between community-level seroprevalence and PCR prevalence at study months 0 and 36 (A), active trachoma prevalence and PCR prevalence at months 0 and 36 (B), and PCR prevalence at month 36 and trachoma indicators measured at each survey across 40 study communities (C). Correlations are shown separately for 0–5-year-olds (green) and 6–9-year-olds (purple), and 95% confidence intervals were estimated from 1000 bootstrap samples. Serology data were not collected for a random sample of 6–9-year-olds at months 12 and 24.
Fig 4
Fig 4. Cross-validated R2 for models predicting month 36 community-level PCR prevalence among 0–5-year-olds.
Cross-validated coefficient of determination (R2), 95% influence-function-based confidence interval, and cross-validated root-mean-square error (RMSE, text label) are shown for each model specification. Logistic regression was used for all models with the exception of the stacked ensemble (gray). Blocks of size 15x15 km were used for 10-fold spatial cross-validation.
Fig 5
Fig 5. Cumulative proportion of C. trachomatis infections at month 36 identified by concurrent and forward prediction models.
Dashed lines indicate the point at which the cumulative proportion of identified Ct infections at month 36, scaled to represent a sample of 30 individuals per community, surpassed 80%. The black line in each facet represents the optimal ordering of scaled PCR infections at month 36. To simulate a null distribution, we estimated the cumulative proportion of infections identified for 1000 random orderings of the 40 communities and plotted the 95% pointwise envelope (gray shading). For concurrent and 24-month-forward predictions, models using serology only and PCR only, respectively, performed equally well to a model using all trachoma indicators, geospatial features, a Matérn covariance, and ensemble machine learning; vertical lines were offset slightly for visibility.

References

    1. Taylor HR, Burton MJ, Haddad D, West S, Wright H. Trachoma. The Lancet. 2014. Dec 13;384(9960):2142–52. - PubMed
    1. World Health Organization. WHO Alliance for the Global Elimination of Trachoma by 2020: progress report, 2019. World Health Organization; 2020 Jul p. 349–60. (Weekly epidemiological record). Report No.: 30.
    1. Sata E, Nute AW, Astale T, Gessese D, Ayele Z, Zerihun M, et al.. Twelve-Year Longitudinal Trends in Trachoma Prevalence among Children Aged 1–9 Years in Amhara, Ethiopia, 2007–2019. Am J Trop Med Hyg. 2021. Apr;104(4):1278–89. doi: 10.4269/ajtmh.20-1365 - DOI - PMC - PubMed
    1. World Health Organization. Validation of elimination of trachoma as a public health problem [Internet]. Geneva: World Health Organization; 2016. [cited 2021 Apr 6]. Report No.: WHO/ HTM/NTD/2016.8. Available from: https://apps.who.int/iris/bitstream/handle/10665/208901/WHO-HTM-NTD-2016...
    1. Bailey R, Osmond C, Mabey DCW, Whittle HC, Ward ME. Analysis of the Household Distribution of Trachoma in a Gambian Village Using a Monte Carlo Simulation Procedure. Int J Epidemiol. 1989;18(4):944–51. doi: 10.1093/ije/18.4.944 - DOI - PubMed

Publication types