. 2022 Apr 5;34(4):595-614.e14.
doi: 10.1016/j.cmet.2022.02.009. Epub 2022 Mar 10.

A genome-scale gain-of-function CRISPR screen in CD8 T cells identifies proline metabolism as a means to enhance CAR-T therapy

Affiliations

A genome-scale gain-of-function CRISPR screen in CD8 T cells identifies proline metabolism as a means to enhance CAR-T therapy

Lupeng Ye et al. Cell Metab. .

Abstract

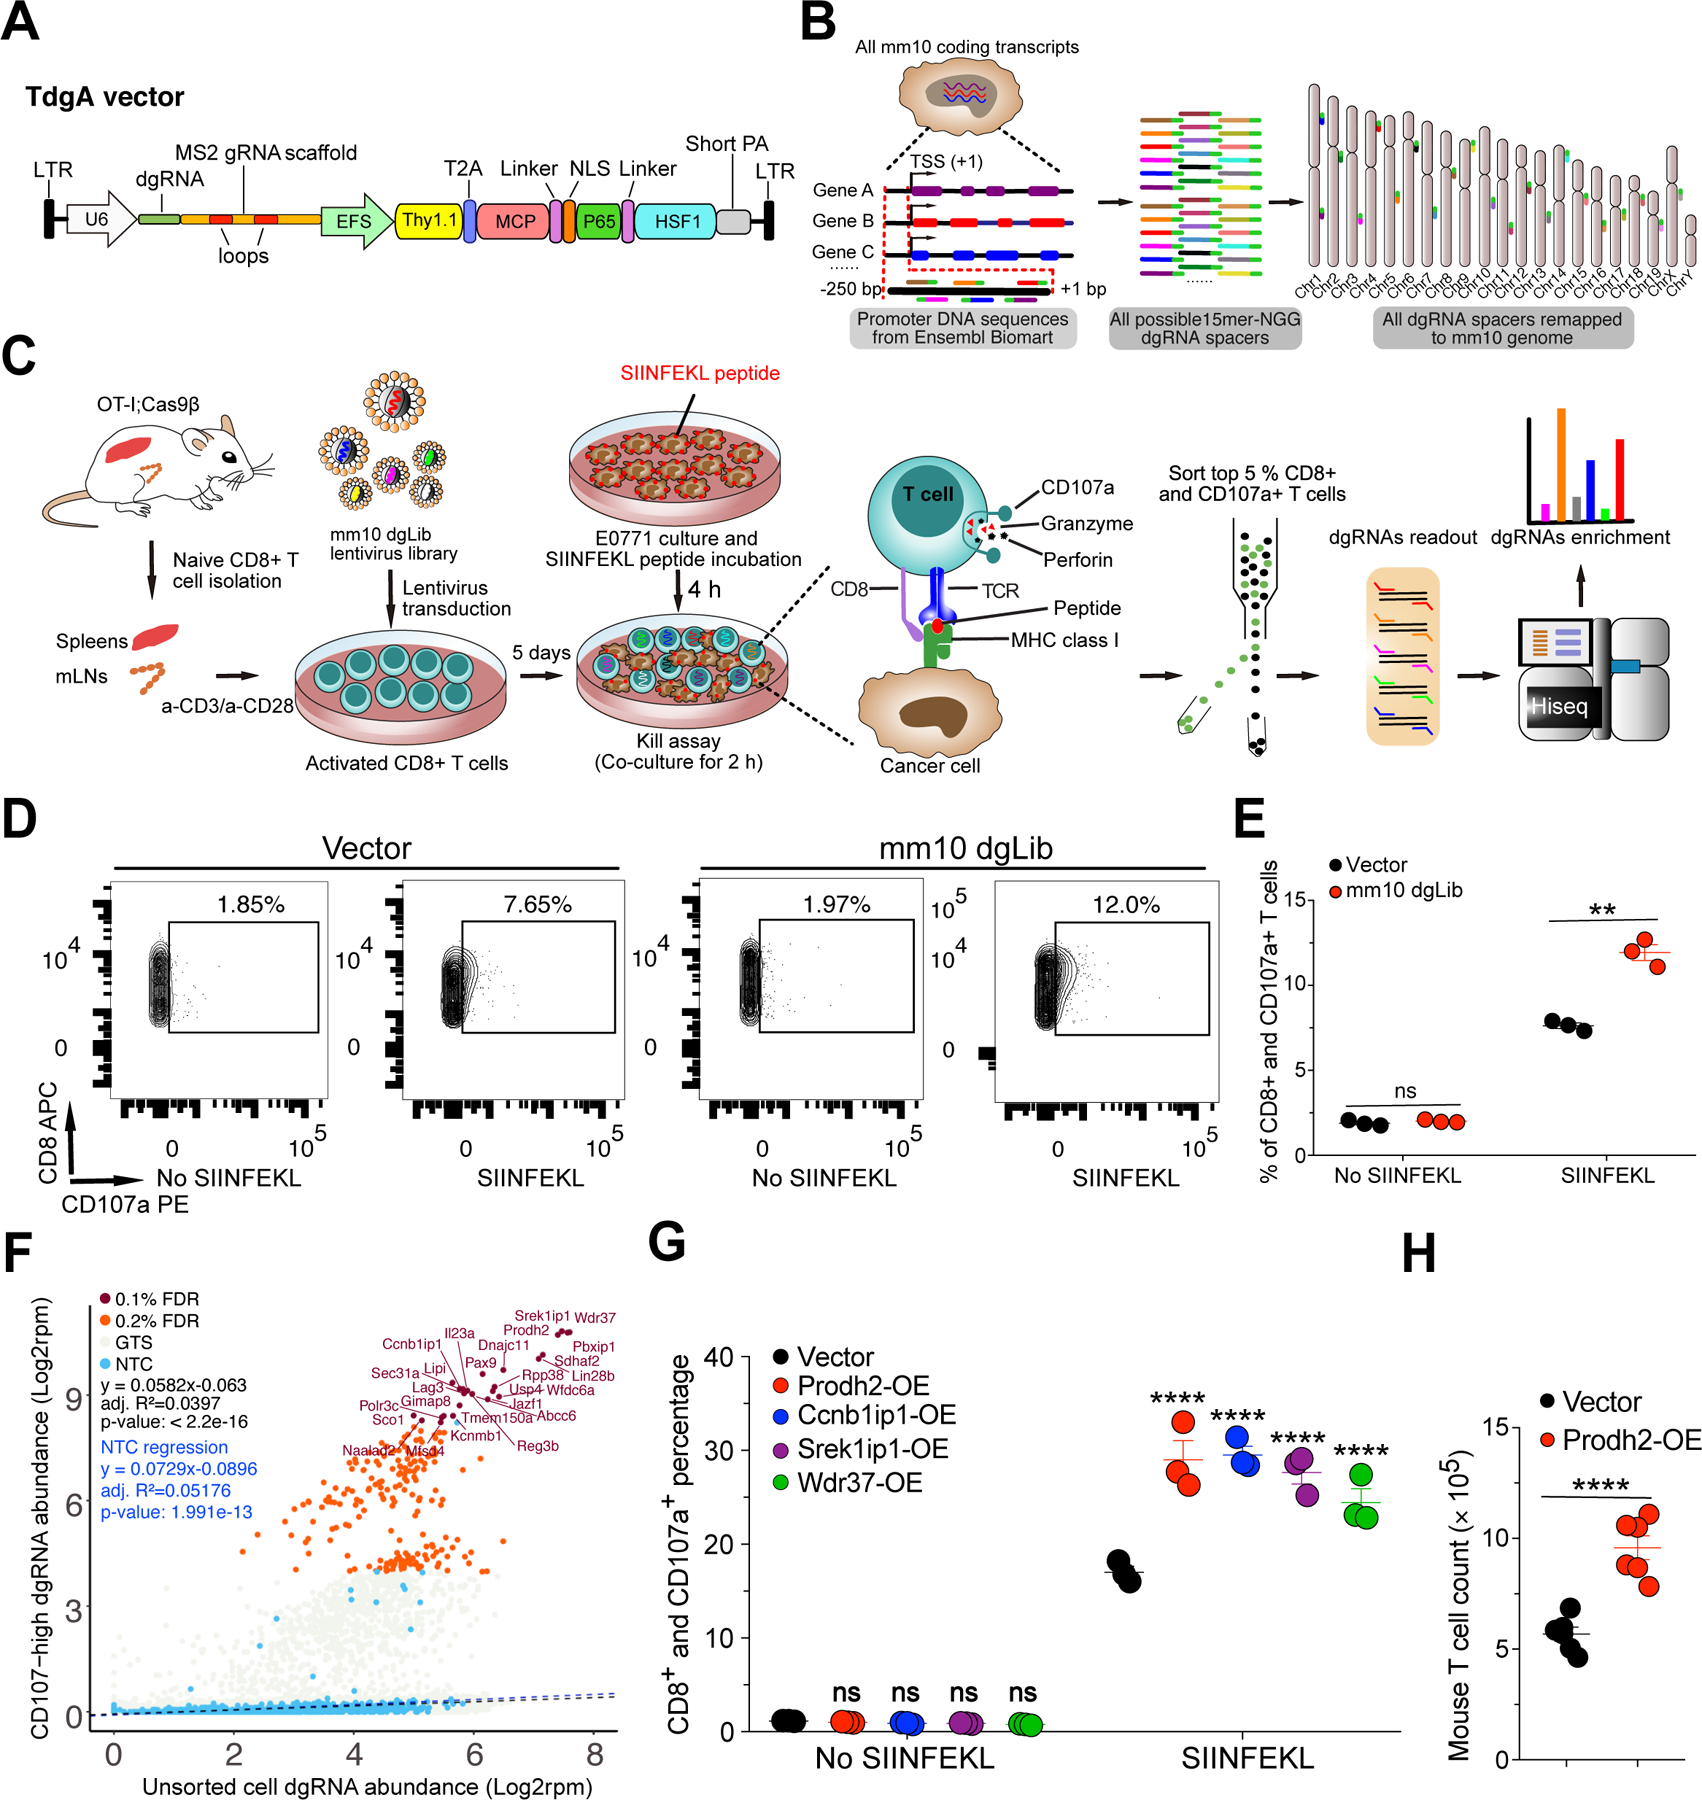
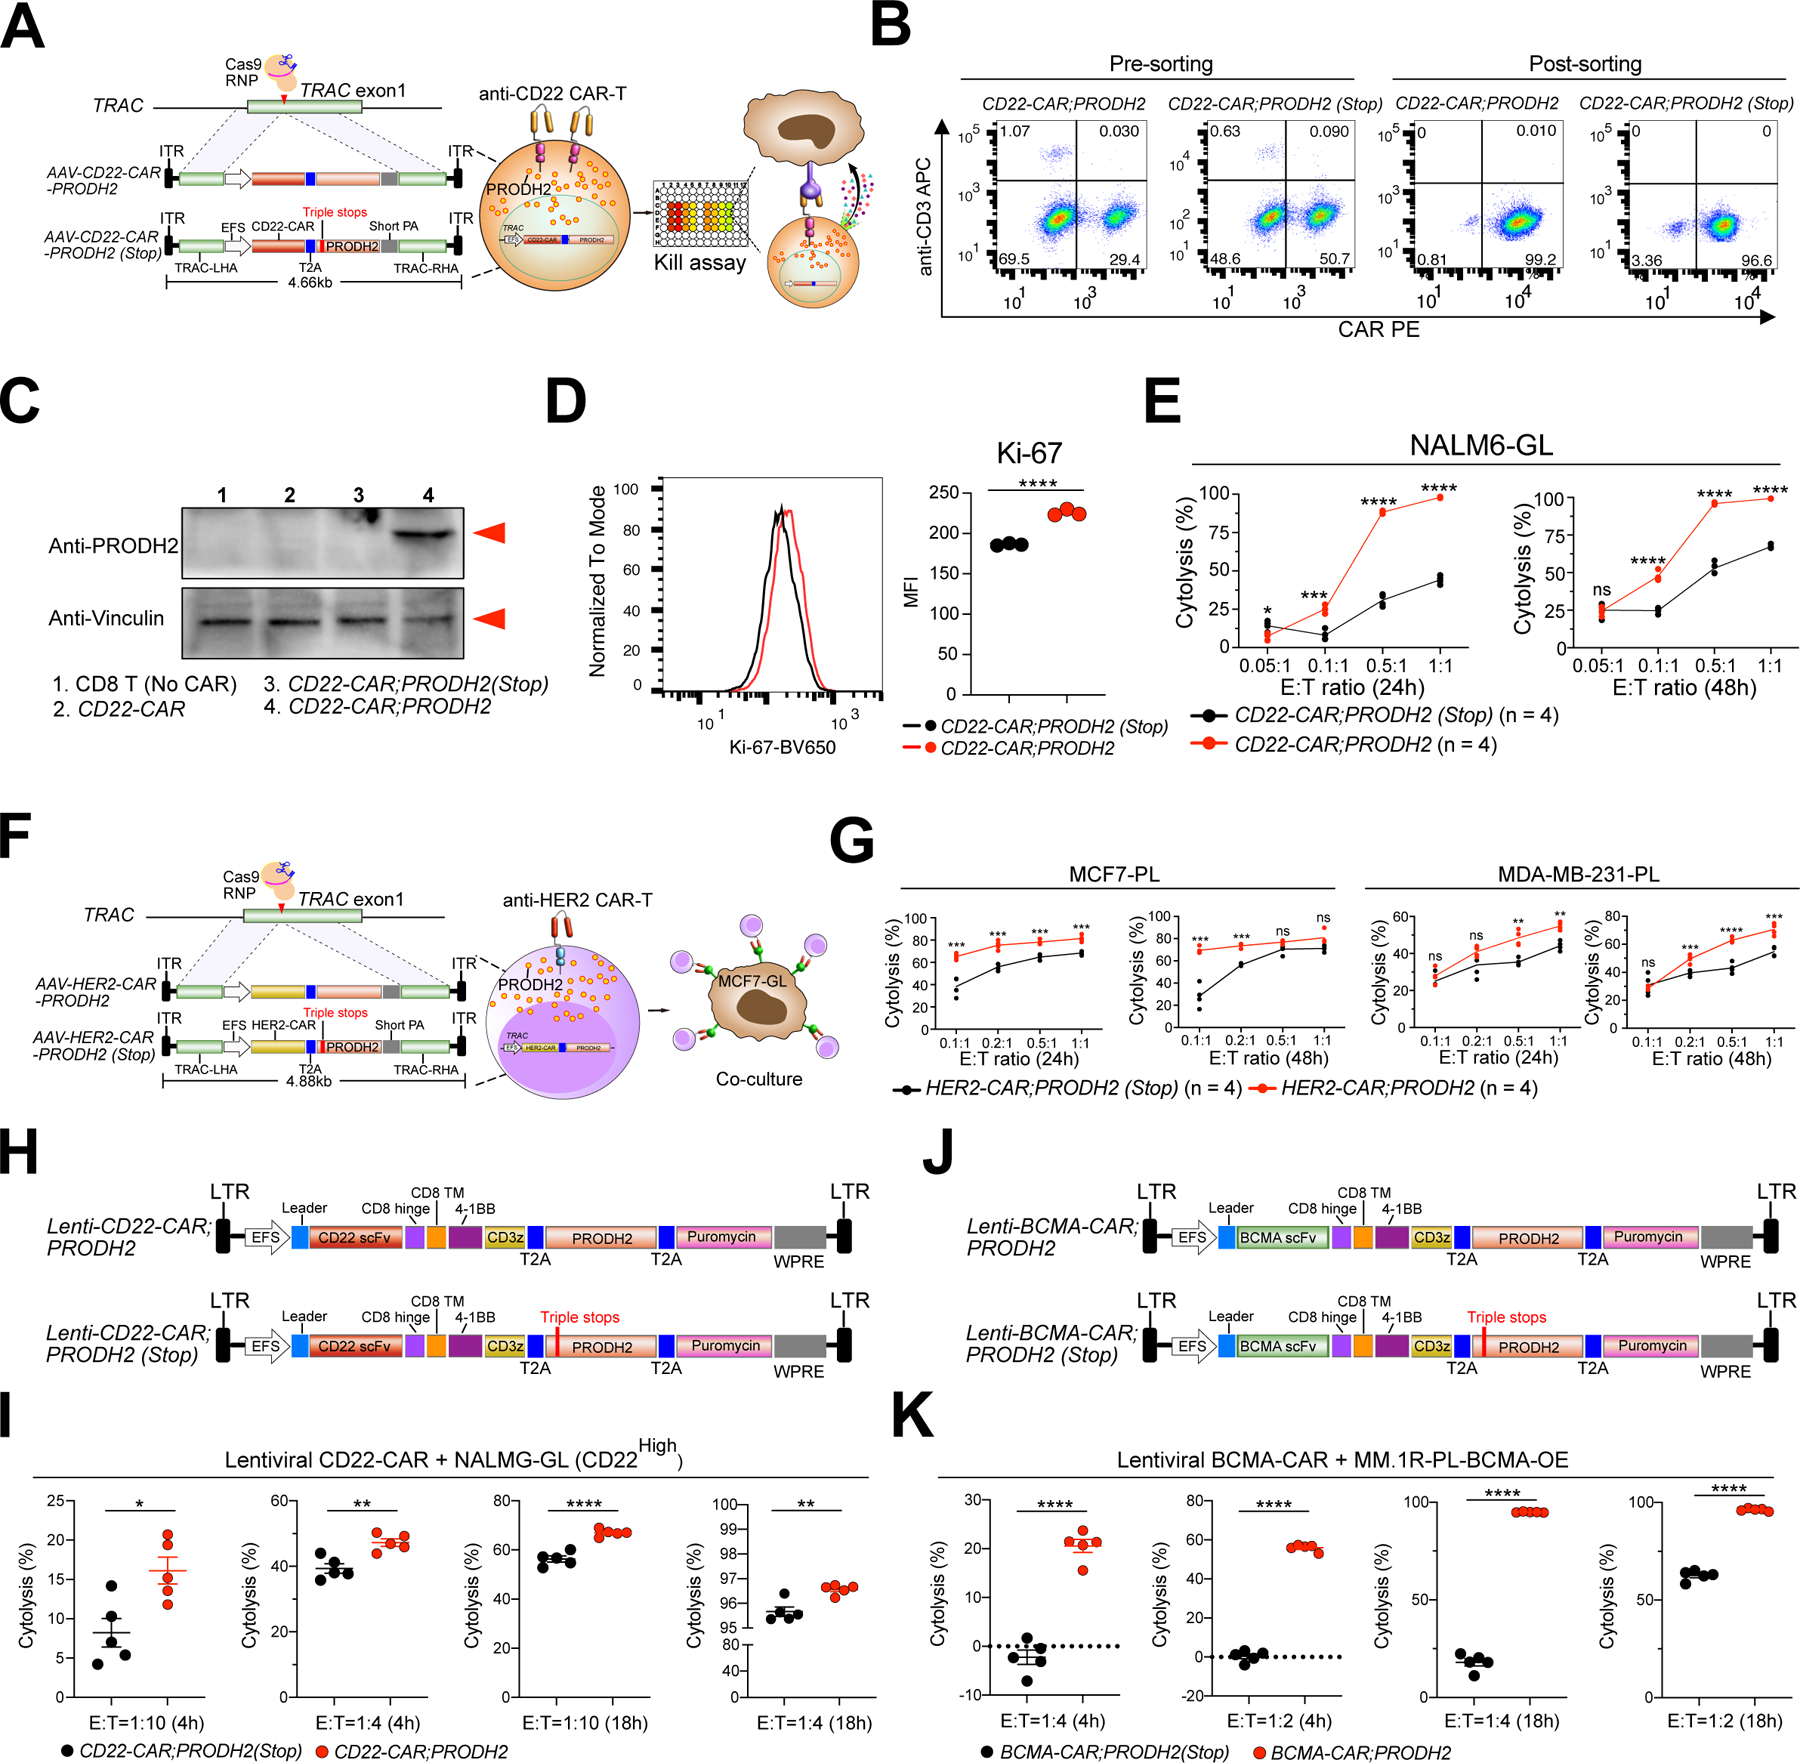
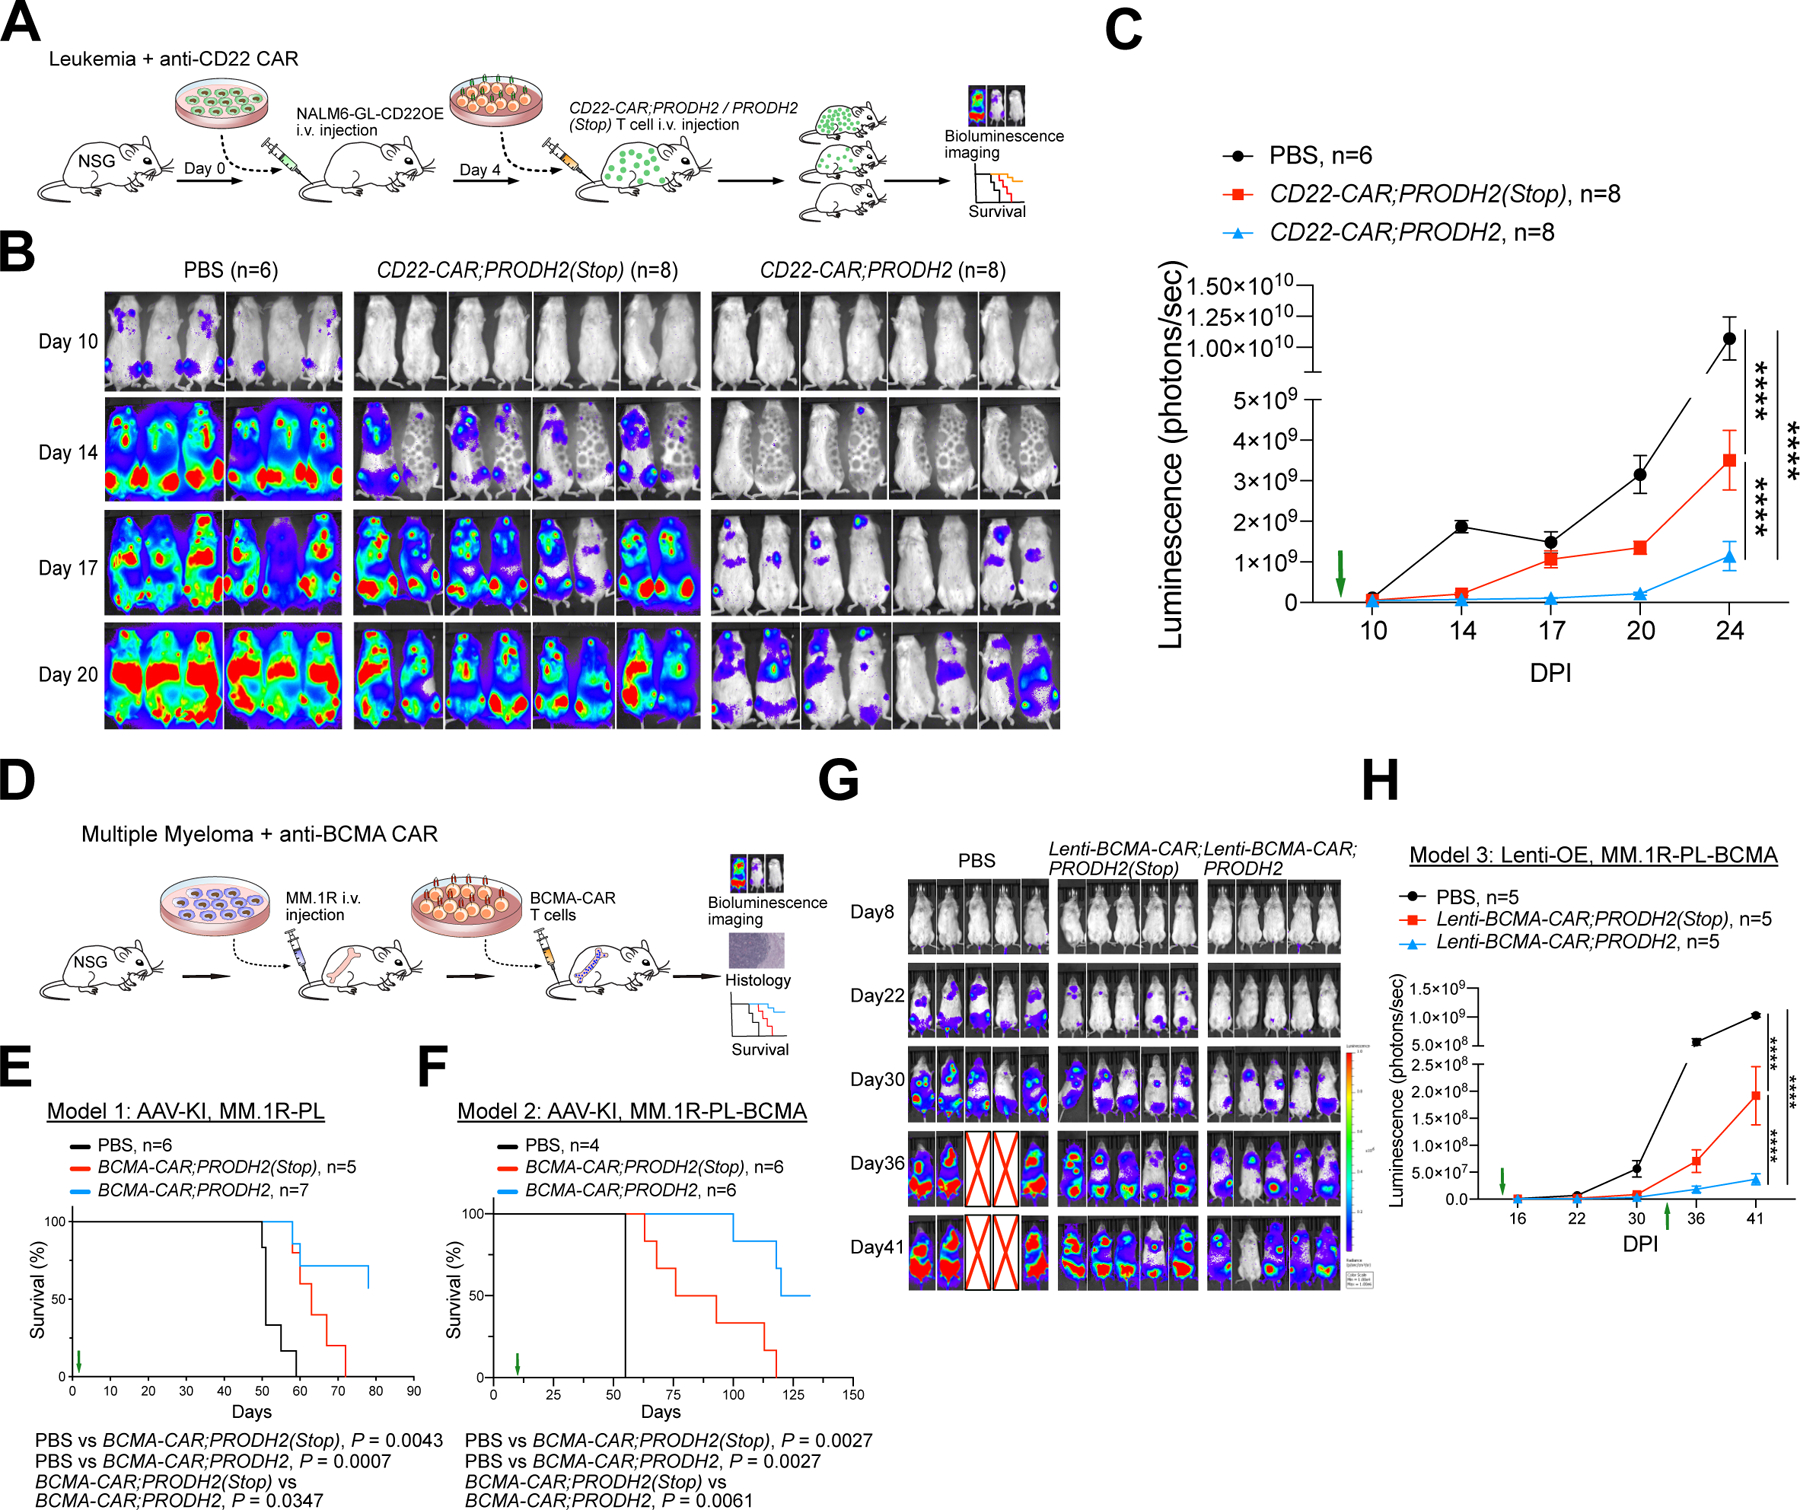
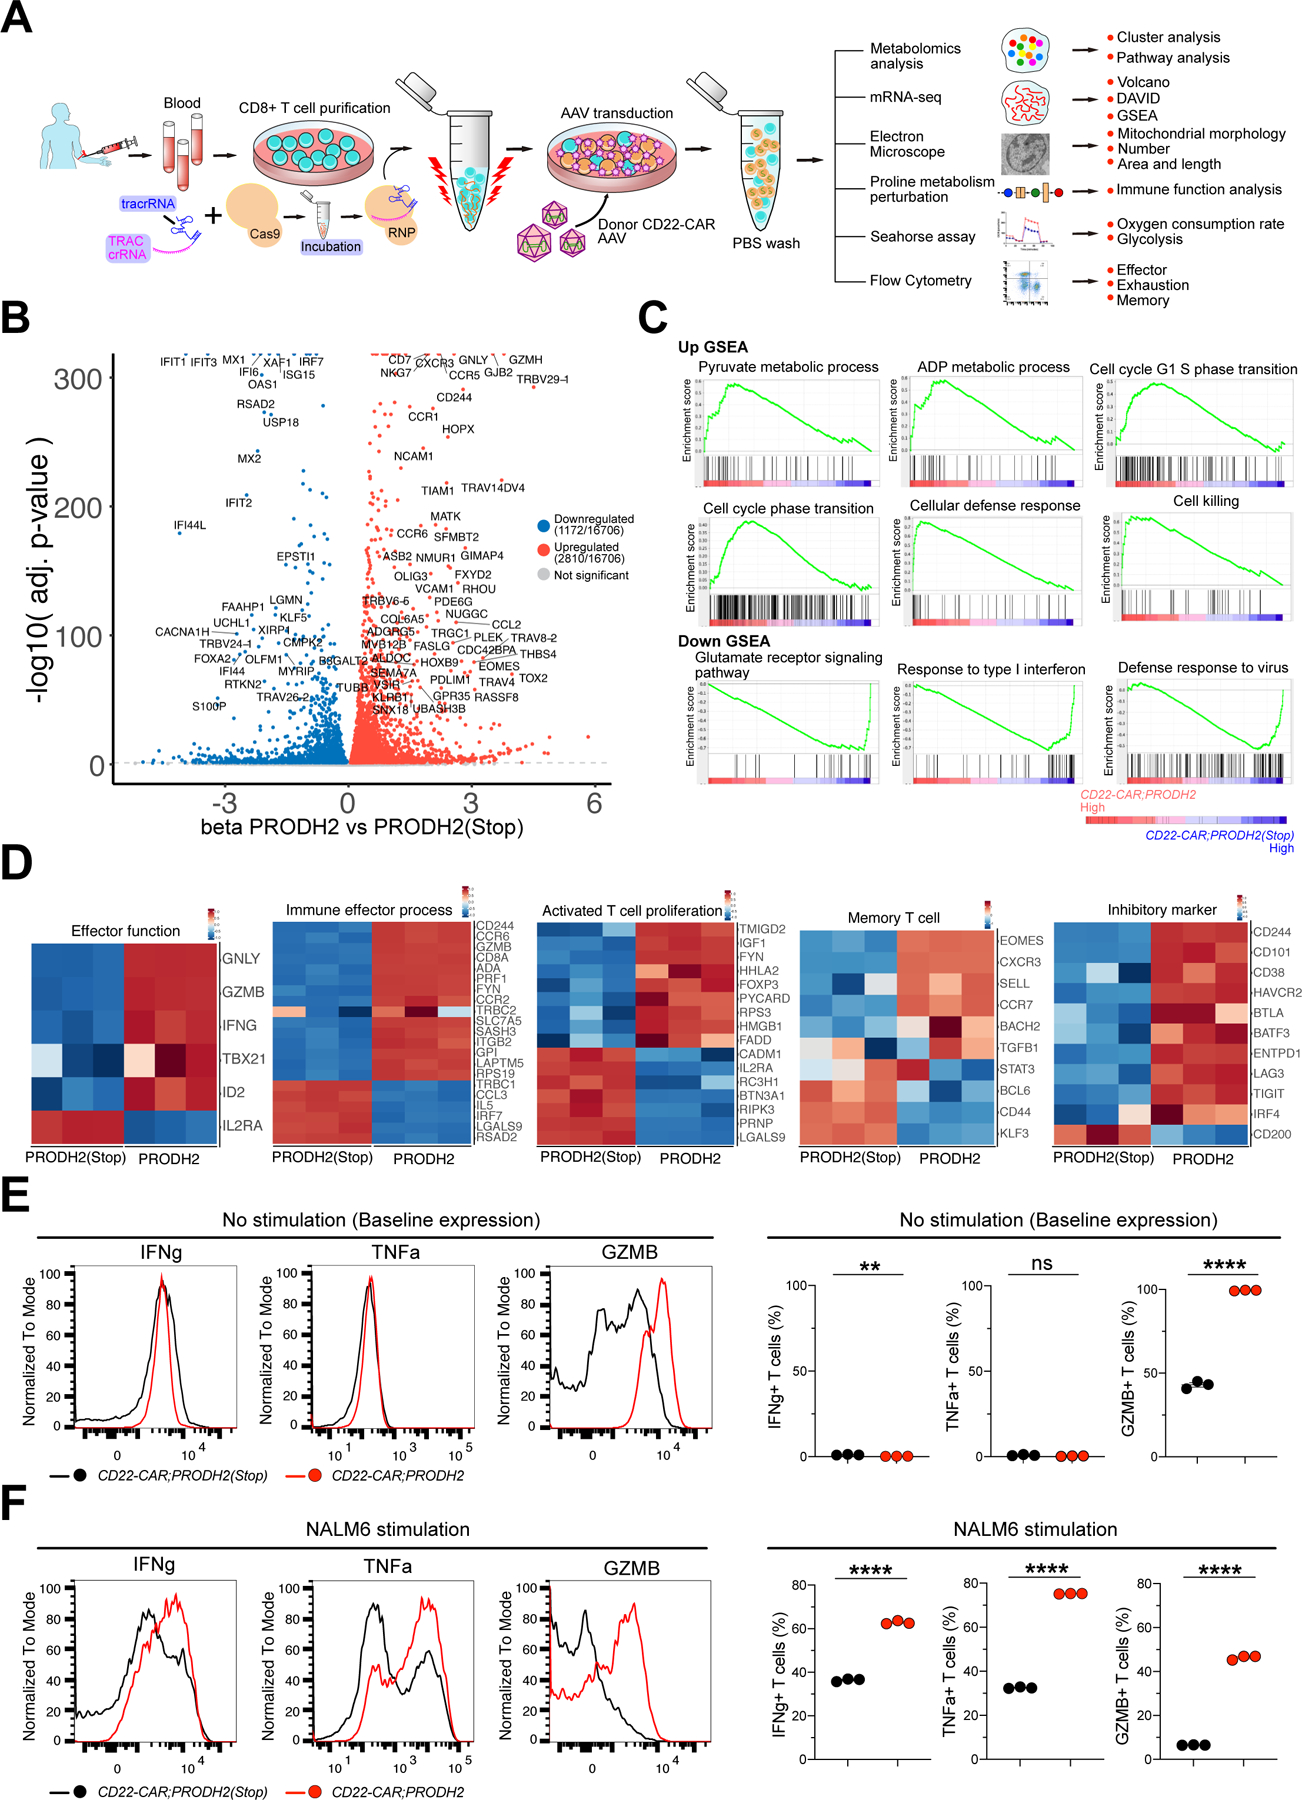
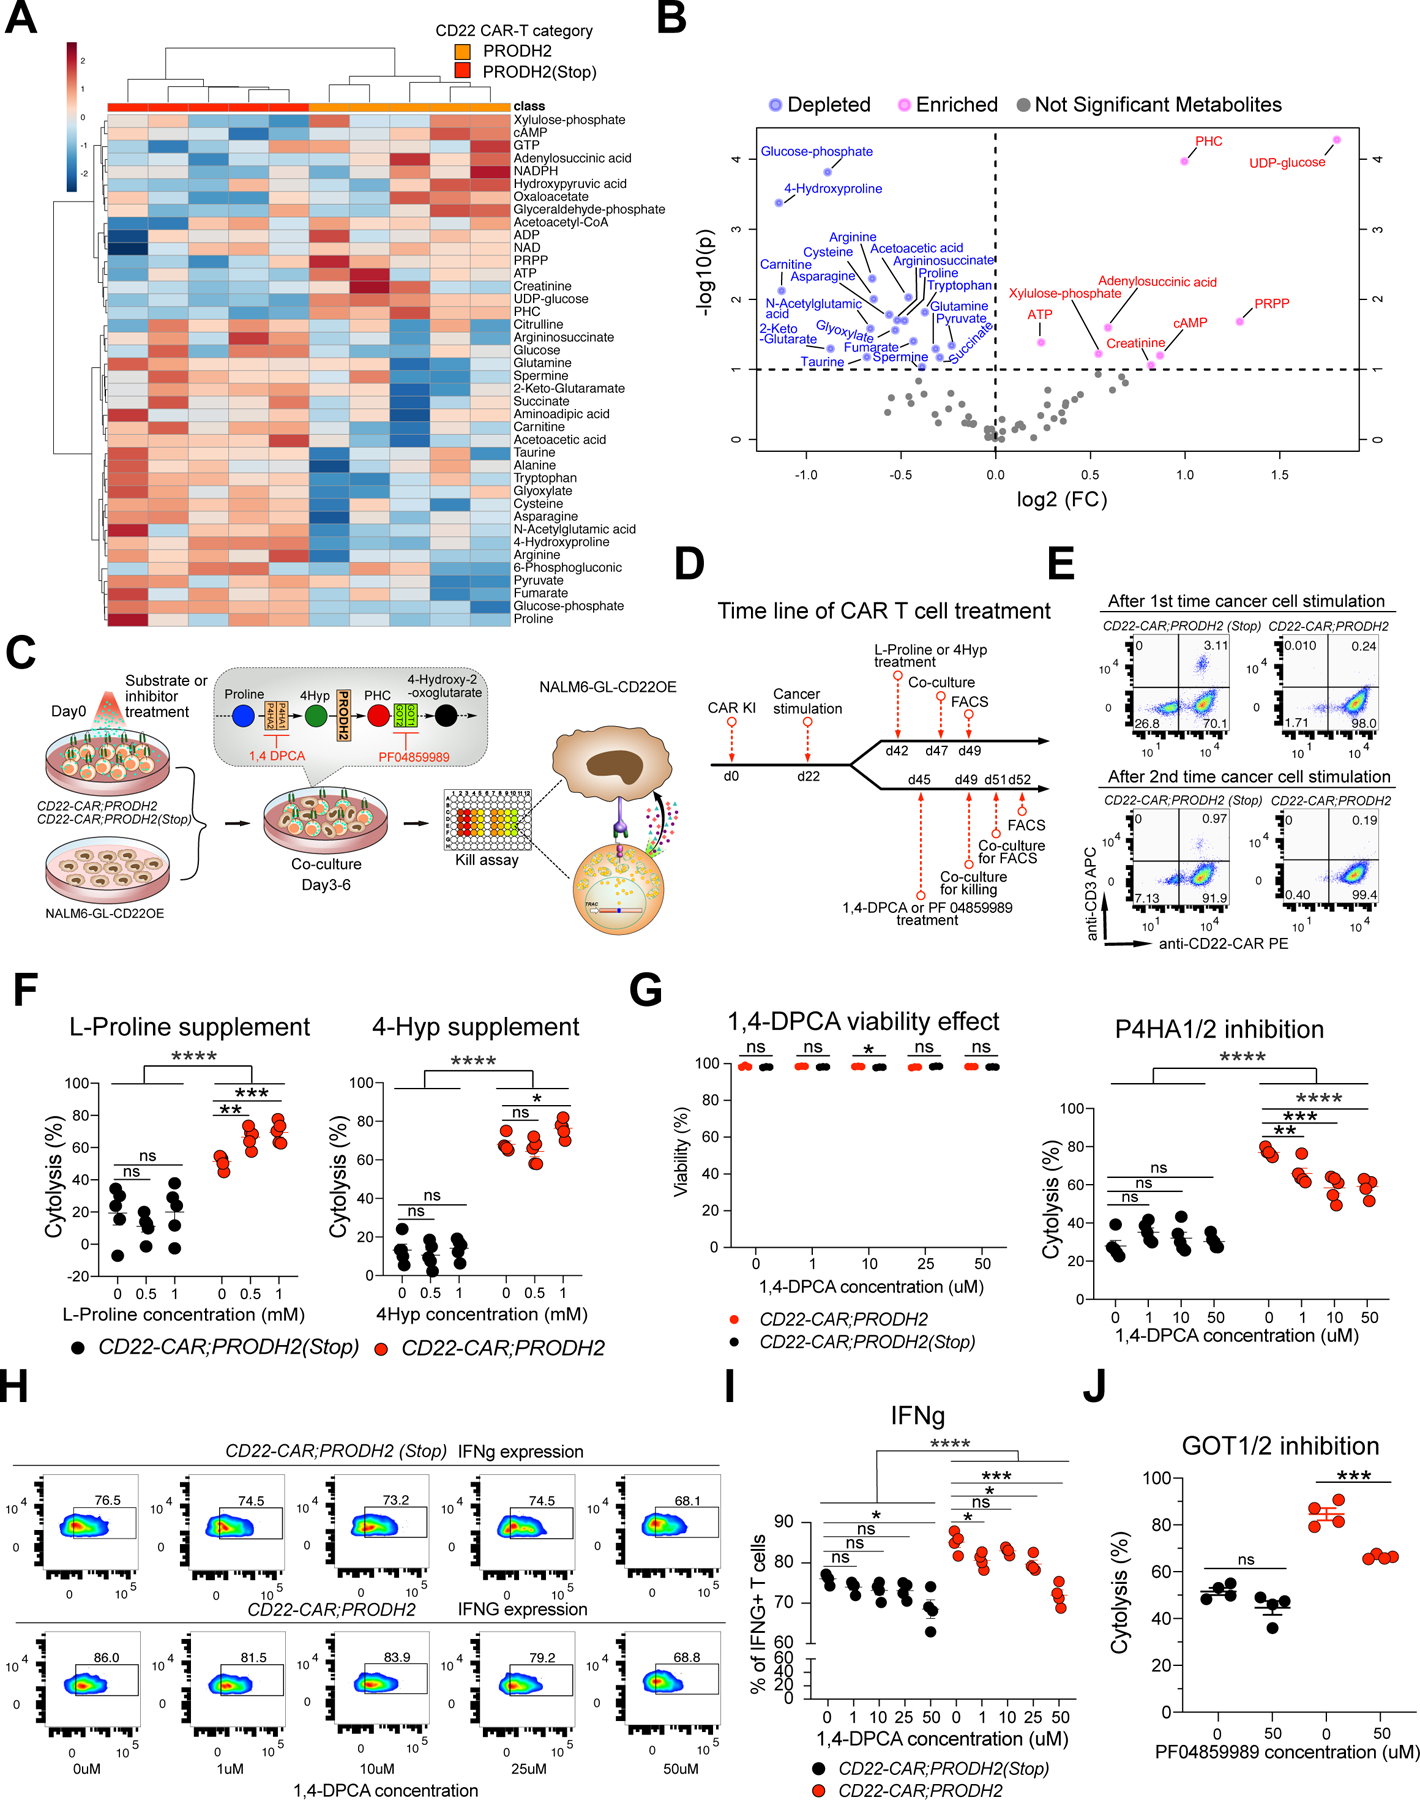
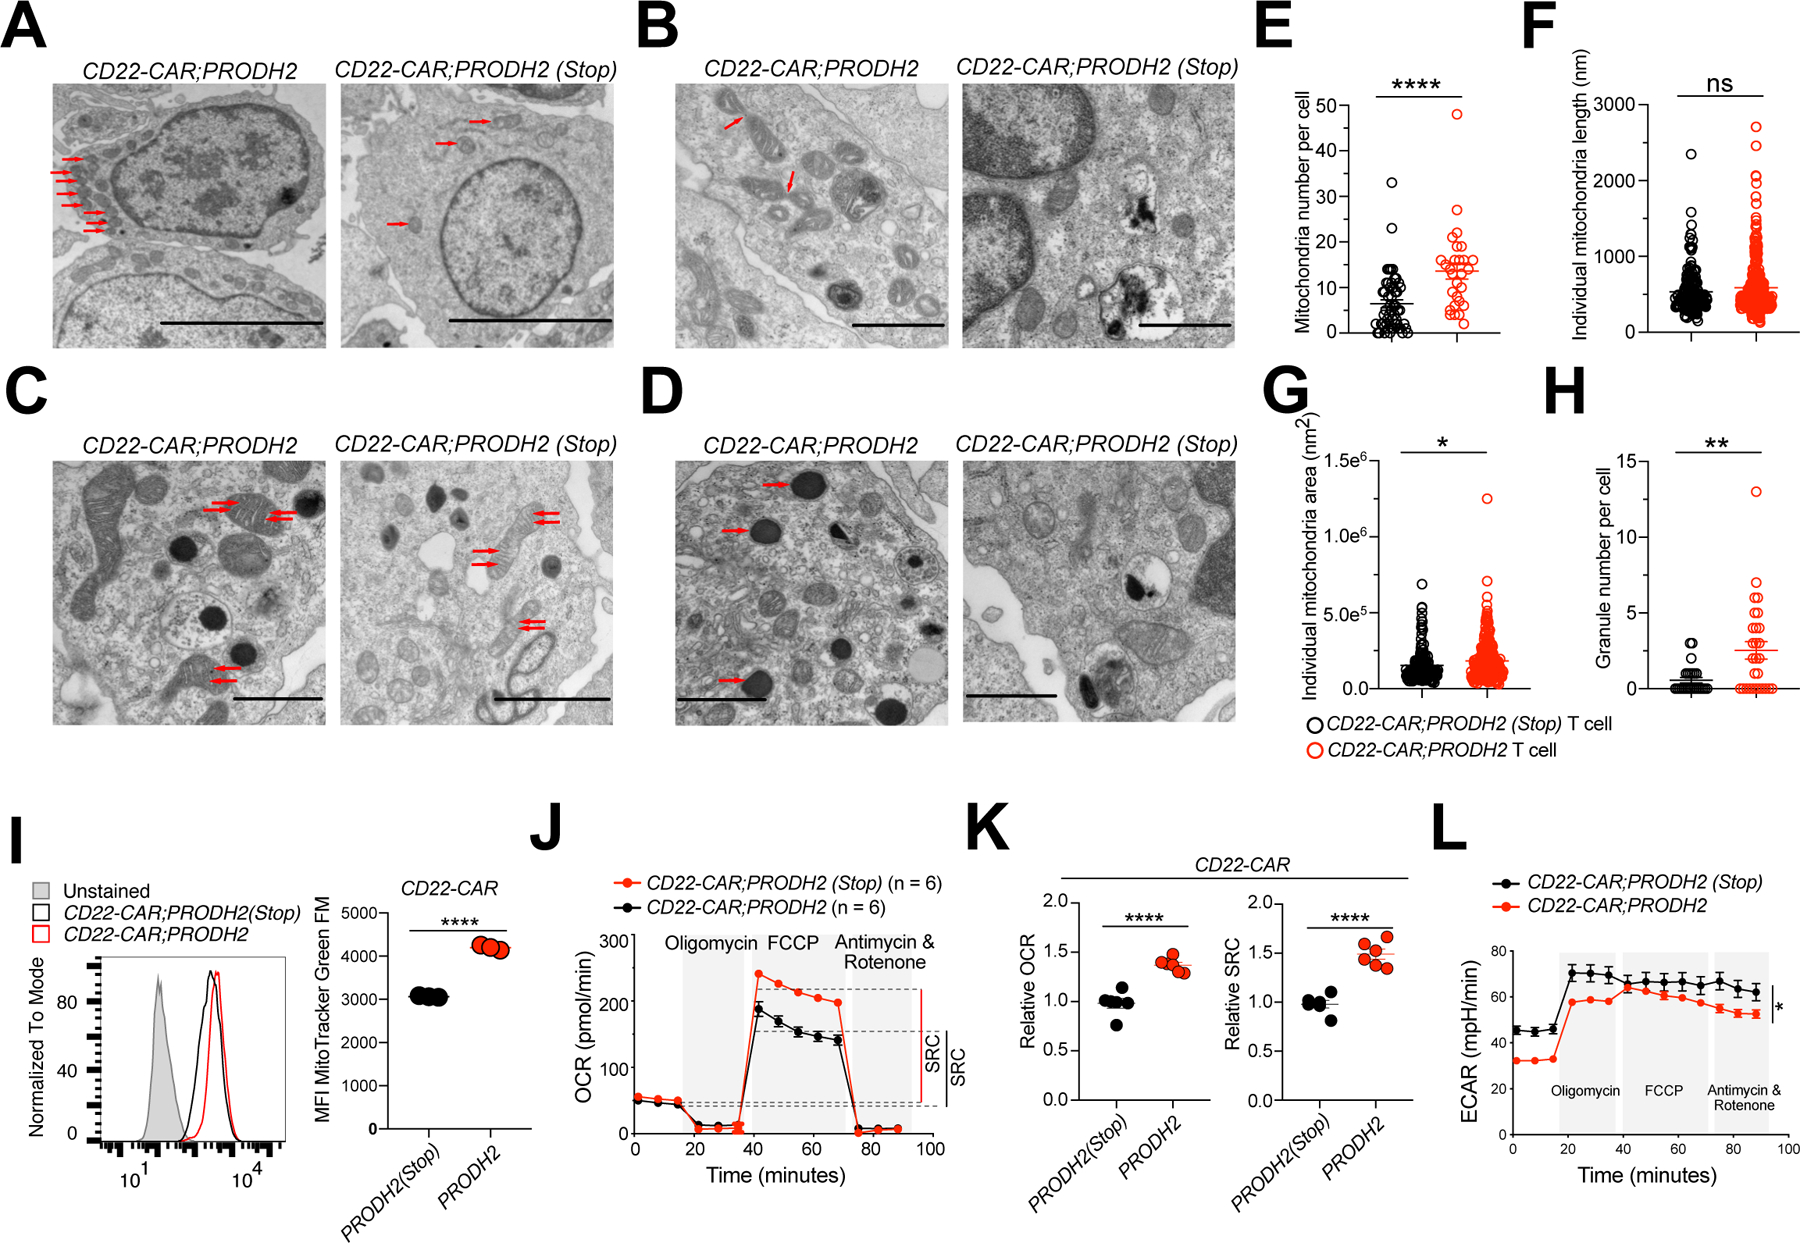
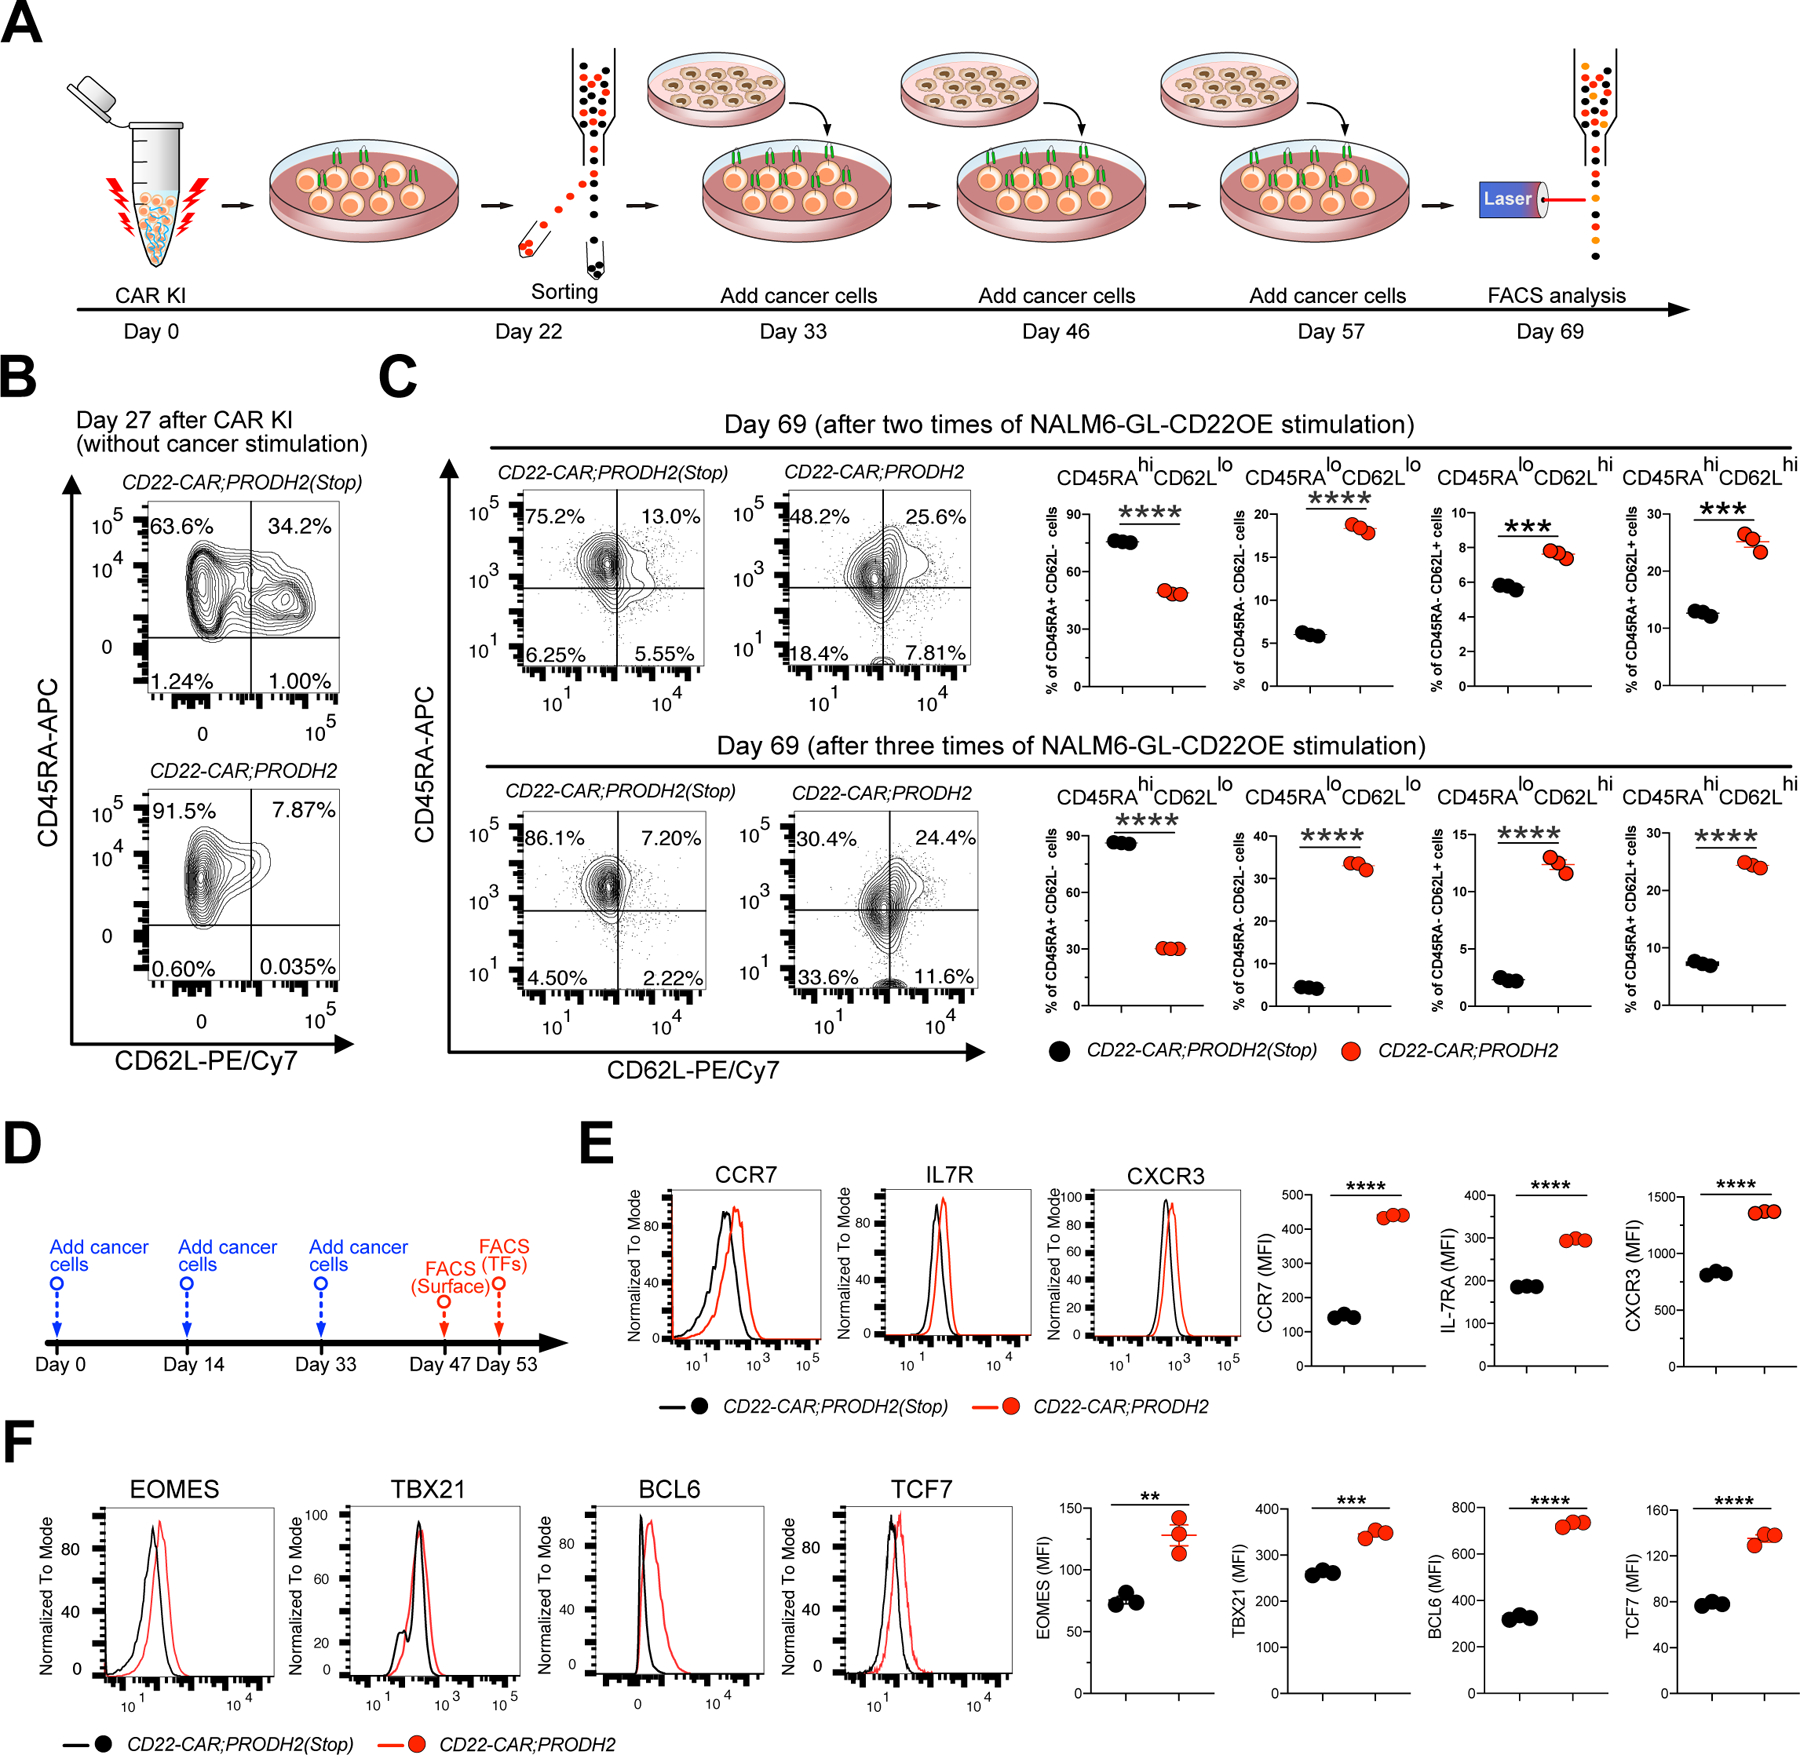
Chimeric antigen receptor (CAR)-T cell-based immunotherapy for cancer and immunological diseases has made great strides, but it still faces multiple hurdles. Finding the right molecular targets to engineer T cells toward a desired function has broad implications for the armamentarium of T cell-centered therapies. Here, we developed a dead-guide RNA (dgRNA)-based CRISPR activation screen in primary CD8+ T cells and identified gain-of-function (GOF) targets for CAR-T engineering. Targeted knockin or overexpression of a lead target, PRODH2, enhanced CAR-T-based killing and in vivo efficacy in multiple cancer models. Transcriptomics and metabolomics in CAR-T cells revealed that augmenting PRODH2 expression reshaped broad and distinct gene expression and metabolic programs. Mitochondrial, metabolic, and immunological analyses showed that PRODH2 engineering enhances the metabolic and immune functions of CAR-T cells against cancer. Together, these findings provide a system for identification of GOF immune boosters and demonstrate PRODH2 as a target to enhance CAR-T efficacy.

Keywords: CAR-T; PRODH2; T cell CRISPR activation screen; T cell GOF screen; antitumor efficacy; dead-guide RNA; metabolism; mitochondria; proline metabolism.


Conflict of interest statement

Declaration of interests S.C. is a cofounder of EvolveImmune Tx and Cellinfinity Bio. A patent has been filed by Yale University related to this study (S.C., L.Y., J.J.P., L.P., R.D.C., and M.B.D. as inventors). The other authors declare no competing interests.

Figures

Figure 1.
Figure 1.. Genome-scale dgRNA activation screen identified genes that boost the effector function of CD8+ T cells
(A) Schematic representation of a T cell dead-guide RNA (dgRNA) activation lentiviral vector (TdgA), which contains a human U6 promoter, a dgRNA scaffold, and Thy1.1-MPH (MCP-p65-HSF1) expression cassette driven by an EFS promoter. (B) Schematics of experiment: mouse genome-scale dead-guide RNA library (mm10dgLib) design, including 15nt proximal promoter spacer identification, on-target and off-target mapping, scoring, filtering, and prioritization of final spacers (details in STAR Methods). (C) Schematics of genome-scale dgRNA library-based mouse primary CD8+ T cell kill assay activation screen (dgTKS) to identify genes that boost effector functions of CD8+ T cells. The main procedure includes naïve CD8+ T cell isolation, mm10dgLib transduction, a kill assay (CD8+ T cell degranulation, as measured by CD107a level in CD8 T cells in a T cell : cancer cell co-culture), CD8+;CD107a+ T cell sorting, genomic DNA preparation, dgRNA library readout, and dgRNAs enrichment. (D) Representative flow cytometry results of the kill assay in the dgTKS experiment. FACS gating plot showing the percentage of CD107a+ cells among all CD8+ cells in vector and mm10dgLib transduced CD8+ T cells co-culture with E0771 cancer cells pulsed with SIINFEKL peptide. (n = 3 biological replicates). Representative data from two independent experiments. (E) Quantification of CD107a in the mm10dgLib screen (n = 3 biological replicates). (F) Bulk screen scatterplot of dgTKS screen, showing relative dgRNA abundances in the entire mm10dgLib library, with CD107a+-high FACS sorted CD8+ T cells, as compared to unsorted T cells. Blue dots are NTCs; brown dots are scoring GTSs that passed FDR 0.1% cutoff, with gene name labeled; orange dots are scoring GTSs that passed FDR 0.2% cutoff but did not pass FDR 0.1%; grey dots are remaining GTSs. Black dashed line is a regression line of all data points. Blue dashed line is a regression line of 1,000 NTCs representing a neutral baseline. Regression parameters and p-values were shown. GTSs deviating from the baseline showed enrichment in the CD107a+-high FACS as compared to the behavior of NTCs. The points were shown at the individual gRNA level. Representative top scoring genes targeted by specific sgRNAs were shown. (G) Quantitative analysis of flow cytometry for kill assay for individual genes overexpressed by lentiviral vectors. (H) Mouse T cell number quantification at day 4 after IL-2 withdrawal. (n = 6 in total of one independent experiments). **P<0.01, ****P<0.0001 by multiple t tests (with adjusted P value) (E, G) or unpaired t tests (H). See also: Figure S1
Figure 2.
Figure 2.. PRODH2 engineering by genomic knock-in or lentiviral overexpression boosts cytotoxic activity of CAR-Ts against cognate cancer cells
(A) A schematic of human CD22-CAR;PRODH2 (PRODH2 KI CAR-T) and CD22-CAR;PRODH2(Stop) (PRODH2(Stop) KI CAR-T, Control CAR-T) cell generation. In the CD22-CAR;PRODH2(Stop) construct, three artificial pre-mature stop codons were inserted between 318–319bp position of the PRODH2 CDS to generate a truncated mutant version. Knock-in (KI) constructs consist of TRAC locus homology-directed repair (HDR) 5’ and 3’ arms, an EFS promoter, a CD22-CAR expression cassette, a T2A sequence, a PRODH2 or PRODH2(Stop) CDS, and a short polyA. AAV6-packaged KI constructs were introduced into T cells by viral transduction after TRAC first-exon targeting Cas9:crRNA RNP electroporation. (B) Representative flow cytometry plots of PRODH2 KI and control CAR-T cells before and after Flow Cytometry sorting. Representative data from two independent experiments. (C) Representative immunoblot for PRODH2 expression in untreated CD8 T cell (no CAR), CD22-CAR, CD22-CAR;PRODH2(Stop), and CD22-CAR;PRODH2 T cells. The red arrows indicated bands of predicted molecular sizes based on the antibody providers. Representative data from three independent experiments. (D) Flow analysis of PRODH2 KI and control CAR-T cell proliferation by Ki-67 staining. (E) Kill assay of purified PRODH2 KI and control CAR-T cells with NAML6-GL (NAML6 with GFP and Luciferase reporters) cancer cells, with a titration series of Effector : Target (E:T) ratios, and at two timepoints (24h and 48h). The timepoint of CAR T cells used for co-culture was day 67 after CAR KI. Individual replicate datapoints were shown (n = 4 biological replicates). Representative data from two independent experiments. (F) A schematic of human HER2-CAR;PRODH2 and HER2-CAR;PRODH2(Stop) CD8 T cell generation. HER2-CAR;PRODH2 and HER2-CAR;PRODH2(Stop) constructs were established by replacing CD22-CAR with HER2-CAR construct in CD22-CAR;PRODH2 and CD22-CAR;PRODH2(Stop) constructs. (G) Kill assay of HER2-CAR;PRODH2 and HER2-CAR;PRODH2(Stop) KI T cells with MCF7-PL and MDA-MB-231-PL (MCF7 and MDA-MB-231 cells expressed with Puromycin and Luciferase reporters) breast cancer cells, with a titration series of Effector : Target (E:T) ratios, and at two timepoints (24h and 48h). All CAR-T cells were used for co-culture at day 17 after CAR KI. Individual replicate datapoints were shown (n = 4 biological replicates). (H) A schematic of lentiviral CD22-CAR;PRODH2 (PRODH2-OE CAR-T) and CD22-CAR;PRODH2(Stop) (Control CAR-T) cell generation. (I) Kill assay of Lenti-CD22-CAR;PRODH2 (Stop) and Lenti-CD22-CAR;PRODH2 T cells with NALM6-GL (CD22high) cancer cells at day3 after lentiviral transduction. (n = 5 biological replicates). (J) A schematic of lentiviral BCMA-CAR;PRODH2 (PRODH2-OE BCMA CAR-T) and BCMA-CAR;PRODH2(Stop) (Control BCMA CAR-T) cell generation. (K) Kill assay of Lenti-BCMA-CAR;PRODH2 (Stop) and Lenti-BCMA-CAR;PRODH2 T cells with MM.1R-PL-BCMA-OE cancer cells at day3 after lentiviral transduction. (n = 5 biological replicates). *P<0.05, **P<0.01, ***P<0.001, ****P<0.0001, ns = not significant by multiple t tests (with adjusted P value) (E, G) or unpaired t tests (D, I, K). See also: Figure S1
Figure 3.
Figure 3.. PRODH2 engineering by genomic knock-in or lentiviral overexpression enhanced CAR-T in vivo efficacy in mouse models
(A) A schematic of the experimental design of leukemia model PRODH2 knock-in CAR-T efficacy testing, showing leukemia induction, CD22-CAR intravenously injection, survival, and bioluminescence imaging. CAR T cells were pre-stimulated with NALM6-GL-CD22OE cancer cells at an E:T ratio = 1:1 at day 25 before injection. (B) IVIS imaging showing bioluminescence of NSG mice which were injected with NALM6-GL-CD22OE cancer cells and with CD22-CAR therapy. Note: The dark shadow on the mouse at day 14 was induced by the imaging machine but has no influence on bioluminescence quantification. (C) Quantification of cancer burden by total luminescence. Green arrow indicated CAR-T injection was performed at day 4. (n = 6–8 mice/group). (D) A schematic of the experimental design of PRODH2 CAR-T efficacy testing in multiple myeloma models, showing induction, BCMA-CAR intravenously injection, and survival. (E) Survival curve of MM.1R induced myeloma bearing NSG mice after AAV-KI BCMA-CAR;PRODH2 or BCMA-CAR;PRODH2 (Stop) T cell adoptive transfer therapy. (CAR-T adoptive transfer indicated with a green arrow). (n = 5–7 mice/group). (F) Survival curve of BCMA-OE MM.1R induced myeloma bearing NSG mice after AAV-KI BCMA-CAR;PRODH2 or BCMA-CAR;PRODH2 (Stop) T cell adoptive transfer therapy. (CAR-T adoptive transfer indicated with a green arrow). (n = 4–6 mice/group). (G) IVIS imaging showing bioluminescence of multiple myeloma bearing NSG mice after lentiviral-based BCMA-CAR;PRODH2 or BCMA-CAR;PRODH2 (Stop) T cell adoptive transfer therapy. “X” represented dead or euthanized animals (Endpoint). (n = 5 mice/group). (H) Quantification of cancer burden by total luminescence for (G). CAR-T injection indicated with green arrows. *P<0.05, **P<0.01, ***P<0.001, ****P<0.0001 by two-way ANOVA (with multiple comparisons test) (C, H) or Log-rank (Mantel-Cox) tests (E, F). See also: Figure S1
Figure 4.
Figure 4.. Whole transcriptome profiling of PRODH2 knock-in CD22 CAR-T cells and FACS validation of enhanced effector function.
(A) A schematic of the experimental design of PRODH2 CAR-T mechanistic investigation: AAV- or lenti-based CAR-T generation, metabolomics, mRNA-seq, metabolic analysis, immunological analysis, TEM, and other experiments. (B) Volcano plots of mRNA-seq differential expression between PRODH2 vs. PRODH2(Stop) CD22-CAR-T cells from human donor (n = 3 biological replicates) (FDR adj. q < 0.001). CD22-CAR T cells were collected for RNA extraction and bulk mRNA-seq at day 25 after CAR knock-in. (C) GSEA individual pathways for mRNA-seq of PRODH2 knock-in CD22-CAR-T cells. GSEA plots of individual pathways from the representative up- and down-regulated gene sets between CD22-CAR;PRODH2 and CD22-CAR;PRODH2(Stop) T cell groups. (Cut-off criteria: p-value < 0.001) (D) Heatmaps of differentially expressed genes in representative pathways such as effector function, immune effector process, activated T cell proliferation, memory T cell and inhibitory marker. (E-F) Intracellular staining of effector function markers, IFNg, TNFa, and GZMB in both PRODH2 overexpressed CD22 CAR and control CD22 CAR T cells, without stimulation (E) or after 12h of NALM6-GL stimulation (F). See also: Figure S2 **P<0.01, ****P<0.0001, ns = not significant by unpaired t tests (E, F).
Figure 5.
Figure 5.. Metabolomic profiling and biochemical-immunological validation of PRODH2 GOF CAR-Ts
(A) Heatmap of the relative abundance of top 40 QTOF/QQQ detected metabolites of PRODH2 vs. PRODH2(Stop) CD22-CAR-T cells (n = 5 biological replicates). Representative data from two independent experiments. (B) Volcano plot of differentially represented (DR) metabolites between PRODH2 vs. PRODH2(Stop) CD22-CAR-T cells. Blue dots indicate decreased metabolites, pink dots indicate increased metabolites. (C) Schematic of biochemical-immunological validation of PRODH2 GOF CAR-Ts, including chemical compound treatment, co-culture and flow cytometry. CAR-T cells were supplied with extra L-proline (substrate for P4HA1 and P4HA2), 4-hydroxyproline (4Hyp, substrates for PRODH2), or 1,4-DPCA (inhibitor of P4HA1 and P4HA2), PF 04859989 (inhibitor of GOT1 and GOT2) before co-culture and flow cytometry analyses. (D) Timeline of CAR-T cell treated with L-Proline, 4Hyp, 1,4-DPCA, and PF 04859989, co-culture, and FACS. (E) Representative CAR KI percentages after 1st and 2nd cancer stimulations. Representative data from two independent experiments. (F) Substrate supplement experiment. Cytolytic activity measurement by co-culture of CD22-CAR;PRODH2 and CD22-CAR;PRODH2 (Stop) T cells with NALM6-GL-CD22OE cancer cells for 6h after T cells pre-treated with different concentration of L-Proline and 4Hyp. (G) P4HA enzymatic inhibition experiment. (Left) DPCA toxicity analysis. Cell viability measurement of CD22-CAR;PRODH2 and CD22-CAR;PRODH2 (Stop) T cells after treating with different concentration of 1,4-DPCA. (Right) Cytolytic activity measurement by co-culture of CD22-CAR;PRODH2 and CD22-CAR;PRODH2 (Stop) T cells with NALM6-GL-CD22OE cancer cells for 12h after T cells pre-treated with different concentration of 1,4-DPCA. (H) Representative flow plots of IFNg production of CD22-CAR;PRODH2 and CD22-CAR;PRODH2(Stop) T cells after 1,4-DPCA treatment and co-culture. T cells were pre-stimulated with NALM6-GL-CD22OE cancer cells for 8 days, then treated with the 1,4-DPCA inhibitor for 3 days. The co-culture E:T = 0.5:1. (n = 4 biological replicates) (I) Quantification of (H). (J) GOT enzymatic inhibition experiment. Cytolytic activity measurement by co-culture of CD22-CAR;PRODH2 and CD22-CAR;PRODH2 (Stop) T cells with NALM6-GL-CD22OE cancer cells for 24h after T cells pre-treated with PF04859989. *P<0.05, **P<0.01, ***P<0.001, ****P<0.0001, ns = not significant by multiple t tests (with adjusted P value) (G), two-way ANOVA and unpaired t tests (F, G, I, J).
Figure 6.
Figure 6.. Characterization of long-term mitochondria energetics of PRODH2 knock-in CAR-T cells
(A-D) TEM analysis of PRODH2 knock-in and Control CAR-T cells. TEM images were examined for mitochondrial numbers (A) (red arrows indicated mitochondria), mitochondrial fission (B) (red arrows indicated mitochondria fission), mitochondrial cristae remodeling (C) (red arrows indicated mitochondrial cristae), and granule numbers (D) (red arrows indicated granules). Scale bars, 5 μm (A), 1 μm (B, C (left image), D), and 2 μm (C, right image). Data from one experiment with independent replicates. (E) Quantification of mitochondria number per cells. (F) Quantification of individual mitochondria length. (G) Quantification of individual mitochondria area. (H) Quantification of granule number per cells. (I) Mitochondrial mass as measured by MitoTracker Green FM staining of indicated CAR-T cells at day 36 after stimulation with NALM6-GL-CD22OE cancer cells. (J-L) Seahorse experiment of PRODH2 knock-in and Control CAR-T cells, with a density of 2e5 CAR-T cells / well (n = 6). Data are representative of three independent experiments. (J) Oxygen consumption rate (OCR) was measured at baseline and in response to oligomycin (Oligo), FCCP, and rotenone plus antimycin A. (K) Relative maximum OCR and relative spare respiratory capacity (SRC) were quantified. (L) Extracellular acidification rate (ECAR) was measured at baseline and after drug treatment as the OCR measurement (n = 6). Representative data from three independent experiments. *P<0.05, **P<0.01, ****P<0.0001, ns = not significant by unpaired t tests (E-I, K) and two-way ANOVA (L). See also: Figure S6
Figure 7.
Figure 7.. PRODH2 promotes CAR T cell memory formation after cancer cell engagement in long term co-culture
(A) A schematic of the experimental design showing time-line of CAR KI, FACS sorting, cancer stimulation and flow analysis. CD22-CAR;PRODH2 and CD22-CAR;PRODH2(Stop) T cells were purified by FACS sorting at day 22 after CAR KI, then CAR T cells were stimulated with NALM6-GL-CD22OE cancer cells various times, each about every 12 days with a E:T ratio = 1:1. T cells stimulated different times were harvested for analysis at day 69. (B) Baseline expression of CD45RA and CD62L in CD22-CAR;PRODH2 and CD22-CAR;PRODH2(Stop) T cells analyzed at day 27. (C) CD45RA and CD62L expression in CD22-CAR;PRODH2 and CD22-CAR;PRODH2(Stop) T cells analyzed at day 69, stimulated either 2 or 3 times with NALM6-GL-CD22OE cancer cells. (hi = high expression, lo = low expression). (D) Time-line of cancer stimulation and flow cytometry. (E, F) Analysis of T cell memory in PRODH2 knock-in CAR-T cells after three times of cancer cell stimulation in long term co-culture. (E) Flow analysis and quantification of human T cell memory surface markers, CCR7, IL7R and CXCR3. (F) Flow analysis and quantification of human T cell memory transcription regulators, EOMES, TBX21, BCL6 and TCF7. **P<0.01, ***P<0.0001, ****P<0.0001 by unpaired t tests (C, E, F).

References

    1. Bengsch B, Johnson AL, Kurachi M, Odorizzi PM, Pauken KE, Attanasio J, Stelekati E, McLane LM, Paley MA, Delgoffe GM, et al. (2016). Bioenergetic Insufficiencies Due to Metabolic Alterations Regulated by the Inhibitory Receptor PD-1 Are an Early Driver of CD8(+) T Cell Exhaustion. Immunity 45, 358–373. - PMC - PubMed
    1. Bray NL, Pimentel H, Melsted P, and Pachter L (2016). Near-optimal probabilistic RNA-seq quantification. Nat Biotechnol 34, 525–527. - PubMed
    1. Brown CE, and Mackall CL (2019). CAR T cell therapy: inroads to response and resistance. Nat Rev Immunol 19, 73–74. - PubMed
    1. Buck MD, O'Sullivan D, Geltink RIK, Curtis JD, Chang CH, Sanin DE, Qiu J, Kretz O, Braas D, van der Windt GJW, et al. (2016). Mitochondrial Dynamics Controls T Cell Fate through Metabolic Programming. Cell 166, 63–76. - PMC - PubMed
    1. Chang CH, Curtis JD, Maggi LB Jr., Faubert B, Villarino AV, O'Sullivan D, Huang SC, van der Windt GJ, Blagih J, Qiu J, et al. (2013). Posttranscriptional control of T cell effector function by aerobic glycolysis. Cell 153, 1239–1251. - PMC - PubMed

Publication types

MeSH terms