. 2022 Mar 28;57(6):767-782.e6.
doi: 10.1016/j.devcel.2022.02.015. Epub 2022 Mar 10.

Integration of vascular progenitors into functional blood vessels represents a distinct mechanism of vascular growth

Affiliations

Integration of vascular progenitors into functional blood vessels represents a distinct mechanism of vascular growth

Sanjeeva Metikala et al. Dev Cell. .

Abstract

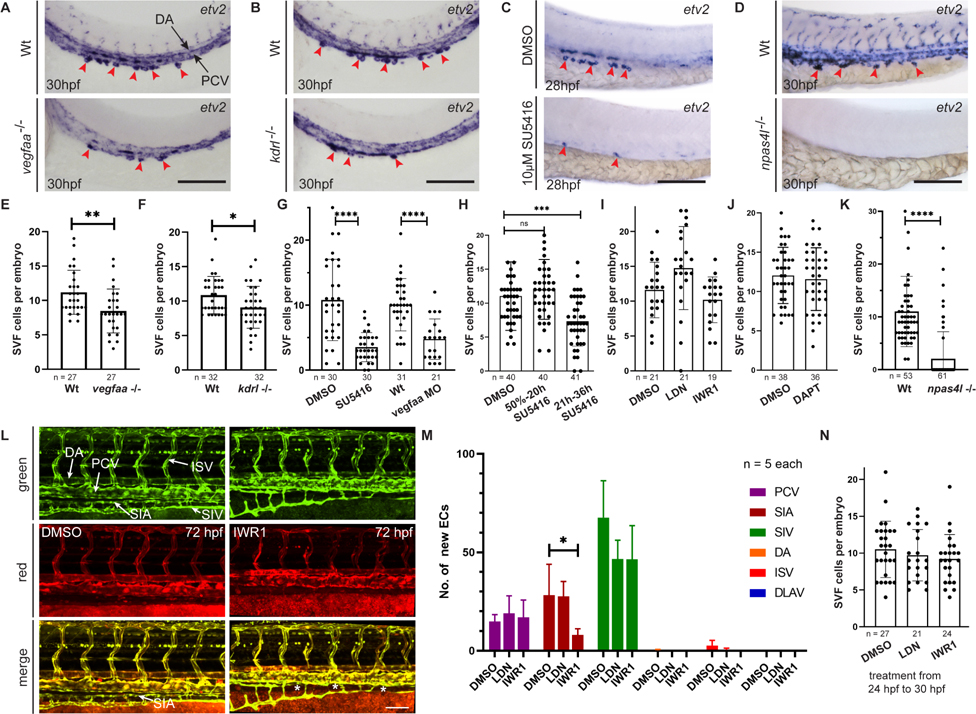
During embryogenesis, the initial vascular network forms by the process of vasculogenesis, or the specification of vascular progenitors de novo. In contrast, the majority of later-forming vessels arise by angiogenesis from the already established vasculature. Here, we show that new vascular progenitors in zebrafish embryos emerge from a distinct site along the yolk extension, or secondary vascular field (SVF), incorporate into the posterior cardinal vein, and contribute to subintestinal vasculature even after blood circulation has been initiated. We further demonstrate that SVF cells participate in vascular recovery after chemical ablation of vascular endothelial cells. Inducible inhibition of the function of vascular progenitor marker etv2/etsrp prevented SVF cell differentiation and resulted in the defective formation of subintestinal vasculature. Similar late-forming etv2+ progenitors were also observed in mouse embryos, suggesting that SVF cells are evolutionarily conserved. Our results characterize a distinct mechanism by which new vascular progenitors incorporate into established vasculature.

Keywords: ER71; Etsrp; Etv2; blood vessel; mouse; progenitors; vascular endothelium; vasculogenesis; zebrafish.


Conflict of interest statement

Declaration of interests The authors declare no competing interests.

Figures

Figure 1.
Figure 1.. New endothelial cells contribute to blood vessels after 24 hpf:
(A-U) TgBAC(etv2:Kaede) and Tg(fli1a:Kaede) embryos were photo-converted from green to red at 24 hpf. New vascular endothelial cells were observed in the trunk region at 48 and 72 hpf in the PCV (orange insets, B-D,I-K), SIV (blue insets, E-G,L-N,S-U) and SIA (magenta inset, P-R). White arrowheads show selected VECs which are green only and do not have red Kaede fluorescence. Maximum intensity projections of confocal z-stack images are shown except for magnified insets which show a projection of limited number of z planes. Individual green and red channels for panels A,H,O are shown in Suppl. Figure S1C. (V,W) Quantification of new green only VECs using Tg(fli1a:Kaede) embryos at 48 and 72 hpf respectively. 10 out of 10 embryos showed both green only and green + red cells. Mean ± s.d. Each data point represents the number of green only cells per embryo. Data from 4 independent experiments. PCV, posterior cardinal vein; DA, dorsal aorta; ISV, inter-segmental vessels; SIV, subintestinal vein; SIA, supraintestinal artery. Scale bars: 100 μm.
Figure 2.
Figure 2.. etv2 and tal1 expression in the presumptive secondary vascular field (SVF):
(A) Whole-mount in situ hybridization (WISH) in wild-type (wt) embryos showing etv2 expression from 24 to 36 hpf. Cells with strong etv2 expression were observed in the trunk region, positioned bilaterally along the yolk extension (red arrowheads). Weaker etv2 expression was also observed in the established vasculature including the DA, PCV, DLAV and ISVs. Dorso-lateral and ventral views of the same embryos are shown. (B) Quantification of SVF cells expressing etv2 from 23–54 hpf, mean ± s.d. Each data point represents the number of cells in a single embryo. Data from 2 independent experiments. (C) WISH in wt embryos showing tal1 expression from 24 to 36 hpf. Cells with strong tal1 expression were observed in the trunk, positioned bilaterally along the yolk extension (red arrowheads). In addition, tal1 is expressed in red blood cells and a subset of neurons within the spinal cord. Dorsolateral and ventral views of the same embryos are shown. (D) Quantification of SVF cells expressing tal1 from 24–48 hpf, mean ± s.d. Each data point represents the number of cells in a single embryo. Data from 2 independent experiments. (E) Fluorescent in situ hybridization (FISH) showing co-expression of etv2 and tal1 in SVF cells (white arrowheads). (F) FISH against etv2 (red) combined with the pronephric marker Tg(enpep:GFP) fluorescence (green) shows that SVF cells are positioned next to the pronephros in a zebrafish embryo at 30 hpf. Dorso-lateral and transverse confocal sections at selected points (p1, p2 and p3) are shown. (G) Transverse section diagram showing the position of SVF cells with respect to the pronephros and PCV at 30 hpf. (H) lmo2 and npas4l expression was observed in SVF cells (red arrowheads), while fli1a is expressed in vascular endothelial cells of the DA, PCV and ISV but not in SVF cells. PCV, posterior cardinal vein; DA, dorsal aorta; ISV, intersegmental vessels; DLAV, dorsal longitudinal anastomosing vessel. Scale bars: A, B: 100 μm, D: 50 μm, E: 25 μm, F: 25 μm, H: 100 μm.
Figure 3.
Figure 3.. SVF cells integrate into the posterior cardinal vein and contribute to the PCV and subintestinal vasculature:
(A) Time-lapse images of etv2Gt(2A-Venus)+/−; Tg(kdrl:mCherry) embryo showing multiple SVF cells integrating into the PCV (white arrowheads) between 24 and 40 hpf. Images also show proliferation of SVF cells after integrating into PCV (magenta and yellow arrowheads). New SVF progenitors emerging later during the imaging period are shown using asterisks. (B) High magnification time-lapse images of etv2Gt(2A-Venus)+/−; Tg(kdrl:mCherry) embryo showing the sequential steps of SVF cell integration into the PCV (white arrowheads) between 24 and 40 hpf. An SVF cell contacts PCV, followed by cell rearrangement in the PCV, SVF cell proliferation and integration into the PCV. SVF cells initially express only Venus followed by mCherry expression upon integration and proliferation. (C) Time-lapse images of etv2Gt(2A-Venus)+/−; Tg(kdrl:nls-mCherry) embryo showing SVF cells which either integrate into the PCV (white arrowheads) or contribute to the formation of SIV (blue arrowheads) and SIA (yellow arrowheads) between 24 and 70 hpf. (D) Contribution of SVF-derived cells to various vessels quantified from time-lapse imaging performed at 24–70 hpf. Complete data is shown in Table S1. Time is shown in minutes after 24 hpf. (E) The illustration shows SVF cell contribution to the PCV, SIV and SIA. Some SVF cells contribute to the PCV while others form a part of the SIV and SIA. Note that all three vessels have partial contributions from SVF cells, and the rest of the SIA and SIV are derived from non-SVF cells located in the PCV as it has been previously demonstrated (Hen et al., 2015 and Koenig et al., 2016). PCV, posterior cardinal vein; DA, dorsal aorta; ISV, intersegmental vessels; SIV, subintestinal vein; SIA, supraintestinal artery. Scale bars: A: 100 μm, B, C: 50 μm.
Figure 4.
Figure 4.. SVF cell contribution to vascular recovery after endothelial cell ablation requires etv2 and tal1 function:
(A-H) etv2Gt(2A-Gal4);UAS:GFP;UAS:mCherry-NTR heterozygous (A,B,E,F) and homozygous mutant (C,D,G,H) embryos were treated with MTZ from 50% epiboly to 45 hpf. Subsequently, MTZ was washed out and embryos were allowed to recover until 70 hpf. Note the complete ablation of etv2 expressing endothelial cells in MTZ treated embryos at 45 hpf compared to 0.1% DMSO treated control embryos (A,E). etv2Gt(2A-Gal4)−/−; UAS:GFP; UAS:mCherry-NTR mutant DMSO treated embryos showed severe vascular defects compared to etv2Gt(2A-Gal4)+/− heterozygous embryos at 45 and 70 hpf (A-D). Formation of new vascular cords at the position of the PCV and SIV was observed in the etv2Gt(2A-Gal4)+/− recovered embryos at 70 hpf (F), while no recovery was observed in etv2Gt(2A-Gal4)−/− mutant embryos (H). Individual green and red channels for treated and recovered embryos are shown in Suppl. Figure S3M–T. (I-L) Confocal images of etv2Gt(2A-Gal4)+/−; UAS:GFP;UAS:mCherry-NTR embryos injected with tal1 MO showing severe vascular defects at 45 and 70 hpf compared to uninjected controls. (M-P) etv2Gt(2A-Gal4)+/−;UAS:GFP;UAS:mCherry-NTR embryos were injected with tal1 MO at 1 cell stage and treated with MTZ from 50% epiboly to 45 hpf to ablate etv2 expressing endothelial cells. MTZ was washed out at 45 hpf and embryos were allowed to recover. tal1 morphants show significantly reduced vascular recovery. Individual green and red channels for treated and recovered embryos are shown in Suppl. Figure S3U–AB. (Q,R) WISH of embryos at 45 hpf showing expression of etv2 only in SVF cells in MTZ treated embryos (red arrowheads). (S) quantification of SVF cells in MTZ treated (n=45) and control DMSO treated embryos (n=36). (T,U) A percentage of embryos of etv2 mutant (T) and tal1 MO-injected embryos (U) showing no recovery (no EC), only 1–2 ECs, or partially formed blood vessels at the anatomical position of PCV (PCV-like) or at the positions of both PCV and SIV (SIV-like). Data from 2 independent experiments. PCV, posterior cardinal vein; DA, dorsal aorta; ISV, intersegmental vessels; DLAV, dorsal longitudinal anastomosing vessel; SIV, subintestinal vein; SIA, supraintestinal artery; EC, endothelial cell. Scale bars: 100 μm.
Figure 5.
Figure 5.. Loss of SVF cells results in defective subintestinal vasculature:
(A) Photoactivatable etv2 MO was injected in Tg(fli1a:Kaede) embryos followed by etv2 MO photoactivation at 22 hpf and Kaede photoconversion at 24 hpf. Embryos at 72 hpf show defective SIA formation (white arrowheads) and the presence of new VECs (yellow arrowheads). (B) Quantification of fully formed, partially formed or absent vessels in the trunk in control uninjected embryos (n=38) and etv2 morphants (n=38). (C) Quantification of tal1 expressing SVF cells at 30 hpf in etv2 morphants (n=54) and wt siblings (n=90). Each data point represents one embryo. (D) Quantification of new VECs in etv2 morphants (n=10) and uninjected control siblings (n=10) at 72 hpf. Mean ± s.d, **P=0.001, ****P<0.0001 (two-tailed unpaired t-test). Data from 4 independent experiments. PCV, posterior cardinal vein; DA, dorsal aorta; ISV, intersegmental vessels; DLAV, dorsal longitudinal anastomosing vessel; SIV, subintestinal vein; SIA, supraintestinal artery. Scale bars: 100 μm.
Figure 6.
Figure 6.. Analysis of VEGF, Wnt, BMP, Notch and npas4l requirement for the formation of SVF cells:
(A,B) Whole mount in situ hybridization (WISH) analysis for etv2 expression at 30 hpf in vegfaa−/− (A) or kdrl−/− mutants (B) and their wild-type siblings. Note the reduction in SVF cell number (red arrowheads) in vegfaa and kdrl mutant embryos. (C) WISH analysis for etv2 expression at 28 hpf in wild-type embryos treated with pan-Vegfr inhibitor, SU5416 and control DMSO treated embryos. (D) WISH analysis for etv2 expression at 30 hpf in npas4l−/− mutants and their wild-type siblings. SVF cells are shown using red arrowheads. (E,F) Quantification of SVF cells in wild-type and vegfaa−/− I or kdrl−/− (F) mutant embryos. (G) Quantification of SVF cells in SU5416 treated and vegfaa morpholino injected embryos and their respective controls. (H) Quantification of SVF cells at 30 hpf in wild-type embryos treated with SU5416 from 50% epiboly (5 hpf) to 20 hpf and 21 hpf to 30 hpf and DMSO treated controls. (I) Quantification of SVF cells at 30 hpf in embryos treated with BMP signaling inhibitor LDN193189 and Wnt signaling inhibitor IWR1 from 80% epiboly (8 hpf) to 30 hpf and DMSO treated controls. (J) Quantification of SVF cells at 30 hpf in embryos treated with Notch signaling inhibitor DAPT from 50% epiboly to 30 hpf and DMSO treated controls. (K) Quantification of SVF cells in wild-type siblings and npas4l−/− embryos. (L-N) Analysis of Wnt and BMP signaling requirement for the contribution of new VECs to the vasculature after 24 hpf in Tg(fli1a:Kaede) embryos. Kaede was photoconverted at 24 hpf and embryos were treated with IWR1 of LDN193189 from 24–48 hpf (L,M), washed and analyzed at 72 hpf. (N) Quantification of SVF cells in embryos treated from 24 hpf to 30 hpf and DMSO treated controls. Etv2 expression was analyzed by WISH at 30 hpf. (M) Confocal images of Tg(fli1a:Kaede) embryos at 72 hpf. Note the defective SIA formation in IWR1 treated embryos compared to DMSO treated controls (white arrow and asterisks). (N) Quantification of new green only VECs at 72 hpf. Note a significant reduction in the number of newly formed VECs in SIA in IWR1 treated embryos compared to DMSO treated controls. vegfaa−/− and kdrl−/− mutants were analyzed in 2 independent experiments, SU5416, vegfaa MO and npas4l−/− in 3 independent experiments, LDN193189 and IWR1 in 2 independent experiments. Note that wild-type siblings include a mixture of wild-type and heterozygous embryos in all experiments. Mean ± s.d, *P<0.05, **P<0.005, ***P<0.0005 and ****P<0.0001 (two-tailed unpaired t-test). Each data point represents one embryo. PCV, posterior cardinal vein; DA, dorsal aorta; ISV, intersegmental vessels. Scale bars: 100 μm.
Figure 7.
Figure 7.. Undifferentiated Etv2+ progenitors are present outside of the existing vasculature in the trunk region of murine embryos:
(A-G) Etv2-Venus reporter embryo at E10.5 stained to detect Venus (green), ERG (white) and PECAM (orange). (A) Sagittal view of 15 μm z-stack through the cardinal vein and developing subcardinal vein of a 28s mouse embryo showing Etv2-Venus positive cells (green) adjacent to mesonephros outside of the cardinal vein. (B-D) Corresponding expanded view (yellow box, A) of two Etv2-Venus positive cells that are negative for ERG and PECAM (yellow arrowheads, C). (E-G) Corresponding expanded view (red box, A) of four Etv2-Venus positive cells (green) that are positive for ERG (white) but negative for PECAM (orange) (yellow arrowheads, G). (H-K) Etv2T2A-CreERT2/+ males were mated with homozygous Ai9 reporter females and treated with tamoxifen at E9.5. Embryos were collected at E10.5 and stained to detect ERG (white) and tdTomato (turquoise). (H) Sagittal view of 15 μm z-stack through the cardinal vein and developing subcardinal vein of a 35s mouse embryo. (I-K) Corresponding expanded view (yellow box, H) of two tdTomato positive cells, (yellow arrowheads) directly ventral to the cardinal vein that are ERG negative. tdTomato positive cells which are incorporated into existing vasculature express ERG (red arrowheads, I-K).

Similar articles

Cited by

References

    1. Asahara T, Murohara T, Sullivan A, Silver M, Van Der Zee R, Li T, Witzenbichler B, Schatteman G, and Isner JM (1997). Isolation of putative progenitor endothelial cells for angiogenesis. Science (80-. ). 275, 964–967. - PubMed
    1. Asakawa K, Suster ML, Mizusawa K, Nagayoshi S, Kotani T, Urasaki A, Kishimoto Y, Hibi M, and Kawakami K (2008). Genetic dissection of neural circuits by Tol2 transposon-mediated Gal4 gene and enhancer trapping in zebrafish. Proc. Natl. Acad. Sci. U. S. A 105, 1255–1260. - PMC - PubMed
    1. Auer TO, Duroure K, De Cian A, Concordet JP, and Del Bene F (2014). Highly efficient CRISPR/Cas9-mediated knock-in in zebrafish by homology-independent DNA repair. Genome Res. 24, 142–153. - PMC - PubMed
    1. Bahary N, Goishi K, Stuckenholz C, Weber G, Leblanc J, Schafer CA, Berman SS, Klagsbrun M, and Zon LI (2007). Duplicate VegfA genes and orthologues of the KDR receptor tyrosine kinase family mediate vascular development in the zebrafish. Blood 110, 3627–3636. - PMC - PubMed
    1. Beis D, and Stainier DYR (2006). In vivo cell biology: following the zebrafish trend. Trends Cell Biol. 16, 105–112. - PubMed

Publication types

Substances

LinkOut - more resources