. 2022 May 18;110(10):1656-1670.e12.
doi: 10.1016/j.neuron.2022.02.010. Epub 2022 Mar 10.

Excessive release of inorganic polyphosphate by ALS/FTD astrocytes causes non-cell-autonomous toxicity to motoneurons

Affiliations

Excessive release of inorganic polyphosphate by ALS/FTD astrocytes causes non-cell-autonomous toxicity to motoneurons

Cristian Arredondo et al. Neuron. .

Abstract

Non-cell-autonomous mechanisms contribute to neurodegenerative diseases such as amyotrophic lateral sclerosis (ALS) and frontotemporal dementia (FTD), in which astrocytes release unidentified factors that are toxic to motoneurons (MNs). We report here that mouse and patient iPSC-derived astrocytes with diverse ALS/FTD-linked mutations (SOD1, TARDBP, and C9ORF72) display elevated levels of intracellular inorganic polyphosphate (polyP), a ubiquitous, negatively charged biopolymer. PolyP levels are also increased in astrocyte-conditioned media (ACM) from ALS/FTD astrocytes. ACM-mediated MN death is prevented by degrading or neutralizing polyP in ALS/FTD astrocytes or ACM. Studies further reveal that postmortem familial and sporadic ALS spinal cord sections display enriched polyP staining signals and that ALS cerebrospinal fluid (CSF) exhibits increased polyP concentrations. Our in vitro results establish excessive astrocyte-derived polyP as a critical factor in non-cell-autonomous MN degeneration and a potential therapeutic target for ALS/FTD. The CSF data indicate that polyP might serve as a new biomarker for ALS/FTD.

Keywords: ALS; C9ORF72; CSF; FTD; SOD1; TARDBP; astrocytes; iPSCs; motor neurons; polyP.


Conflict of interest statement

Declaration of interests The authors declare that based on the polyP data presented here, we are in the process of filing for a diagnosis and treatment patent application (PCT).

Figures
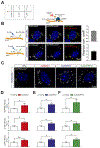
Figure 1.
Figure 1.. Intracellular polyP level is elevated in primary mutSOD1, mutTDP43 and mutC9ORF72 mouse ALS/FTD astrocytes
(A) Schematic of polyP (n=10-1000). (B) Schematics of the recPPBD immunostaining assay and dyes DAPI-polyP and JC-D8 to detect polyP. Confocal images and Pearson’s correlation coefficients showing co-localization (yellow) of recPPBD (white/red) with DAPI-polyP (white/green) or JC-D8 (white/green) in mutSOD1 astrocytes. Nuclei (blue) are detected with DAPI-DNA or TOPRO3. Scale bar 10 μm. (C) Confocal images of mutSOD1, mutTDP43, mutC9ORF72 and non-transgenic littermate (NTg from mutSOD1 shown here) astrocytes stained with recPPBD and TOPRO3. Scale bar 10 μm. (D-F) Quantification of polyP levels in cytoplasm of mutSOD1 (D), mutTDP43 (E) and mutC9ORF72 (F) astrocytes, versus their NTg astrocytes, determined with recPPBD (upper graphs), JC-D8 (middle graphs) or DAPI-polyP (lower graphs). Graphs show mean±S.E.M. *P<0.05, **P<0,01; unpaired Student’s t-test versus NTg (n=3-4 cultures). See also Figures S1–4.
Figure 2.
Figure 2.. Primary mouse ALS/FTD astrocytes release higher levels of polyP, which is deposited on, or near to, neuronal plasma membranes
(A) Confocal images of synapsin-tdTomato-expressing spinal cord neurons (red) stained with JC-D8 (white) showing increased polyP deposition on, or in proximity to, neuronal membranes (arrows: MNs) when treated with mutSOD1-ACM, mutTDP43-ACM, mutC9ORF72-ACM or synthetic polyP (50 μM polyPL) versus ACMs from controls (NTg-ACM, Ctrl-medium). Scale bar 10 μm. (B) Quantification of JC-D8 fluorescence after applying the ACMs and controls, as indicated (mean±S.E.M. *P<0.05, **P<0.01; unpaired Student’s t-test; n=3 cultures). (C) Confocal images showing immunofluorescence for MAP2 (blue), SMI32 (green) and ChAT (red) in ventral spinal cord cultures. All 3 neuronal markers co-localize (white arrows); while ChAT and SMI32 can be used to identify MNs, MAP2 can detect INs (yellow arrowheads). Scale bar 20 μm. (D-E) Confocal images for the polyP probe recPPBD (white), for the IN marker MAP2 (blue), and for the MN markers ChAT (red) (D) or SMI32 (green). Scale bar 10 μm. (E). Images and quantification show an equal deposition of polyP on, or near, membranes of MNs (ChAT+ or SMI32+; white arrows) and INs (MAP2+ only; yellow arrowheads) when treated with mutSOD1-ACM (mean±S.E.M. *P>0.05 (not significant, ns); unpaired Student’s t-test MN versus IN). (F-G) P/C-extracted polyP from NTg-ACM or mutSOD1-ACM, either digested by recPPX/PPase and polyP-Pi levels colorimetrical quantified by malachite (F), or not digested to fluorometrical measure polyP-polymer levels by JC-D8 (G) (mean±S.E.M. **P<0.01; unpaired Student’s t-test; n=3-4 independent ACM analyzed in duplicate). See also Figure S5.
Figure 3.
Figure 3.. PolyP is enriched in spinal cord sections of ALS/FTD mouse models
(A-C) Confocal images for recPPBD (white) with MN (ChAT, red) (A), neuronal (NeuN, red) (B), and astrocyte (GFAP, green) (C) markers in lumbar (4-6) ventral lumbar spinal cords of NTg and mutSOD1 mice. Scale bar 20 μm. Lower images/insets: higher magnification images showing recPPBD-immunoreactive puncta in ChAT, NeuN-, and GFAP-positive cells in mutSOD1 sections. Insets: scale bar 10 μm. For the low-magnification images in A, the dashed lines indicate the borders between the gray and white matters. Arrowheads in C indicate small GFAP-negative cells, potentially microglial. (D-F) Quantification of recPPBD fluorescence in cytoplasm of GFAP- (D1,E1,F1) and NeuN-positive cells (D2,E2,F2) in sections from mutSOD1 (D), mutC9ORF72 (E), and mutTDP43 (F) mice and each corresponding NTg. Graphs show mean±S.E.M. **P<0.01; unpaired Student’s t-test versus NTg (n=3-4 animals). See also Figures S6–8.
Figure 4.
Figure 4.. Application of synthetic polyP to wild-type spinal cord neurons reproduces the toxicity effect of mutSOD1-ACM
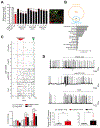
(A) Fewer MNs (SMI32+/MAP2+ cells; white arrow) found in 7 DIV spinal cord cultures treated (4 days) with mutSOD1-ACM or synthetic polyP versus controls (NTg-ACM and wtSOD1-ACM) as indicated (n=3 cultures). (B) Venn diagram and functional annotation analysis of the 97 commonly expressed transcripts in spinal cord cultures: polyPL versus wtSOD1-ACM and mutSOD1-ACM versus wtSOD1-ACM. (C-D) Representative calcium activity fingerprint (C) and whole-cell patch-clamp recordings (D) showing in individual cells that polyPL (100 μM) and mutSOD1-ACM increase intracellular Ca2+ transients and spontaneous AP firing, respectively. KCl (50 mM) induces Ca2+ rises in all cells. Graphs show mean±S.E.M. *P<0.05, **P<0.01, and ***P<0.001; one-way ANOVA (A,C) and paired Student’s t-test (D) versus controls (NTg-ACM, Ctr-medium or wtSOD1-ACM). See also Figures S9–10.
Figure 5.
Figure 5.. Reducing polyP in ALS astrocytes, or targeting polyP in ALS/FTD-ACM, prevents MN death and restores intracellular Ca2+ transients
(A) Expression of PPX1 in mutSOD1 astrocytes (using AAV9-PPX-GFP or AAV9-PPX-PLong-GFP) lowers toxicity of mutSOD1-ACM to MNs. (B-E) Treatment with the polyP degrading enzymes recPPX/PPase or CIP (B), or with the polyP neutralizing molecules recPPBD (but not BSA) (C), G4-PAMAM-NH2 (D), or UHRA9/10 (E) rescues MNs from mutSOD1-ACM and polyPL (100 μM). Schematics of the different polyP sequestering molecules are depicted. (F-J) Application of UHRA10 to mutSOD1-ACM (F), mutTDP43-ACM (G-H) or mutC9ORF72-ACM (I-J) reduces MN death (G,I) and Ca2+ transients (F,H,J). Graphs show means±S.E.M. **P<0.01, and ***P<0.001; one-way ANOVA versus controls (NTg-ACM or Ctrl-medium). #P<0.05, ##P<0.01, and ###P<0.001; one-way ANOVA versus mutSOD1-ACM or polyPL (n=3 cultures). See also Figure S11.
Figure 6.
Figure 6.. PolyP levels are elevated in mutTDP43 patient iPSC-derived astrocytes and degrading polyP in mutTDP43-ACM prevents MN death.
(A) Mature astrocytes were generated from iPSCs derived from an ALS/FTD TDP43 A90V patient (mutTDP43) and a healthy control subject (control). Confocal images for recPPBD (white), Nucblue (blue), phalloidin (pink) and mature astrocyte marker s100β (red). Scale bar 10 μm. (B) Quantification of cytoplasmic polyP levels of individual human control and mutTDP43 astrocytes determined with recPPBD (mean±S.E.M. ***P<0.001; unpaired Student’s t-test mutTDP43 versus control; ≥20 cells/condition from 2 independent differentiations). (C) Treatment with of mutTDP43-ACM with the polyP degrading enzymes recPPX/PPase or CIP rescues MNs from death (means±S.E.M. ***P<0.001; one-way ANOVA versus controls control-ACM. ###P<0.001; one-way ANOVA versus mutTDP43-ACM (n=3 cultures). (D) P/C-extracted polyP-polymer from control-ACM and mutTDP43-ACM fluorometrical quantified by JC-D8 (mean±S.E,M. *P<0.05; unpaired Student’s t-test; n=4 from two independent differentiations). See also Figure S12.
Figure 7.
Figure 7.. PolyP level is higher in postmortem spinal cord tissues and CSF from fALS and sALS patients.
(A-B) Representative immunohistochemistry micrographs for recPPBD in spinal cords from control (A) and ALS (C9ORF72) (B) subjects. In ALS, magnifications show recPPBD-immunoreactivity in glial-like cells (box#1, red arrows) and smaller MN-like cells (box#2). Scale bar 50 μm (main) and 10 μm (boxes). (C-D) Quantification of recPPBD-immunoreactivity in cytoplasm of glial-like (C) and MN-like (D) cells from control (n=5) and ALS (n=9) tissues. Graphs show mean±S.E.M. *P<0.05; Mann-Whitney U-test versus control. (E) Soma area (y-axis) versus number (x-axis) of MN-like cells. (F) Silica extracted polyP from the CSF of healthy control subjects (Ctrl, n=15) and ALS patients (n=16) and colorimetrical quantified as Pi by malachite (mean±S.E.M. **P<0.01; unpaired two-tailed St6udent’s t-test). See also Figures S13–14.

Comment in

References

    1. Abramov AY, Fraley C, Diao CT, Winkfein R, Colicos MA, Duchen MR, French RJ, and Pavlov E (2007). Targeted polyphosphatase expression alters mitochondrial metabolism and inhibits calcium-dependent cell death. Proc. Natl. Acad. Sci 104, 18091–18096. - PMC - PubMed
    1. Almeida S, Zhang Z, Coppola G, Mao W, Futai K, Karydas A, Geschwind MD, Tartaglia MC, Gao F, Gianni D, et al. (2012). Induced Pluripotent Stem Cell Models of Progranulin-Deficient Frontotemporal Dementia Uncover Specific Reversible Neuronal Defects. Cell Rep. 2, 789–798. - PMC - PubMed
    1. Andreeva N, Ledova L, Ryazanova L, Tomashevsky A, Kulakovskaya T, and Eldarov M (2019). Ppn2 endopolyphosphatase overexpressed in Saccharomyces cerevisiae: Comparison with Ppn1, Ppx1, and Ddp1 polyphosphatases. Biochimie 163, 101–107. - PubMed
    1. Angelova PR, Agrawalla BK, Elustondo PA, Gordon J, Shiba T, Abramov AY, Chang Y-T, and Pavlov EV (2014). In Situ Investigation of Mammalian Inorganic Polyphosphate Localization Using Novel Selective Fluorescent Probes JC-D7 and JC-D8. ACS Chem. Biol 9, 2101–2110. - PubMed
    1. Angelova PR, Iversen KZ, Teschemacher AG, Kasparov S, Gourine AV, and Abramov AY (2018). Signal transduction in astrocytes: Localization and release of inorganic polyphosphate. Glia 66, 2126–2136. - PMC - PubMed

Publication types