

The Impact of a High-Carbohydrate/Low Fat vs. Low-Carbohydrate Diet on Performance and Body Composition in Physically Active Adults: A Cross-Over Controlled Trial
- PMID: 35276780
- PMCID: PMC8838503
- DOI: 10.3390/nu14030423
The Impact of a High-Carbohydrate/Low Fat vs. Low-Carbohydrate Diet on Performance and Body Composition in Physically Active Adults: A Cross-Over Controlled Trial
Abstract
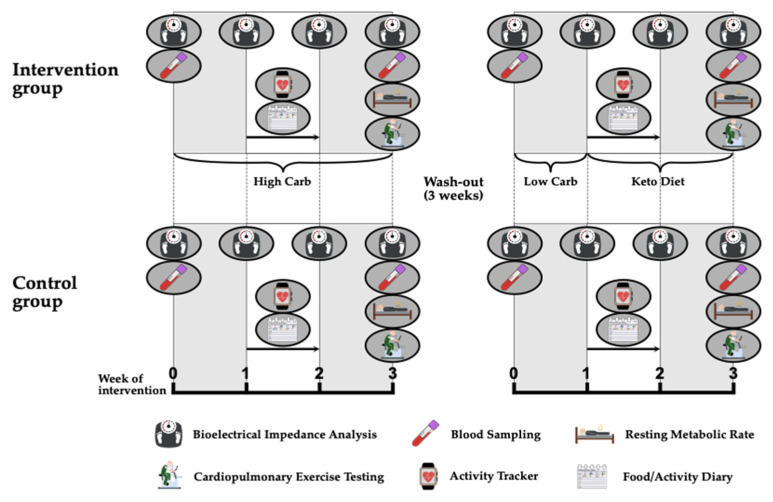
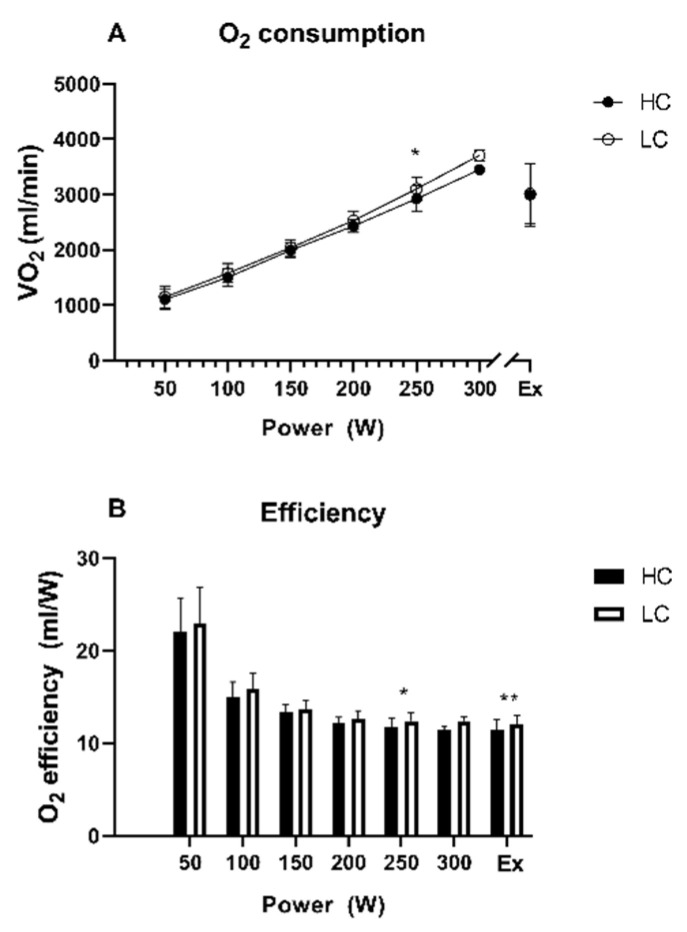
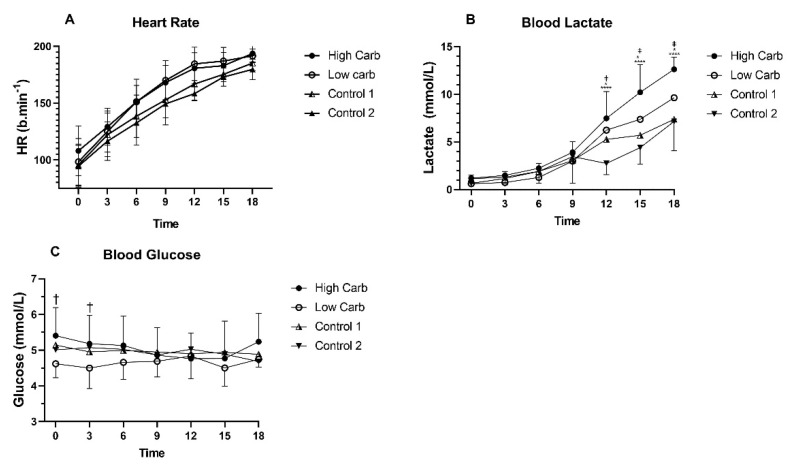
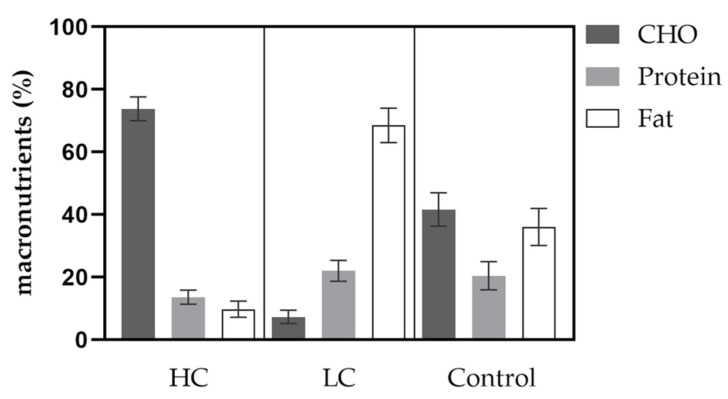
Background: Recently, high-carbohydrate or low-carbohydrate (HC/LC) diets have gained substantial popularity, speculated to improve physical performance in athletes; however, the effects of short-term changes of the aforementioned nutritional interventions remain largely unclear. Methods: The present study investigated the impact of a three-week period of HC/low-fat (HC) diet followed by a three-week wash-out-phase and subsequent LC diet on the parameters of physical capacity assessed via cardiopulmonary exercise testing, body composition via bioimpedance analysis and blood profiles, which were assessed after each of the respective diet periods. Twenty-four physically active adults (14 females, age 25.8 ± 3.7 years, body mass index 22.1 ± 2.2 kg/m2), of which six participants served as a control group, were enrolled in the study. Results: After three weeks of each diet, VO2peak was comparable following both interventions (46.8 ± 6.7 (HC) vs. 47.2 ± 6.7 mL/kg/min (LC; p = 0.58)) while a significantly higher peak performance (251 ± 43 W (HC) vs. 240 ± 45 W (LC); (p = 0.0001), longer time to exhaustion (14.5 ± 2.4 min (HC) vs. 14.1 ± 2.4 min (LC); p = 0.002) and greater Watt/kg performance (4.1 ± 0.5 W/kg (HC) vs. 3.9 ± 0.5 W/kg (LC); p = 0.003) was demonstrated after the HC diet. In both trial arms, a significant reduction in body mass (65.2 ± 11.2 to 63.8 ± 11.8 kg (HC) vs. 64.8 ± 11.6 to 63.5 ± 11.3 kg (LC); both p < 0.0001) and fat mass (22.7% to 21.2%; (HC) vs. 22.3% to 20.6% (LC); both p < 0.0001) but not in lean body mass or skeletal muscle mass was shown when compared to baseline. Resting metabolic rate was not different within both groups (p > 0.05). Total cholesterol and LDL-cholesterol significantly decreased after the HC diet (97.9 ± 33.6 mg/dL at baseline to 78.2 ± 23.5 mg/dL; p = 0.02) while triglycerides significantly increased (76 ± 38 mg/dL at baseline to 104 ± 44 mg/dL; p = 0.005). Conclusion: A short-term HC and LC diet showed improvements in various performance parameters in favor of the HC diet. Some parameters of body composition significantly changed during both diets. The HC diet led to a significant reduction in total and LDL-cholesterol while triglycerides significantly increased.
Keywords: body composition; high-carb diet; low-carb diet; metabolism; physical activity.
Conflict of interest statement
The authors do not declare any conflicts of interest in relation to this study.
Figures
References
Publication types
MeSH terms
Substances
LinkOut - more resources
Full Text Sources
Medical
