. 2022 Jan 27;14(3):547.
doi: 10.3390/nu14030547.

Dietary Alaska Pollack Protein Induces Acute and Sustainable Skeletal Muscle Hypertrophy in Rats

Affiliations

Dietary Alaska Pollack Protein Induces Acute and Sustainable Skeletal Muscle Hypertrophy in Rats

Kenji Uchida et al. Nutrients. .

Abstract

Our previous studies suggested that Alaska pollack protein (APP) intake increases skeletal muscle mass and that it may cause a slow-to-fast shift in muscle fiber type in rats fed a high-fat diet after 56 days of feeding. In this study, we explored whether dietary APP induces acute and sustainable skeletal muscle hypertrophy in rats fed a normal-fat diet. Male 5-week-old Sprague-Dawley rats were divided into four groups and fed a purified ingredient-based high-fat diet or a purified ingredient-based normal-fat diet with casein or APP, containing the same amount of crude protein. Dietary APP significantly increased gastrocnemius muscle mass (105~110%) after 2, 7 days of feeding, regardless of dietary fat content. Rats were separated into two groups and fed a normal-fat diet with casein or APP. Dietary APP significantly increased gastrocnemius muscle mass (110%) after 56 days of feeding. Dietary APP significantly increased the cross-sectional area of the gastrocnemius skeletal muscle and collagen-rich connective tissue after 7 days of feeding. It decreased the gene expression of Mstn /Myostatin, Trim63/MuRF1, and Fbxo32/atrogin-1, but not other gene expression, such as serum IGF-1 after 7 days of feeding. No differences were observed between casein and APP groups with respect to the percentage of Type I, Type IIA, and Type IIX or IIB fibers, as determined by myosin ATPase staining after 7 days of feeding. In the similar experiment, the puromycin-labeled peptides were not different between dietary casein and APP after 2 days of feeding. These results demonstrate that APP induces acute and sustainable skeletal muscle hypertrophy in rats, regardless of dietary fat content. Dietary APP, as a daily protein source, may be an approach for maintaining or increasing muscle mass.

Keywords: fish protein; muscle fiber type; protein source; rat; skeletal muscle.


Conflict of interest statement

F.K. and K.H. are former employees of Nippon Suisan Kaisha Ltd., and K.U. is a current employee of Nippon Suisan Kaisha Ltd. The funders had no role in the design of the study; in the collection, analyses, or interpretation of data; in the writing of the manuscript, or in the decision to publish the results.

Figures

Figure 1
Figure 1
Effects of APP on the final body mass, body mass gain and food intake. The final body mass (A), body mass gain (B), and food intake (C) of normal-fat-casein (NF-Cas) group, normal-fat-APP (NF-APP) group, high-fat-Cas (HF-Cas) group, and high-fat-APP (HF-APP) group after 2 days of feeding (n = 8/group) and 7 days feeding (n = 9/group) in experiment 1, and the final body mass (D), body mass gain (E), and food intake (F) NF-Cas group and NF-APP group after 7 days of feeding (n = 10/group) and 56 days feeding (n = 10/group) in experiment 2, are shown. Data are expressed as the mean ± standard error (SEM). Statistical analyses were performed using three-way ANOVA with Bonferroni post hoc significance testing in experiment 1, and two-way ANOVA with Bonferroni post hoc significance testing in experiment 2. Asterisks indicate significant differences compared to NF-Cas group, and number signs indicate significant differences compared to HF-Cas group (# p < 0.05). Protein, effect of protein source; Fat, effect of fat content; Days, effect of feeding period; Protein × Fat, interaction between protein source and fat content; Prorein × Days, interaction between protein source and feeding period; Fat × Day, interaction between fat content and feeding period; Protein × Fat × Day, interaction between protein source, fat content and feeding period; ns, not significant.
Figure 2
Figure 2
Effects of APP on the skeletal muscle mass. The soleus (A), gastrocnemius (B), and extensor digitorum longus (EDL) (C) of the normal-fat-casein (NF-Cas) group, the normal-fat-APP (NF-APP) group, the high-fat-Cas (HF-Cas) group, and the high-fat-APP (HF-APP) group after 2 days of feeding (n = 8/group) and 7 days feeding (n = 9/group) in experiment 1, and the soleus (D), gastrocnemius (E), and extensor digitorum longus (EDL) (F) of the NF-Cas group and NF-APP group after 7 days of feeding (n = 10/group) and 56 days feeding (n = 10/group) in experiment 2 are shown. Data are expressed as the mean ± standard error (SEM). Statistical analyses were performed using three-way ANOVA with Bonferroni post hoc significance testing in experiment 1, and two-way ANOVA with Bonferroni post hoc significance testing in experiment 2. Asterisks indicate significant differences compared to the NF-Cas group (* p < 0.05), and a number signs indicate significant differences compared to HF-Cas group (# p < 0.05). Protein, effect of protein source; Fat, effect of fat content; Days, effect of feeding period; Protein × Fat, interaction between protein source and fat content; Protein × Days, interaction between protein source and feeding period; Fat × Day, interaction between fat content and feeding period; Protein × Fat × Day, interaction between protein source, fat content and feeding period; ns, not significant.
Figure 3
Figure 3
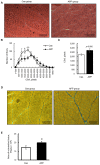
The cross-sectional area (CSA) in muscle fibers and connective tissue in the gastrocnemius muscle of rats fed a normal-fat casein diet or a normal-fat Alaska pollack protein (APP) diet after 7 days of feeding. Transverse sections stained with hematoxylin-eosin (A), distribution of CSA (B), and mean fiber CSA (C) in the gastrocnemius muscle of normal-fat casein diet group (Cas, n = 7) and normal-fat APP diet group (APP, n = 7) and transverse sections stained with Azan (D) and the average area of connective tissue (E) in the gastrocnemius muscle of normal-fat casein diet group (Cas, n = 8) and normal-fat APP diet group (APP, n = 8) are shown. Data are expressed as the mean ± standard error (SEM). Asterisks indicate significant differences relative to the Cas group, as determined using Student’s t-test. (*, p < 0.05; **, p < 0.01).
Figure 4
Figure 4
Muscle fiber composition in the gastrocnemius of rats fed a normal-fat casein diet or a normal-fat Alaska pollack protein (APP) diet after 7 days of feeding. Representative transverse sections stained with myosin ATPase preincubated at pH 4.7 (A) and percentages of the fiber types (B) in the gastrocnemius muscle of normal-fat casein diet group (Cas, n = 3) and normal-fat APP diet group (APP, n = 4) after 7 days of feeding are shown. Dark and light fibers are types I and II, respectively. Data are expressed as the mean ± standard error (SEM). Statistical analysis was performed using Student’s unpaired t-test.
Figure 5
Figure 5
The gene expression of Igf1 in liver and serum concentration of IGF-1 of rats fed a normal-fat casein diet or a normal-fat Alaska pollack protein (APP) diet after 7 days of feeding. The gene expression of Igf1 in liver (A) and serum concentration of IGF-1 (B) in normal-fat casein diet group (Cas, n = 12) and normal-fat APP diet group (APP, n = 12) after 7 days of feeding are shown. Data are expressed as the mean ± standard error (SEM). Statistical analysis was performed using Student’s unpaired t-test.
Figure 6
Figure 6
The rates of protein synthesis in the gastrocnemius muscle of rats fed a normal-fat casein diet or a normal-fat Alaska pollack protein (APP) diet after 2 days of feeding. Representative images of Western blot analysis for puromycin-labeled peptides are shown (COX IV is shown as a loading control) (A). The rate of protein synthesis in the gastrocnemius muscle of normal-fat casein diet group (Cas, n = 5) and normal-fat APP diet group (APP, n = 5) after 2 days of feeding are shown (B). Data are expressed as the mean ± standard error (SEM). Statistical analysis was performed using Student’s unpaired t-test.

Similar articles

Cited by

References

    1. Wolfe R.R. The underappreciated role of muscle in health and disease. Am. J. Clin. Nutr. 2006;84:475–482. doi: 10.1093/ajcn/84.3.475. - DOI - PubMed
    1. Koopman R., Ly C.H., Ryall J.G. A metabolic link to skeletal muscle wasting and regeneration. Front. Physiol. 2014;5:32. doi: 10.3389/fphys.2014.00032. - DOI - PMC - PubMed
    1. Van Wessel T., De Haan A., Van Der Laarse W.J., Jaspers R.T. The muscle fiber type-fiber size paradox: Hypertrophy or oxidative metabolism? Eur. J. Appl. Physiol. 2010;110:665–694. doi: 10.1007/s00421-010-1545-0. - DOI - PMC - PubMed
    1. Anthony J.C., Anthony T.G., Layman D.K. Leucine supplementation enhances skeletal muscle recovery in rats following exercise. J. Nutr. 1999;129:1102–1106. doi: 10.1093/jn/129.6.1102. - DOI - PubMed
    1. Lim C.H., Gil J.H., Quan H., Viet D.H., Kim C.K. Effect of 8-week leucine supplementation and resistance exercise training on muscle hypertrophy and satellite cell activation in rats. Physiol. Rep. 2018;6:e13725. doi: 10.14814/phy2.13725. - DOI - PMC - PubMed

Substances