. 2022 Jan 29;14(3):594.
doi: 10.3390/nu14030594.

Long-Term Consumption of a Sugar-Sweetened Soft Drink in Combination with a Western-Type Diet Is Associated with Morphological and Molecular Changes of Taste Markers Independent of Body Weight Development in Mice

Affiliations

Long-Term Consumption of a Sugar-Sweetened Soft Drink in Combination with a Western-Type Diet Is Associated with Morphological and Molecular Changes of Taste Markers Independent of Body Weight Development in Mice

Barbara Lieder et al. Nutrients. .

Abstract

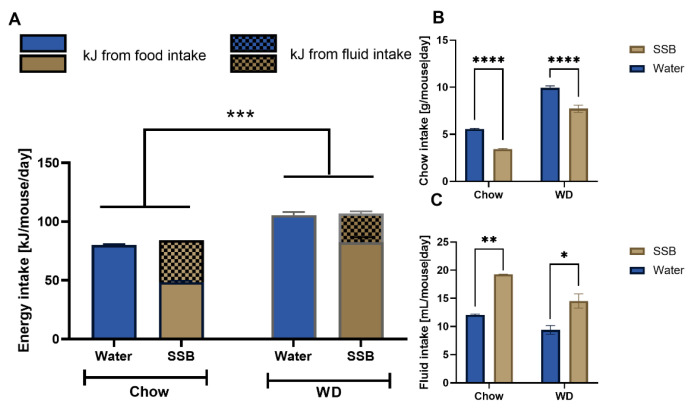
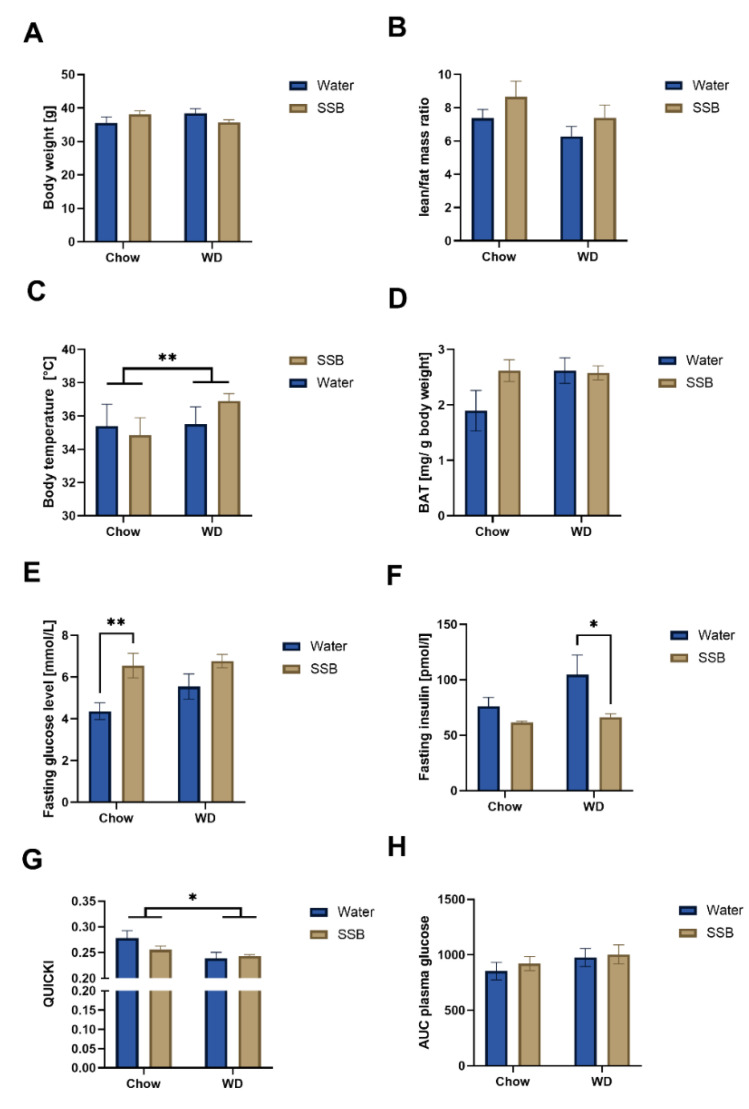
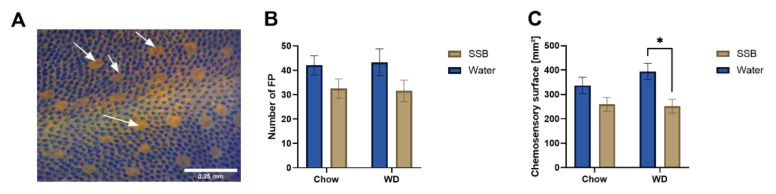
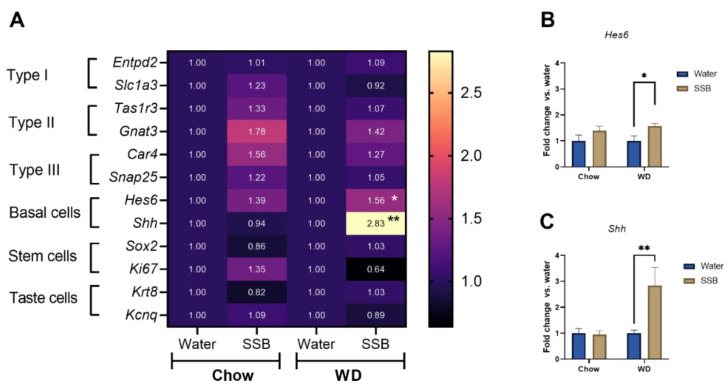
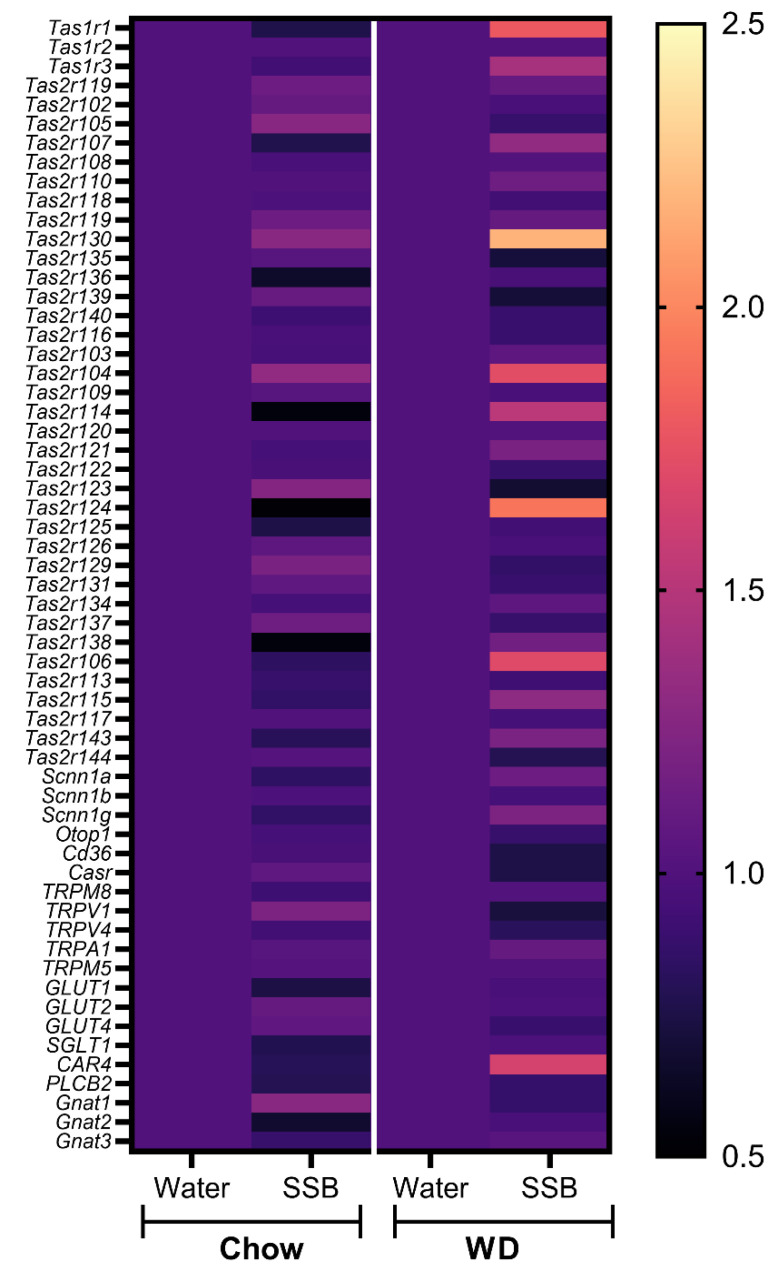
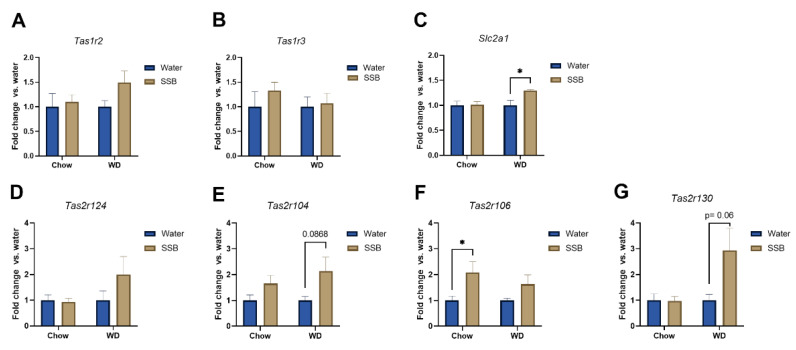
We investigated whether the long-term intake of a typical sugar-sweetened soft drink (sugar-sweetened beverage, SSB) alters markers for taste function when combined with a standard diet (chow) or a model chow mimicking a Western diet (WD). Adult male CD1 mice had ad libitum access to tap water or SSB in combination with either the chow or the WD for 24 weeks. Energy intake from fluid and food was monitored three times a week. Cardiometabolic markers (body weight and composition, waist circumference, glucose and lipid profile, and blood pressure) were analyzed at the end of the intervention, as was the number and size of the fungiform papillae as well as mRNA levels of genes associated with the different cell types of taste buds and taste receptors in the circumvallate papillae using a cDNA microarray and qPCR. Although the overall energy intake was higher in the WD groups, there was no difference in body weight or other cardiometabolic markers between the SSB and water groups. The chemosensory surface from the fungiform papillae was reduced by 36 ± 19% (p < 0.05) in the WD group after SSB compared to water intake. In conclusion, the consumption of the SSB reduced the chemosensory surface of the fungiform papillae of CD1 mice when applied in combination with a WD independent of body weight. The data suggest synergistic effects of a high sugar-high fat diet on taste dysfunction, which could further influence food intake and promote a vicious cycle of overeating and taste dysfunction.

Keywords: Western diet; diet; mice; sugar-sweetened beverage; taste dysfunction.


Conflict of interest statement

The authors declare no conflict of interest.

Figures

Figure 1
Figure 1
(A) Mean total energy intake ± SEM [kJ] from food (plain bars) and fluid intake (checkered bars) from mice receiving either a standard diet (chow) or Western-type diet (WD) with water (Water, blue bars) or a SSB (brown bars) as a drink. (B) Mean food intake ± SEM [g/mouse per day] and (C) mean fluid intake ± SEM [mL/mouse per day] from mice receiving either a standard diet (chow) or Western-type diet (WD) with water (Water, blue bars) or a sugar-sweetened beverage (SSB, brown bars) as a drink. Statistical significance was tested using two-way ANOVA with a Holm–Sidak post hoc test, expect for fluid intake, which was analyzed with an ANOVA on ranks followed by Dunn’s multiple comparison test due to a lack of equal variances, with n = 7–8 for the chow group, n = 11–12 for the WD group. Significance was assumed at p < 0.05 and is marked by * p < 0.05, ** p < 0.01, *** p < 0.001 and **** p < 0.0001.
Figure 2
Figure 2
(A) Mean body weight (n = 11–12 for chow group, n = 7–8 for WD group), (B) mean lean/fat mass ratio, (n = 11–12 for chow group, n = 7–8 for WD group), (C) total mass of brown adipose tissue (BAT), (n = 9–12 for chow group, n = 7–8 for WD group), (D) mean body temperature (n = 11–12 for chow group, n = 5–8 for WD group), (E) mean fasting glucose level, (n = 11–12 for chow group, n = 7–8 for WD group), (F) mean fasting plasma insulin concentrations (n = 11–12 for chow group, n = 7–8 for WD group), (G) mean values for quantitative insulin sensitivity check index (QUICKI) (n = 9–11 for chow group, n = 7–8 for WD group), and (H) mean area under the curve (AUC) obtained from glucose concentrations during an oral glucose tolerance test (n = 11–12 for chow group, n = 7–8 for WD group). Data is shown as mean ± SEM, from mice receiving either a standard diet (chow) or Western-type diet (WD) with water (Water, blue bars) or a sugar-sweetened beverage (SSB, brown bars) as a drink for 24 weeks. Statistical significance was tested using two-way ANOVA with the Holm–Sidak post hoc test, except for quantitative insulin sensitivity check index (QUICKI), which was analyzed using the Mann–Whitney U test due to a lack of equal variances. Significance was assumed at p < 0.05. * p < 0.05, ** p < 0.01.
Figure 3
Figure 3
(A) Representative image for the analysis of the fungiform papillae after staining with methylene blue taken at 10× magnification. The light-stained fungiform papillae with the darker taste pore in the middle, exemplarily marked with arrows, can be easily distinguished from the non-gustatory filiform papillae (dark blue stained). (B) Mean number ± SEM of fungiform papillae at the anterior part in front of the intermolar eminence, and (C) mean chemosensory surface ± SEM from the fungiform papillae, calculated from the size and number of the fungiform papillae from mice receiving either a standard diet (chow) or Western-type diet (WD) with water (Water, blue bars) or a sugar-sweetened beverage (SSB, brown bars) as a drink for 24 weeks. Statistical significance was tested using two-way ANOVA with the Holm–Sidak post hoc test from n = 11–12 for the chow group, and n = 7–8 for the WD group, assumed at p < 0.05 and is marked by *.
Figure 4
Figure 4
qPCR analysis of marker genes for different cell types of the taste bud in the circumvallate papillae (CV) from mice that received either a standard diet (chow) or Western-type diet (WD) with water (Water, blue bars) or a sugar-sweetened beverage (SSB, brown bars) as a drink for 24 weeks. (A) Heatmap representing the mean fold changes to the corresponding water control in a color code. (B,C) Gene expression analysis of Hes6 and Shh. Statistical significance was tested using two-way ANOVA with the Holm–Sidak post hoc test or Student’s t-test, assumed at p < 0.05. * p < 0.05, ** p < 0.01, n = 9–10 for the chow group, n = 7–8 for the WD group.
Figure 5
Figure 5
Transcriptome analysis of 59 selected genes associated with oral chemosensation, displayed as a heatmap showing mean fold changes in gene expression of the SSB-fed diet groups in relation to the respective water-fed group (=1) in the form of a color code. The gene expression was analyzed using one customized cDNA microarray per group from pooled RNA samples of the CV from mice that received either a standard diet (chow, n = 10–11) or Western-type diet (WD, n = 7–8) with water (Water) or a sugar-sweetened beverage (SSB) as a drink for 24 weeks.
Figure 6
Figure 6
Gene expression analysis with qPCR of (A) Tas1r2, (B) Tas1r3, and (C) Slc2a1, encoding for the glucose transporter one, (D) Tas2r124, (E) Tas2r104, (F) Tas2r106, and (G) Tas2r130. RNA was obtained from the CV of mice that received either a standard diet (chow) or Western-type diet (WD) with water (Water, blue bars) or a sugar-sweetened beverage (SSB, brown bars) as a drink for 24 weeks. Mean fold changes ± SEM in gene expression of the SSB-fed diet groups is displayed in relation to the respective water-fed group (=1). Statistical significance was tested using Student’s t-test or Mann–Whitney U test in case of Tas2r106 and Tas2r130 and assumed at p < 0.05 and is marked by *, n = 9–10 for chow group, n = 7–8 for the WD group.

Similar articles

Cited by

References

    1. Spinelli S., Monteleone E. Food Preferences and Obesity. Endocrinol. Metab. 2021;36:209–219. doi: 10.3803/EnM.2021.105. - DOI - PMC - PubMed
    1. Mendoza J.A., Drewnowski A., Christakis D.A. Dietary Energy Density Is Associated with Obesity and the Metabolic Syndrome in U.S. Adults. Diabetes Care. 2007;30:974–979. doi: 10.2337/dc06-2188. - DOI - PubMed
    1. Juul F., Martinez-Steele E., Parekh N., Monteiro C.A., Chang V.W. Ultra-processed food consumption and excess weight among US adults. Br. J. Nutr. 2018;120:90–100. doi: 10.1017/S0007114518001046. - DOI - PubMed
    1. Bartoshuk L., Duffy V., Hayes J., Moskowitz H., Snyder D. Psychophysics of sweet and fat perception in obesity: Prob-lems, solutions and new perspectives. Philos. Trans. R. Soc. B Biol. Sci. 2006;361:1137–1148. doi: 10.1098/rstb.2006.1853. - DOI - PMC - PubMed
    1. Lampuré A., Deglaire A., Schlich P., Castetbon K., Péneau S., Hercberg S., Méjean C. Liking for fat is associated with sociodemographic, psychological, lifestyle and health characteristics. Br. J. Nutr. 2014;112:1353–1363. doi: 10.1017/S0007114514002050. - DOI - PubMed

LinkOut - more resources