. 2022 Jan 30;14(3):616.
doi: 10.3390/nu14030616.

Probiotic Consumption Boosts Thymus in Obesity and Senescence Mouse Models

Affiliations

Probiotic Consumption Boosts Thymus in Obesity and Senescence Mouse Models

Florencia Balcells et al. Nutrients. .

Abstract

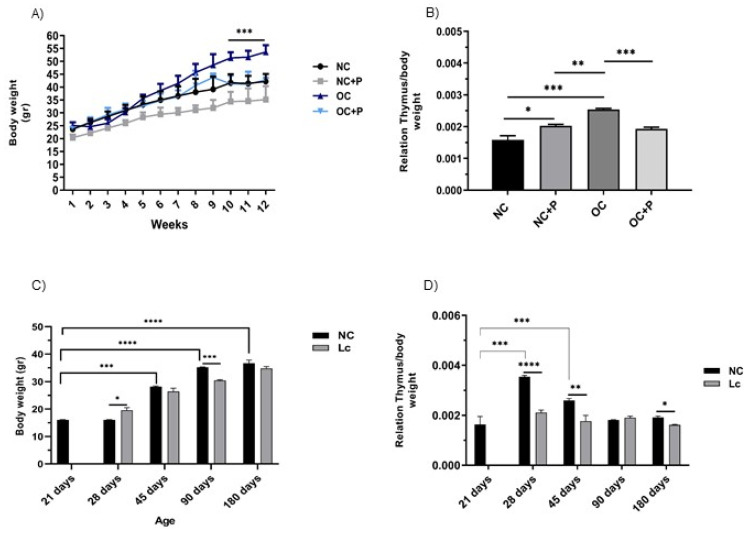
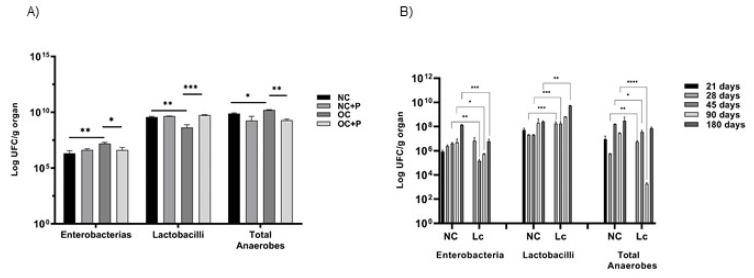
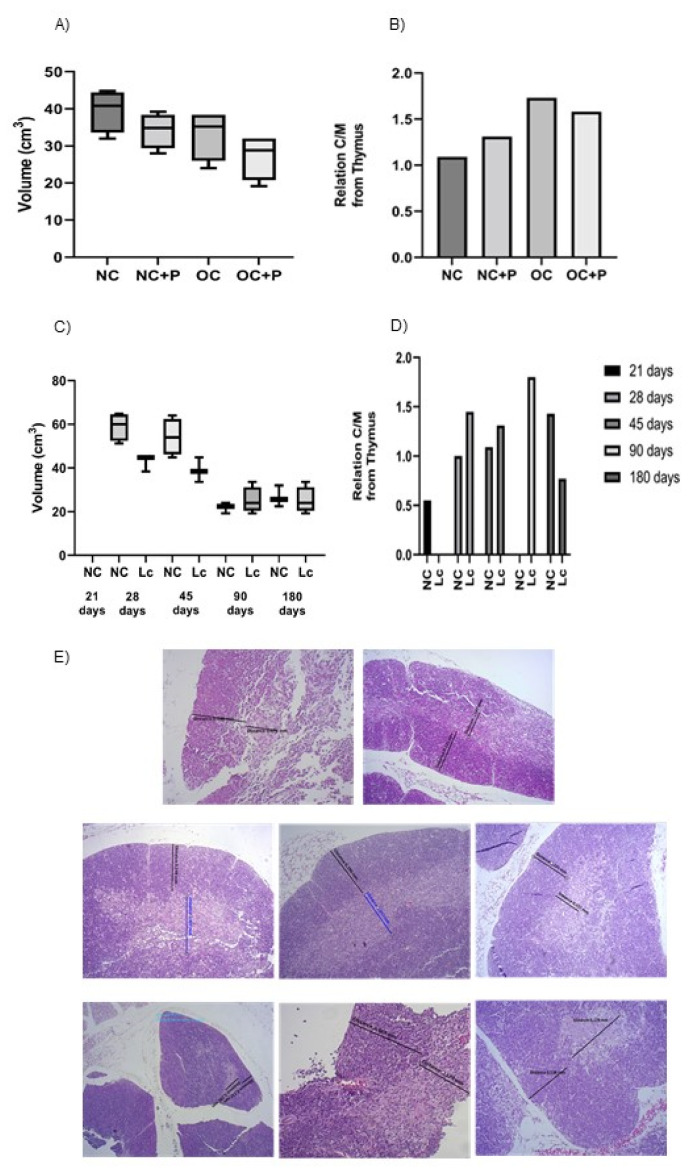
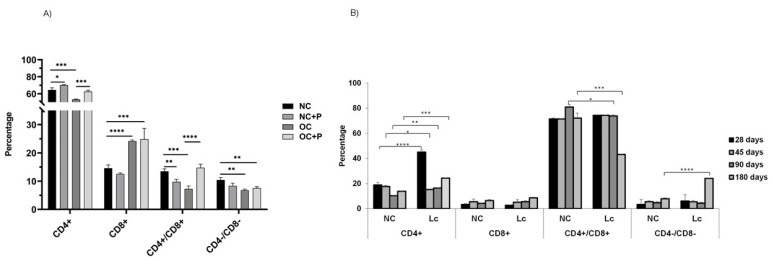
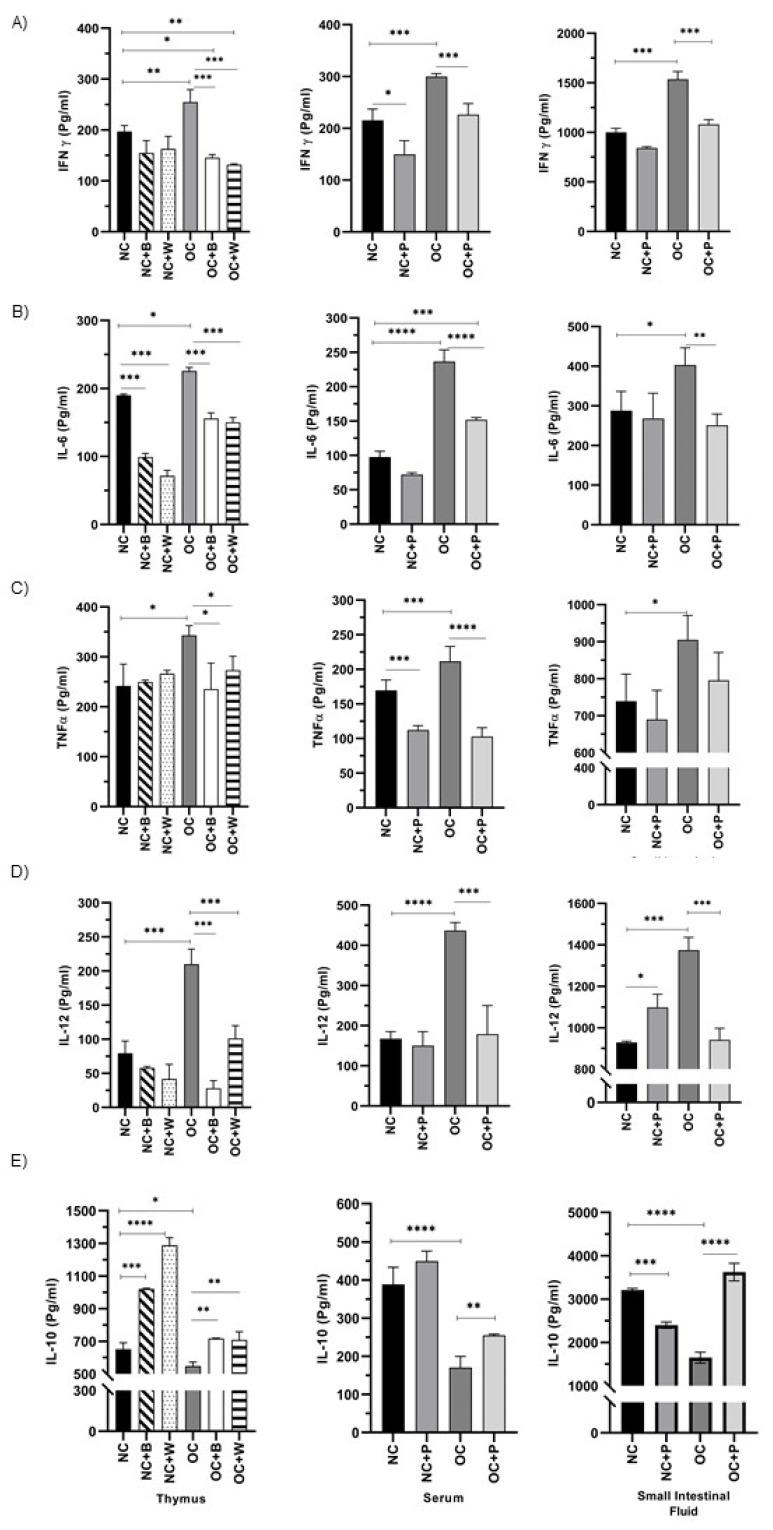
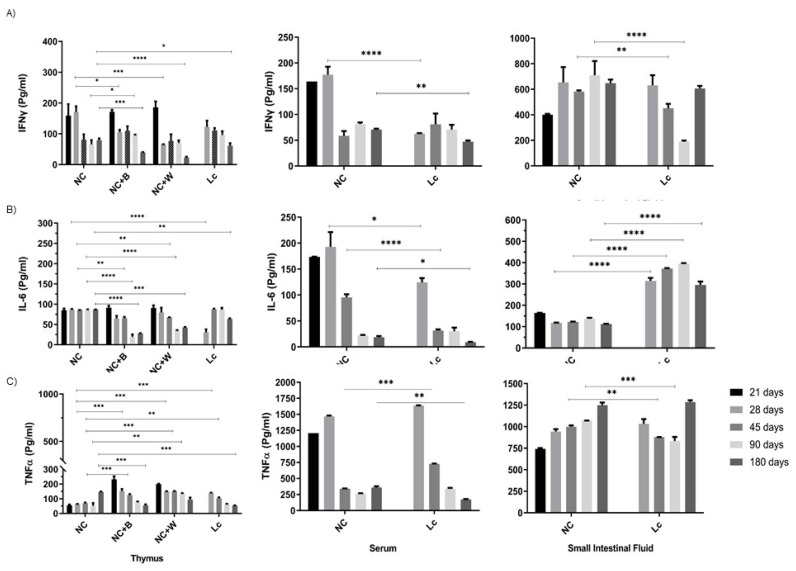
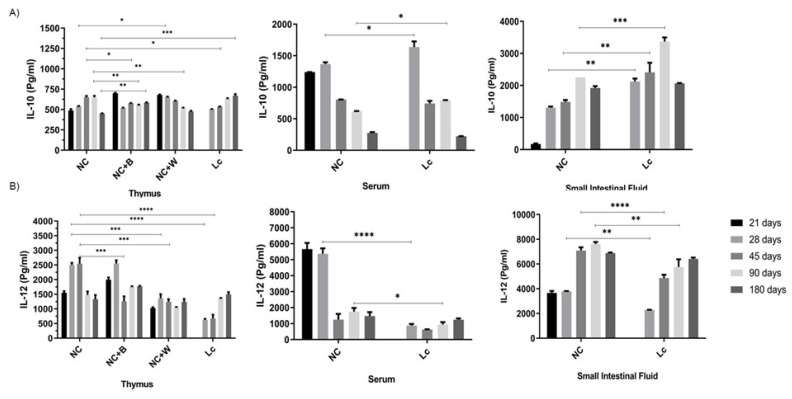
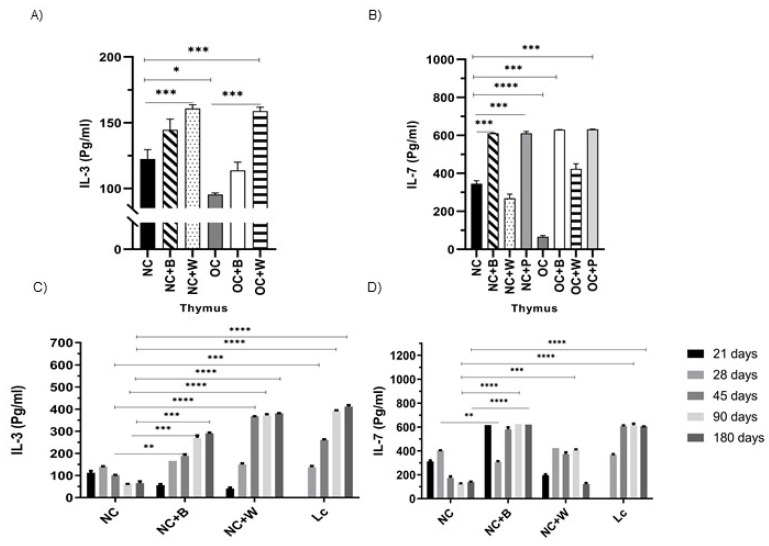
The ability of the immune system to respond to different pathogens throughout life requires the constant production and selection of T cells in the thymus. This immune organ is very sensitive to age, infectious processes and nutrition disorders (obesity and malnutrition). Several studies have shown that the incorporation of some probiotic bacteria or probiotic fermented milk in the diet has beneficial effects, not only at the intestinal level but also on distant mucosal tissues, improving the architecture of the thymus in a malnutrition model. The aim of the present study was to determine whether supplementation with the probiotic strain Lactobacillus casei CRL 431 and/or its cell wall could improve body weight, intestinal microbiota and thymus structure and function in both obese and aging mice. We evaluated probiotic administration to BALB/c mice in 2 experimental mouse models: obesity and senescence, including mice of different ages (21, 28, 45, 90 and 180 days). Changes in thymus size and histology were recorded. T-lymphocyte population and cytokine production were also determined. The consumption of probiotics improved the cortical/medullary ratio, the production and regulation of cytokines and the recovery of mature T-lymphocyte populations of the thymus in obese and old mice. Probiotic incorporation into the diet could not only modulate the immune system but also lead to thymus function recovery, thus improving quality of life.

Keywords: aging; immune system; obesity; probiotic cell wall; probiotics; thymus.


Conflict of interest statement

The authors declare that the research was conducted in the absence of any commercial or financial relationships that could be construed as a potential conflict of interest.

Figures

Figure 1
Figure 1
Body and thymus weight changes in senescence and obesity animal models. Mice were weighed every week during the experience. On the day of sacrifice, the thymus weight of each animal was also registered. Each point represented the average ± SD of the weight data pooled from 3 independent experiments with 3 mice per group. (A) Body weight differences registered in normal control mice (NC); normal control mice that received a conventional diet and supplementation with the probiotic bacteria (CN+P); obese mice (OC), and obese mice that received the HFD and probiotic supplementation (OC+P). (C) Body weight curves of mice at different ages (21, 28, 45, 90 and 180 days of age). The thymus/body weight ratio was calculated by dividing the organ weight by the body weight for (B) the group of obese mice and (D) mice at different ages. One-way ANOVA with Tukey’s correction for multiple comparisons * p < 0.05; ** p < 0.001; *** p < 0.001; **** p < 0.0001.
Figure 2
Figure 2
Microbial population in the large intestine. Total population of enterobacteria, lactobacilli and anaerobes was evaluated in the large intestine of: (A) obese mice and (B) mice of 21, 28, 45, 90 or 180 days for the senescence study. Results were expressed as CFU/mL per gram of large intestine (mean ± SD) of three independent experiments. (NC) received a balanced diet and water; (NC+P) received a balanced diet and probiotic bacteria in the drinking water; (OC) mice fed a high-fat diet and water; (OC+P) mice fed a high-fat diet and a probiotic Lc 431 suspension. One-way ANOVA with Tukey’s correction for multiple comparisons * p < 0.05; ** p < 0.001; *** p < 0.001; **** p < 0.0001.
Figure 3
Figure 3
Post-mortem determination of thymus volume. The organ was extracted and weighed after the sacrifice. Each point represented the average ± SD of volume data pooled from 3 independent experiments with 3 mice per group. (A,C): size of the thymus in the obesity and senescence mouse models, respectively, (B,D): cortex/medullary /relationship from the thymus in obesity and senescence mouse models, respectively. Results (mean ± SD) were representative of three independent experiments. Micrographs of thymus sections in the different animal models. Tissue sections from obese (E) and senescence mouse models stained with hematoxylin and eosin. Magnification 1000×.
Figure 4
Figure 4
Determination of CD4 and CD8 (single- and double-positive) T lymphocytes in thymus. The number of CD4+ and CD8+ cells was determined by flow cytometry in both models: (A) obese mice with or without probiotic supplementation; (B) senescence animal model at different mice ages (21, 28, 45, 90 and 180 days) with or without probiotic consumption. Results were expressed as means of the percentages of positive cells obtained from 3 mice per group and repeated in 3 independent experiments. One-way ANOVA with Tukey’s correction for multiple comparisons * p < 0.05; ** p < 0.001; *** p < 0.001; **** p < 0.0001.
Figure 5
Figure 5
Cytokine production in the obesity mouse model. The levels of different cytokines: (A) IFN-γ, (B) IL-6, (C) TNF-α, (D) IL-12 and (E) € IL-10 were determined in the thymus, serum, and small intestinal fluid from the animals: NC (normal control); (NC+P) receiving a balanced diet and probiotic bacterium in the drinking water; (OC) fed water and a high-fat diet; (OC+P) fed a high-fat diet and a probiotic suspension with Lc431. In vitro cultures of thymocytes were stimulated with the probiotic bacterium (B) or its probiotic cell wall (W). Data were shown as mean ± SD of 3 independent experiments with 3 mice per group. One-way ANOVA with Tukey’s correction for multiple comparisons. * p < 0.05; ** p < 0.01; *** p < 0.001; **** p < 0.0001.
Figure 6
Figure 6
Cytokine production in the senescence mouse model. Levels of (A) IFN-γ; (B) IL-6; (C) TNF-α were determined in the thymus, serum and small intestinal fluid from mice at different ages (21, 28, 45, 90 and 180 days). Thymocytes were in vitro stimulated with the probiotic bacterium (B) or the probiotic cell wall (W), and the cytokines (IFN-γ, IL-6 and TNF-α) were determined in the supernatant collected after 24 h of incubation. Data were shown as mean ± SD of 3 independent experiments with 3 mice per group. One-way ANOVA with Tukey’s correction for multiple comparisons. * p < 0.05; ** p < 0.01; *** p < 0.001; **** p < 0.0001.
Figure 7
Figure 7
IL-10 and IL-12 production in the senescence animal model. Levels of: (A) IL-10 and (B) IL-12 were determined in the thymus, serum and small intestinal fluid from mice at different ages (21, 28, 45, 90 and 180 days). Thymocytes were in vitro stimulated with the probiotic bacterium (B) or the probiotic cell wall (W), and the cytokines (IL-10 and IL-12) were determined in the supernatant after 24 h of incubation. Data were shown as mean ± SD of 3 independent experiments with 3 mice per group. One-way ANOVA with Tukey’s correction for multiple comparisons * p < 0.05; ** p < 0.01; *** p < 0.001; **** p < 0.0001.
Figure 8
Figure 8
IL-3 and IL-7 levels in thymocytes from obese and old mice. The production of IL-3 (A) and IL-7 (B) of thymus cells was determined in the thymocyte culture supernatant from normal control (NC) and obese control (OC) mice. In senescent mice, IL-3 (C) and IL-7 (D) were determined in the thymocyte supernatant from mice at different ages (21, 28, 45, 90 and 180 days). The cell culture was stimulated by the probiotic bacterium (B) or its cell wall (W). Data were shown as mean ± SD of three independent experiments. One-way ANOVA with Tukey’s correction for multiple comparisons * p < 0.05; ** p < 0.01; *** p < 0.001; **** p < 0.0001.

References

    1. Boehm T. Thymus development and function. Curr. Opin. Immunol. 2008;20:178–184. doi: 10.1016/j.coi.2008.03.001. - DOI - PubMed
    1. Palmer D.B. The effect of age on thymic function. Front. Immunol. 2013;4:316. doi: 10.3389/fimmu.2013.00316. - DOI - PMC - PubMed
    1. Pobezinsky L.A., Angelov G.S., Tai X., Jeurling S., Van Laethem F., Feigenbaum L., Park J.H., Singer A. Clonal deletion and the fate of autoreactive thymocytes that survive negative selection. Nat. Immunol. 2012;13:569–578. doi: 10.1038/ni.2292. - DOI - PMC - PubMed
    1. Savino W., Dardenne M. Neuroendocrine Control of Thymus Physiology. Endocr. Rev. 2000;21:412–443. - PubMed
    1. Scalea J.R., Hickman J.B., Moore D.J., Brayman K.L. An overview of the necessary thymic contributions to tolerance in transplantation. Clin. Immunol. 2016;173:1–9. doi: 10.1016/j.clim.2016.10.010. - DOI - PubMed

LinkOut - more resources