

Differential Glycemic Effects of Low- versus High-Glycemic Index Mediterranean-Style Eating Patterns in Adults at Risk for Type 2 Diabetes: The MEDGI-Carb Randomized Controlled Trial
- PMID: 35277067
- PMCID: PMC8838655
- DOI: 10.3390/nu14030706
Differential Glycemic Effects of Low- versus High-Glycemic Index Mediterranean-Style Eating Patterns in Adults at Risk for Type 2 Diabetes: The MEDGI-Carb Randomized Controlled Trial
Abstract
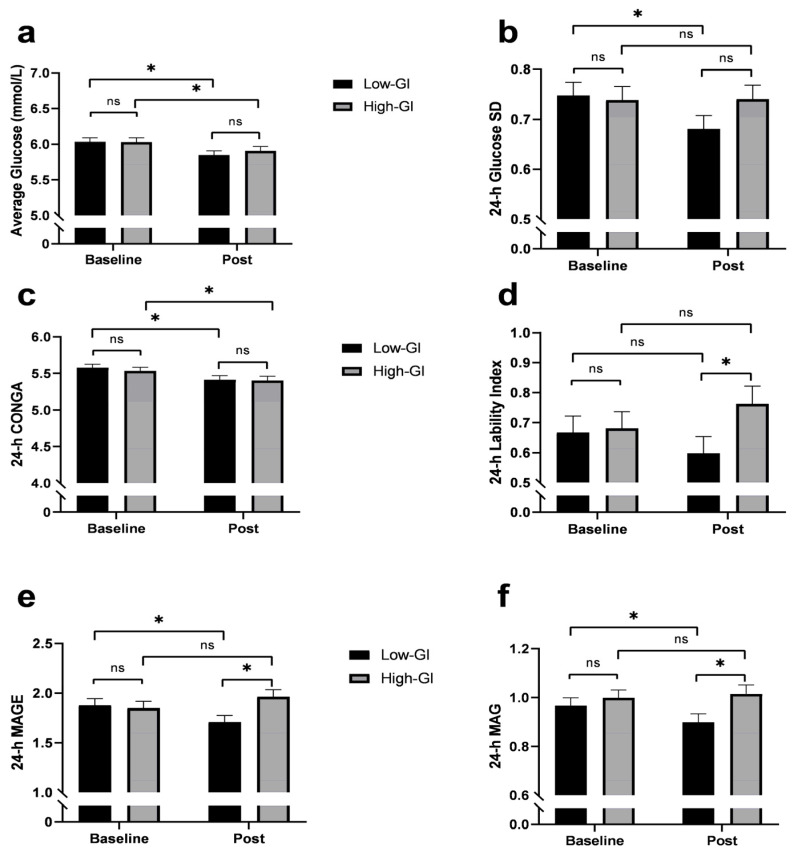
A Mediterranean-style healthy eating pattern (MED-HEP) supports metabolic health, but the utility of including low-glycemic index (GI) foods to minimize postprandial glucose excursions remain unclear. Therefore, we investigated the relative contribution of GI towards improvements in postprandial glycemia and glycemic variability after adopting a MED-HEP. We conducted a randomized, controlled dietary intervention, comparing high- versus low-GI diets in a multi-national (Italy, Sweden, and the United States) sample of adults at risk for type 2 diabetes. For 12 weeks, participants consumed either a low-GI or high-GI MED-HEP. We assessed postprandial plasma glucose and insulin responses to high- or low-GI meals, and daily glycemic variability via continuous glucose monitoring at baseline and post-intervention. One hundred sixty adults (86 females, 74 males; aged 55 ± 11 y, BMI 31 ± 3 kg/m2, mean ± SD) with ≥two metabolic syndrome traits completed the intervention. Postprandial insulin concentrations were greater after the high-GI versus the low-GI test meals at baseline (p = 0.004), but not post-intervention (p = 0.17). Postprandial glucose after the high-GI test meal increased post-intervention, being significantly higher than that after the low-GI test meal (35%, p < 0.001). Average daily glucose concentrations decreased in both groups post-intervention. Indices of 24-h glycemic variability were reduced in the low-GI group as compared to baseline and the high-GI intervention group. These findings suggest that low-GI foods may be an important feature within a MED-HEP.
Keywords: Mediterranean diet; continuous glucose monitoring; glycemic variability; impaired glycemic control; insulinemia; meal glucose tolerance test; metabolic health; metabolic risk factors; metabolic syndrome; oral glucose tolerance test.
Conflict of interest statement
G.R. is a member of the Scientific Advisory Board of the Nutrition Foundation of Italy, the Barilla Foundation for Food and Nutrition, and the Istituto Nutrizionale Carapelli Foundation; he is a member of the Health and Wellbeing Advisory Board of the Barilla G. e R. Fratelli Company. R.B. is currently employed by ADM. Research presented in this paper was conducted in a former role and has no connection with ADM. I.B. is currently employed by AstraZeneca. Research presented in this paper was conducted in a former role and has no connection with AstraZeneca.
Figures


References
-
- Saeedi P., Petersohn I., Salpea P., Malanda B., Karuranga S., Unwin N., Colagiuri S., Guariguata L., Motala A.A., Ogurtsova K., et al. Global and regional diabetes prevalence estimates for 2019 and projections for 2030 and 2045: Results from the International Diabetes Federation Diabetes Atlas, 9th edition. Diabetes Res. Clin. Pract. 2019;157:107843. doi: 10.1016/j.diabres.2019.107843. - DOI - PubMed
-
- Kaiser A.B., Zhang N., Der Pluijm W.V. Global prevalence of type 2 diabetes over the next ten years (2018–2028) Diabetes. 2018;67((Suppl. 1)):202-LB. doi: 10.2337/db18-202-LB. - DOI
-
- Dokken B.B. The pathophysiology of cardiovascular disease and diabetes: Beyond blood pressure and lipids. Diabetes Spec. 2008;21:160–165. doi: 10.2337/diaspect.21.3.160. - DOI
-
- Xu J., Murphy S.L., Kockanek K.D., Arias E. Mortality in the United States, 2018. NCHS Data Brief. 2020;355:1–8. - PubMed
Publication types
MeSH terms
Substances
Grants and funding
LinkOut - more resources
Full Text Sources
Medical
