. 2022 Mar;10(3):e004029.
doi: 10.1136/jitc-2021-004029.

CircITGB6 promotes ovarian cancer cisplatin resistance by resetting tumor-associated macrophage polarization toward the M2 phenotype

Affiliations

CircITGB6 promotes ovarian cancer cisplatin resistance by resetting tumor-associated macrophage polarization toward the M2 phenotype

Han Li et al. J Immunother Cancer. 2022 Mar.

Abstract

Background: Platinum resistance is a major challenge in the clinical treatment of advanced ovarian cancer (OC). Accumulating evidence shows that the tumor-promotive M2 macrophage is linked to the limiting chemotherapy efficacy of multiple malignancies including OC. Circular RNAs (circRNAs) are a novel class of non-coding RNAs which function as the critical regulator in biological process of cancer. However, their impact on macrophage polarization and chemoresistance of OC remain unclear.

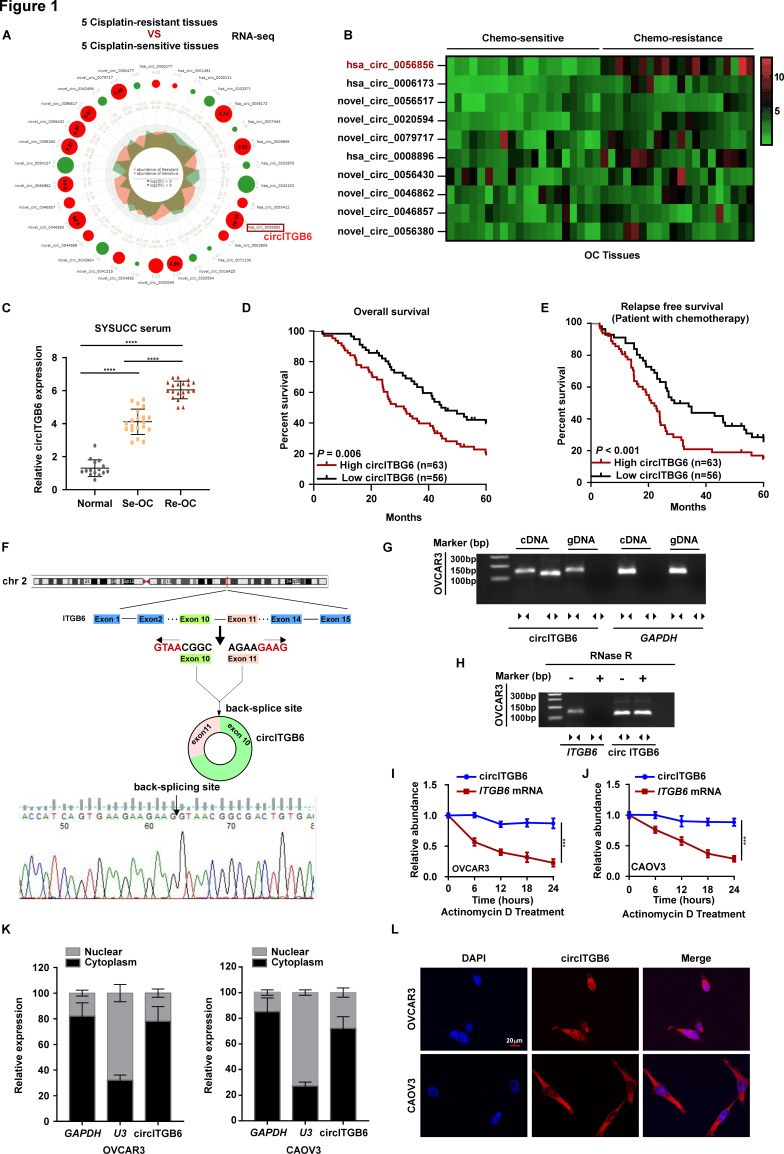
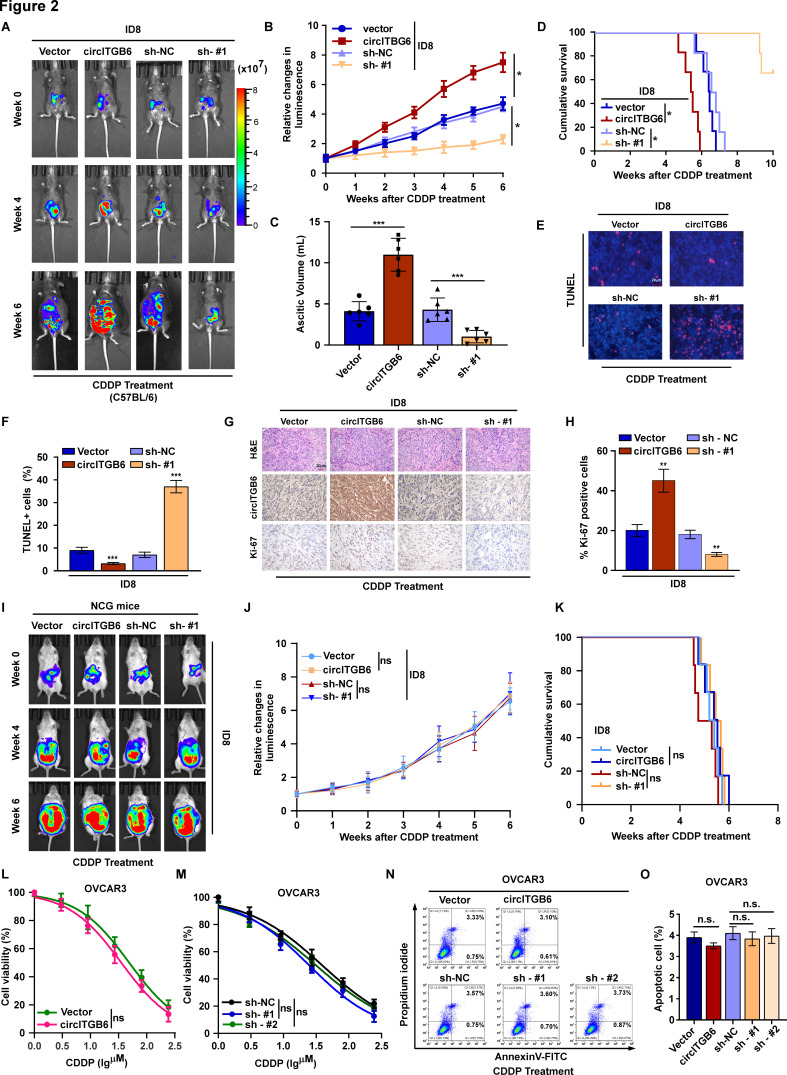
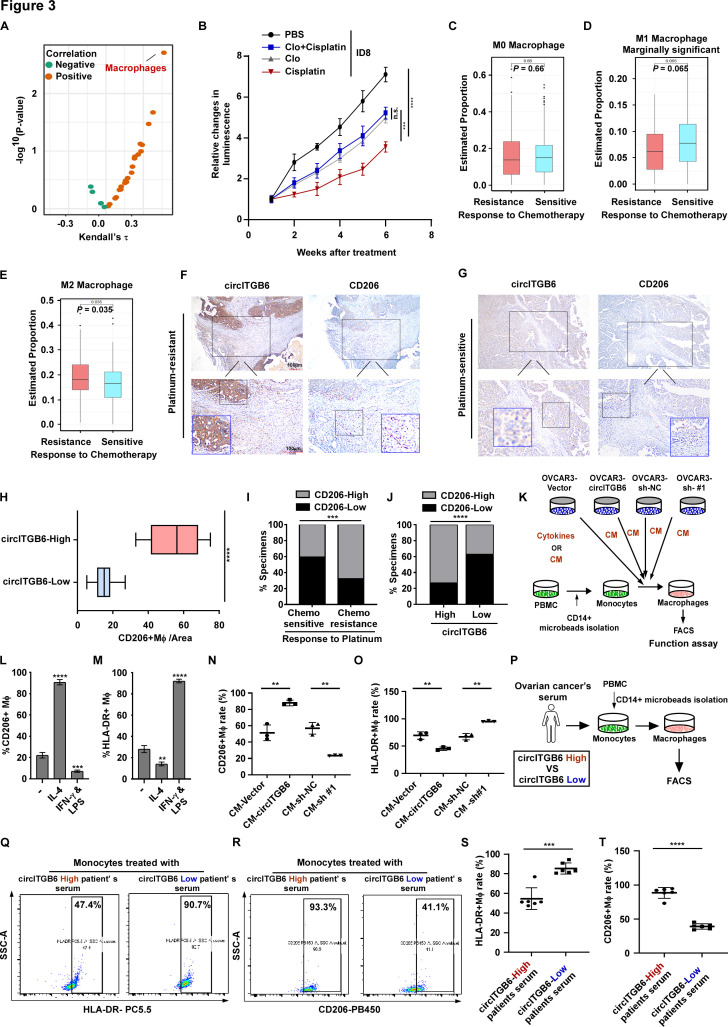
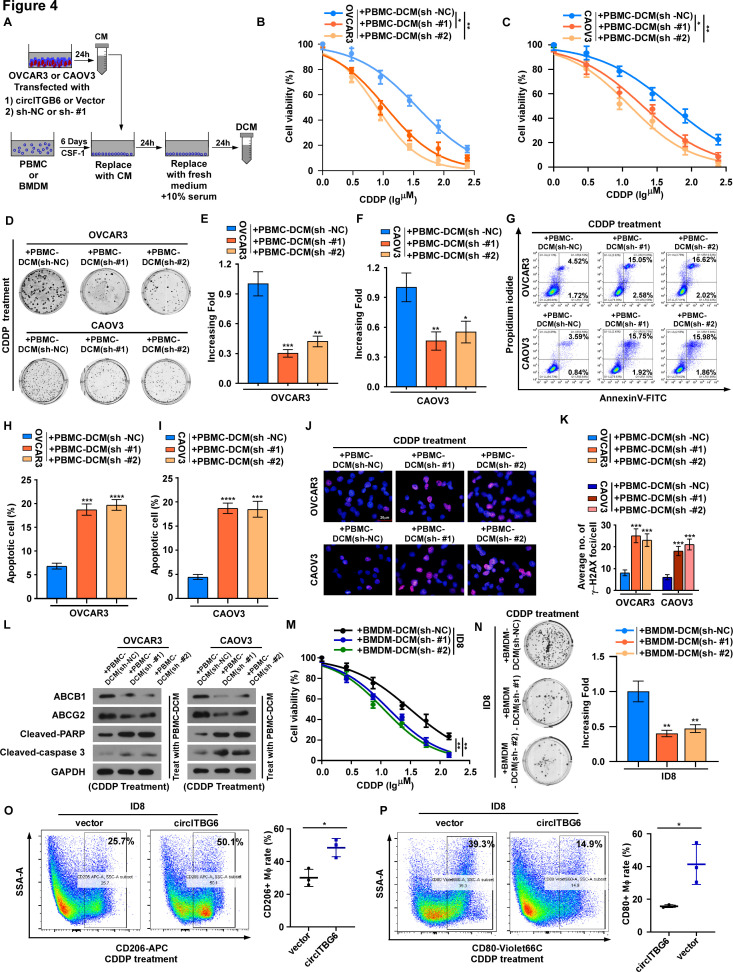
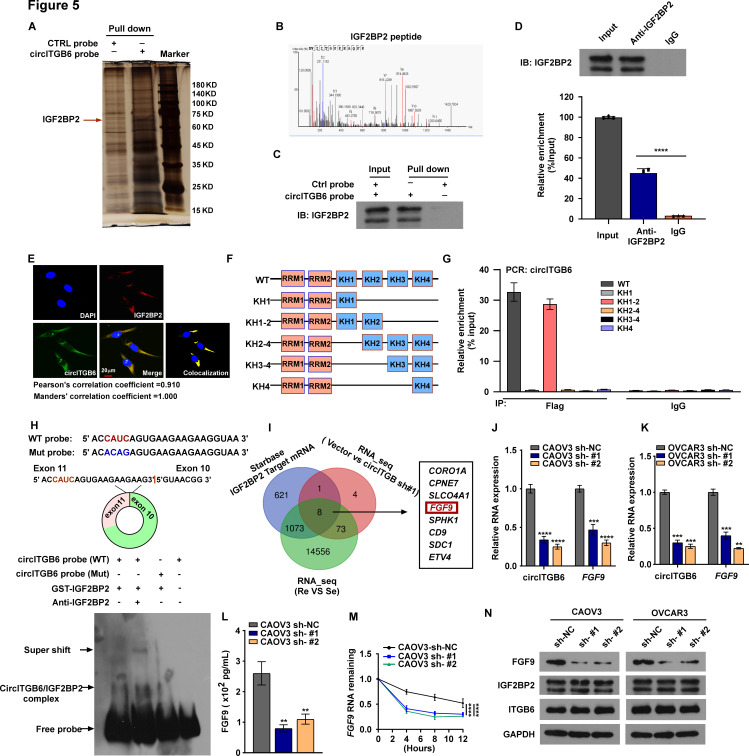
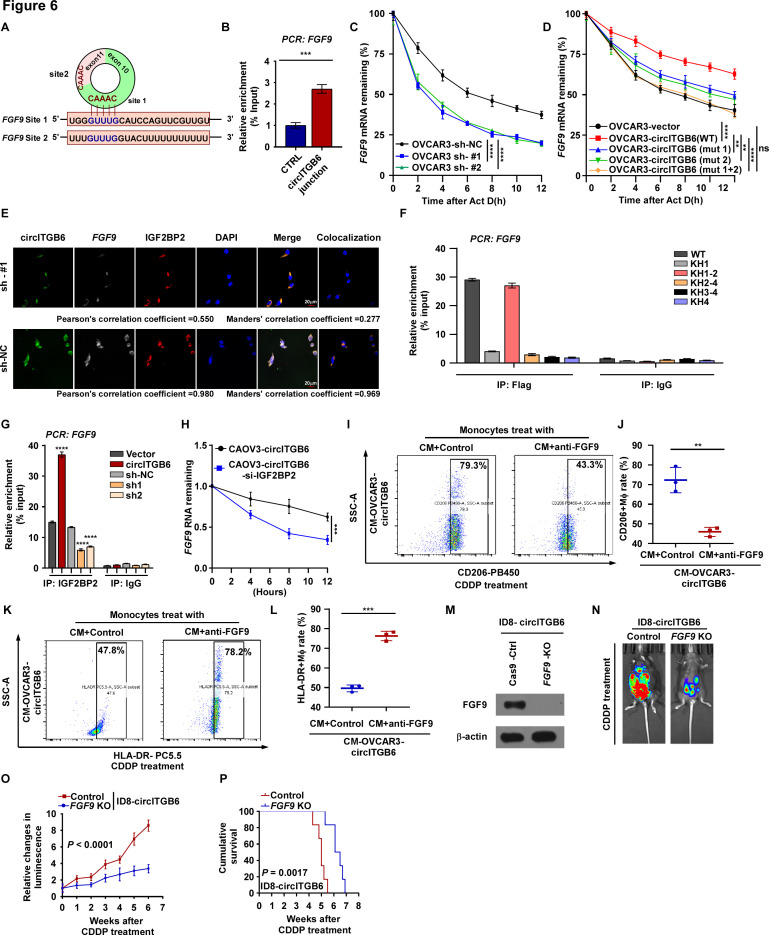
Methods: Platinum-resistant circRNAs were screened using circRNA deep sequencing and validated using in situ hybridization in OC tissues with or without platinum resistance. The role of circITGB6 in inducing cisplatin (CDDP) resistance was evaluated by clone formation, immunofluorescence and annexin V assays in vitro, and by intraperitoneal tumor model in vivo. The mechanism underlying circITGB6-mediated tumor-associated macrophage (TAM) polarization into M2 phenotype was investigated using RNA pull-down, luciferase reporter, electrophoretic mobility shift, RNA binding protein immunoprecipitation (RIP), ELISA and immunofluorescence assays.

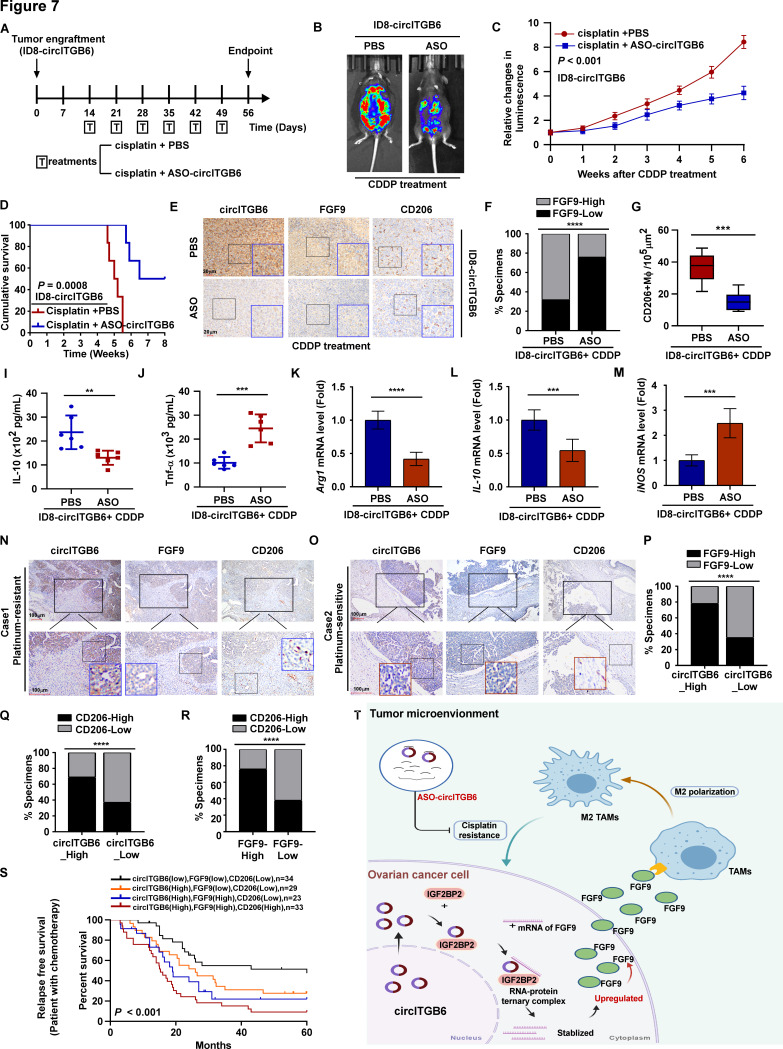
Results: We identified that a novel circRNA, circITGB6, robustly elevated in tumor tissues and serums from patients with OC with platinum resistance, was correlated with poor prognosis. circITGB6 overexpression promoted an M2 macrophage-dependent CDDP resistance in both vivo and vitro. Mechanistic research determined that circITGB6 directly interacted with IGF2BP2 and FGF9 mRNA to form a circITGB6/IGF2BP2/FGF9 RNA-protein ternary complex in the cytoplasm, thereby stabilizing FGF9 mRNA and inducing polarization of TAMs toward M2 phenotype. Importantly, blocking M2 macrophage polarization with an antisense oligonucleotide targeting circITGB6 markedly reversed the circITGB6-induced CDDP resistance of OC in vivo.

Conclusions: This study reveals a novel mechanism for platinum resistance in OC and demonstrates that circITGB6 may serve as a potential prognostic marker and a therapeutic target for patients with OC.

Keywords: macrophages; translational medical research; tumor microenvironment.


Conflict of interest statement

Competing interests: There are no competing interests.

Figures

Figure 1
Figure 1
Elevated levels of circITGB6 correlates with chemoresistance and poor prognosis in OC. (A) RNA sequencing of five CDDP-resistant and five CDDP-sensitive OC tissues to screen differentially expressed circRNAs. Radar chart showing top 18 upregulated (the red circles) and 12 downregulated (the green circles) circRNAs in CDDP-resistant OC compared with those in CDDP-sensitive OC. (B) Heatmap shows top 10 upregulated circRNA expression in 20 CDDP-resistant and 20 CDDP-sensitive OC tissues detected by qRT-PCR. (C) qRT-PCR analysis of circITGB6 expression in serum from 15 normal control, 20 patients with OC with CDDP resistance and 20 patients with OC with CDDP sensitivity from the SYSUCC. Data represent mean±SD. The p values were determined by unpaired Student’s t-test. (D, E) Kaplan-Meier analysis of OS and RFS in patients with OC with low expression versus high expression in the circITGB6 from SYSUCC cohorts. The p value was determined by a log-rank test. (F) Schematic illustration showed the circularization of ITGB6 exons 10 and 11 to form circITGB6. The back-splicing junction of circITGB6 was verified by RT-PCR and Sanger sequencing. (G) circITGB6 expression in OVCAR3 cells verified by RT-PCR. Agarose gel electrophoresis showed that divergent primers amplified circITGB6 in cDNA but not gDNA. GAPDH served as a negative control. (H) Validation of circITGB6 stability by RNase R treatment and RT-PCR analysis. Data represent mean±SD from three independent experiments; The p value was determined by two-tailed unpaired Student’s t-test. (I, J) qPCR analysis of the abundance of circITGB6 and linear ITGB6 in OVCAR3 and CAOV3 cells treated with actinomycin D at the indicated times. Data represent mean±SD from five independent experiments; dot plot reflects data points from independent experiment. The p value was determined by two-way analysis of variance. (K) circITGB6 abundance in nuclear and cytoplasmic fractions of OVCAR3 and CAOV3 cells was evaluated by qRT-PCR. GAPDH acted as a positive control in the cytoplasm, and U3 acted as a positive control in the nucleus. Data represent mean±SD from three independent experiments; (L) localization of circITGB6 in OVCAR3 and CAOV3 cells was detected by FISH. Nuclei were stained with DAPI (blue) and circITGB6 probes were labeled with Cy3 (red). Results are presented as means±SD.D. of a representative experiment performed in triplicate. ***P<0.001, ****P<0.0001. CDDP, cisplatin; circRNA, circular RNA; DAPI, 4',6-diamidino-2-phenylindole; GAPDH, glyceraldehyde-3-phosphate dehydrogenase; DNA, genomic DNA; ns, no significance; OC, ovarian cancer; OS, overall survival; qRT-PCR, quantitative real-time PCR; RFS, relapse-free survival; RT-PCR, quantitative real-time PCR.
Figure 2
Figure 2
Chemoresistance of OC in vivo induced by circITGB6 is TME-dependent. Representative images of CDDP-treated intraperitoneal tumor-bearing C57BL/6 mice in each group at the indicated time. (B) Relative changes in bioluminescence signal of intraperitoneal tumors in C57BL/6 mice in each group on CDDP chemotherapy. (C) Kaplan-Meier survival of CDDP-treated intraperitoneal tumor-bearing C57BL/6 mice. (D) The tumor ascites volume of CDDP-treated intraperitoneal tumor-bearing C57BL/6 mice from each group was measured. (E, F) TUNEL-stained cells in indicated tumors. The proportion of TUNEL-positive cells was qualified from five random fields, representing the apoptotic index. (G) ISH assay of circITGB6 and IHC staining of Ki67, and H&E analysis and (H) quantification of proliferation index in the indicated xenograft tumors. (I) Representative images of CDDP-treated intraperitoneal NCG mice in each group at the indicated time. (J) Relative changes in bioluminescence signal of intraperitoneal tumors in NCG mice in each group on CDDP chemotherapy. (K) Kaplan-Meier survival of CDDP-treated intraperitoneal tumor-bearing NCG mice. (L, M) MTT cell viability assay in the indicated cells. (N, O) FACS analysis of annexin V/PI staining and quantification of indicated cells treated with CDDP (5 µM) after 24 hours. Results are presented as means±SD of a representative experiment performed in triplicate. *P<0.05, **P<0.01, ***P<0.001. CDDP, cisplatin; MTT, 3-(4,5)-dimethylthiahiazo (-z-y1)-3,5-di- phenytetrazoliumromide; ns, no significance; OC, ovarian cancer; TME, tumor microenvironment; V/PI, annexin V/propidium iodide.
Figure 3
Figure 3
CircITGB6 induces macrophage polarization toward an M2 phenotype. (A) The scatter plot depicts Kendall’s τ correlation coefficient between circITGB6 abundance and cell-enrichment scores versus the associated cell-enrichment p value significance. (B) C57BL/6 mice (n=6) intraperitoneal bearing ID8 cells with or without clodronate liposome treatment were injected with PBS or cisplatin for 6 weeks (Clo). The tumor growth was followed. (C–E) Different subtypes of macrophage-infiltrated proportion in the TEM of OC analyzed from TCGA via CIBRSORT software. (F, G) Representative image of circITGB6 and CD206 of chemoresistant and chemosensitive OC specimens. (H) Quantification of CD206+ macrophages in circITGB6-low or circITGB6-high specimens. (I, J) Correlation analyses between CD206+ macrophage-infiltrated status and chemotherapy response status or circITGB6 expression in OC patient specimen. (K–M) Schematic: (K) in vitro-polarized macrophages. (L, M) % CD206+ or %HLA-DR+ macrophages after treatment with IL-4 or IFN-γ and LPS or media only (–). (N, O) FACS dot plots showing % CD206+ and %HLA-DR+ macrophages after treatment with CM collected from indicated cells. (P) Schematic shows TAM polarization in vitro with serum from patients with OC with circITGB6 high or circITGB6 low and (Q–T) representative FACS dot plots from patients showing % CD206+ and %HLA-DR+ macrophages after treatment (with circITGB6 high or circITGB6 low serum) of patient with OC. Results are presented as means±SD of a representative experiment performed in triplicate. **P<0.01, ***P<0.001, ****P<0.0001. Clo, clodronate liposome; CM, conditioned medium; IFN-γ, interferon gamma; IL, interleukin; ns, no significance; OC, ovarian cancer; TAM, tumor-associated macrophage; TCGA, The Cancer Genome Atlas; TEM, tumor microenvironment.
Figure 4
Figure 4
Essential role of TAMs (M2 phenotype) in circITGB6-regulated OC CDDP resistance. (A) Scheme of the workflow: OVCAR3 and CAOV3 cells were stably transiently with circITGB6 or sh-circITGB6#1 or its corresponding control (vector or sh-NC), and according to the flowchart to collected DCM for subsequent functional experiments. (B, C) MTT cell viability assay in the OC cells with the indicated PBMC-derived DCM treatment. (D–F) Representative images (D) and quantification (E, F) of colony number of the OC cells with the indicated DCM treatment. (G–I) FACS analysis of annexin V/PI staining (G) and quantification (H,I) of the OC cells with the OC cells PBMC-derived DCM and CDDP (5 µM) treatment. (J, K) Representative images and quantification of γ-H2AX in the OC cells with the indicated PBMC- derived DCM and CDDP (5 µM) treatment. (L) Immunoblot analysis of expression levels of indicated protein in the OC cells with the indicated PBMC-derived DCM and CDDP (5 µM) treatment. GAPDH served as the loading control. (M) MTT cell viability assay in the OC cells with the indicated BMDM-derived DCM treatment. (N) Representative images (left) and quantification (right) of colony number of the indicated cells with its corresponding BMDM-derived DCM treatment. (O, P) Proportion of CD206+ macrophages and CD80+ macrophages isolated from intraperitoneal tumor-bearing C57BL/6 mice injected with indicated cells was measured by FACS analysis. Results are presented as means±SD of a representative experiment performed in triplicate. *P<0.05, **P<0.01, ***P<0.001, ****P<0.0001. BMDM, bone marrow-derived macrophage; CDDP, cisplatin; CM, conditioned medium; DCM, double-conditioned medium; ns, no significance; TAM, tumor-associated macrophage.
Figure 5
Figure 5
CircITGB6 interacts with IGF2BP2 directly. (A) Identification of the circITGB6–protein complex pulled down by circITGB6 junction probe with protein extracts from OVCAR3 cells. The arrows indicating the additional band presented in the circITGB6–protein complex. (B) MS profiles of target band (corresponding peptide sequences of IGF2BP2 retrieved by circITGB6. (C) Immunoblot analysis of IGF2BP2 after RNA pull-down assay showing its specific association with circITGB6. (D) RIP assays showing the association of IGF2BP2 with circITGB6. Relative enrichment representing RNA levels associated with IGF2BP2 compared with an input control. IgG antibody served as a control. (E) IF-FISH assay showing that circITGB6 is colocalized with IGF2BP2 protein in the cytoplasm. (F) Schematic structures showing RNA-binding domains within IGF2BP2 protein and a summary of IGF2BP2 truncations. (G) Relative enrichment representing circITGB6 levels associated with truncated IGF2BP2 relative to an input control examined by RIP assay. (H) Top: schematic illustration showing the CAUC motif located at exon 10–exon 11 junction site of circITGB6 and the RNA probe for the RNA-EMSA assay; bottom: RNA-EMSA assay showing the binding ability of purified IGF2BP2 with biotin-labeled oligonucleotides containing CAUC motif from circITGB6. (I) The putative mRNA interacting with circITGB6 predicted by StarBase3, RNA_seq (OVCAR3-vector cells vs OVCAR3-circITGB6 sh#1 cells) and RNA_seq (re− vs Se− OC tissues). (J, K) qRT-PCR analysis for the RNA expression of circITGB6 and FGF9 in control and circITGB6-knockdown OC cells. (L) Expression of FGF9 in control and circITGB6-knockdown OC cells was measured by ELISA. (M) circITGB6 knockdown in OVCAR3 cells significantly downregulated FGF9 mRNA abundance. (N) Western blotting analysis for the protein expression of FGF9, IGF2BP2, ITGB6 in control and circITGB6-knockdown OC cells. GAPDH was used as an internal control. Results are presented as means±SD of a representative experiment performed in triplicate. *P<0.05, **P<0.01, ***P<0.001, ****P<0.0001. EMSA, electrophoretic mobility shift; ns, no significance; qRT-PCR, quantitative real-time PCR.
Figure 6
Figure 6
The circITGB6/IGF2BP2/FGF9 RNA-protein ternary complex stabilizes FGF9 mRNA. (A)Top: sequence blast analysis showing that circITGB6 directly targets the 3′UTR of FGF9 with high Au content. (B) Relative enrichment representing and FGF9 RNA levels associated with circITGB6 junction compared with control. (C, D) RNA was isolated at the indicated time points and then subjected to qRT-PCR analysis of FGF9 in the indicated OVCAR3 cell treated with ActD (5 μg/mL). (E) IF-FISH assay indicated that the colocalization of circITGB6/IGF2BP2/FGF9 was decreased on knockdown of circITGB6. (F) Relative enrichment representing the enrichment of FGF9 associated with truncated IGF2BP2 protein complex compared with an input control. IgG antibody served as a control. (G) RIP assays showing the association of IGF2BP2 with FGF9 on circITGB6 silencing or overexpression. The p values were determined by a two-tailed unpaired Student t-test. (H) IGF2BP2 knockdown in CAOV3-circITGB6 overexpression cells remarkably reduced FGF9 mRNA abundance. (I–L) FACS dot plots showing (I) % CD206+ and (L) %HLA-DR+ macrophages after treatment with CM collected from indicated cells with anti-FGF9 neutralizing antibody or not. (M) Western blot showing expression of FGF9 in ID8 cells with CRISPR/Cas9-mediated knockout of FGF9 (FGF9–KO). (N) Representative images of indicated groups of mice with administration of CDDP chemotherapy. (O, P) Relative changes in bioluminescence signal and Kaplan-Meier survival of indicated groups of mice with administration of CDDP. Results are presented as means±SD of a representative experiment performed in triplicate. **P<0.01, ***P<0.001, ****P<0.0001. CM, conditioned medium; CDDP, CDDP, cisplatin; ns, no significance.
Figure 7
Figure 7
Clinical relevance of circITGB6/FGF9/M2 macrophages polarization in OC. (A) Schematic representation of xenograft tumor model. (B–D) Relative changes in bioluminescence signal and survival curve of intraperitoneal tumors in C57BL/6 mice in each group with different treatment. (E–G) circITGB6 ISH staining and FGF9 and CD206 immunohistochemistry staining of tumors treated with different therapies. Correlation analyses between FGF9 expression and different therapies in C57BL/6 mice tumor. The CD206+ macrophage infiltration proportion from each group treated with different therapies were quantified. (I–M) Expression of IL-10, TNF-α, ARG1 and iNOS in the TAMs isolated from C57BL/6 mice tumor treated with different therapies measured by ELISA (I, J) and qRT–PCR (K–M). (N, O) Representative ISH staining for circITGB6 and IHC staining images of FGF9, CD206 in OC patient specimens (n=119). (P, Q) Correlation analysis showed that circITGB6 was significantly associated with FGF9 and CD206+ macrophage infiltration proportion. χ2 test was used. (R) Correlation analyses between FGF9 expression and CD206+ macrophage infiltration proportion in OC patient specimen. (S) The patient specimens were divided into four groups according to circITGB6, FGF9, and CD206 expression. Kaplan-Meier survival curves showed that patients with OC with combined high circITGB6, FGF9 expression, and CD206 macrophage infiltration proportion significantly suffered the worst RFS. (T) A proposed model for the regulatory landscape of the circITGB6/IGF2BP2/FGF9 signaling axis in promoting the CDDP resistance of OC. Results are presented as means±SD of a representative experiment performed in triplicate. *P<0.05, **P<0.01, ***P<0.001, ****P<0.0001. ASO, antisense oligonucleotide; CDDP, cisplatin; IL, interleukin; NS indicates no significance; OC, ovarian cancer; RFS, relapse-free survival; TAM, tumor-associated macrophage; TNF-α, tumor necrosis factor alpha.

References

    1. Siegel RL, Miller KD, Fuchs HE, et al. . Cancer statistics, 2021. CA A Cancer J. Clin. 2021;71:7–33. 10.3322/caac.21654 - DOI - PubMed
    1. Bray F, Ferlay J, Soerjomataram I, et al. . Global cancer statistics 2018: GLOBOCAN estimates of incidence and mortality worldwide for 36 cancers in 185 countries. CA Cancer J Clin 2018;68:394–424. 10.3322/caac.21492 - DOI - PubMed
    1. Tsibulak I, Zeimet AG, Marth C. Hopes and failures in front-line ovarian cancer therapy. Crit Rev Oncol Hematol 2019;143:14–19. 10.1016/j.critrevonc.2019.08.002 - DOI - PubMed
    1. Davis A, Tinker AV, Friedlander M. "Platinum resistant" ovarian cancer: what is it, who to treat and how to measure benefit? Gynecol Oncol 2014;133:624–31. 10.1016/j.ygyno.2014.02.038 - DOI - PubMed
    1. Wang M, Zhao J, Zhang L, et al. . Role of tumor microenvironment in tumorigenesis. J Cancer 2017;8:761–73. 10.7150/jca.17648 - DOI - PMC - PubMed

Publication types