. 2022 Mar 11;13(1):1288.
doi: 10.1038/s41467-022-28911-7.

Enhanced jet stream waviness induced by suppressed tropical Pacific convection during boreal summer

Affiliations

Enhanced jet stream waviness induced by suppressed tropical Pacific convection during boreal summer

Xiaoting Sun et al. Nat Commun. .

Abstract

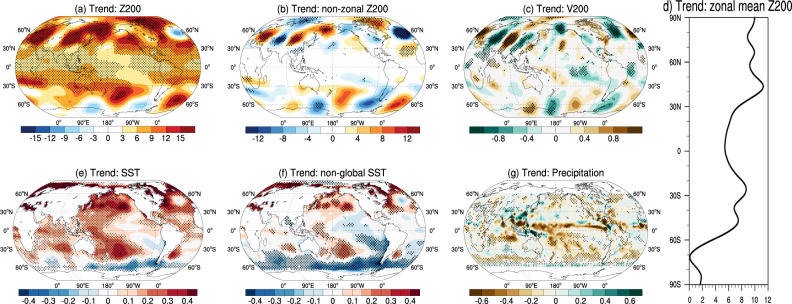
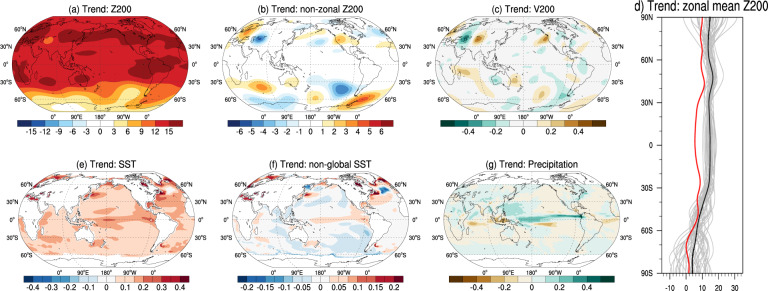
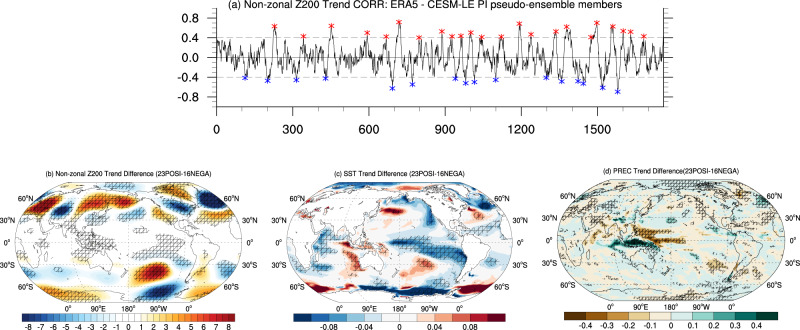
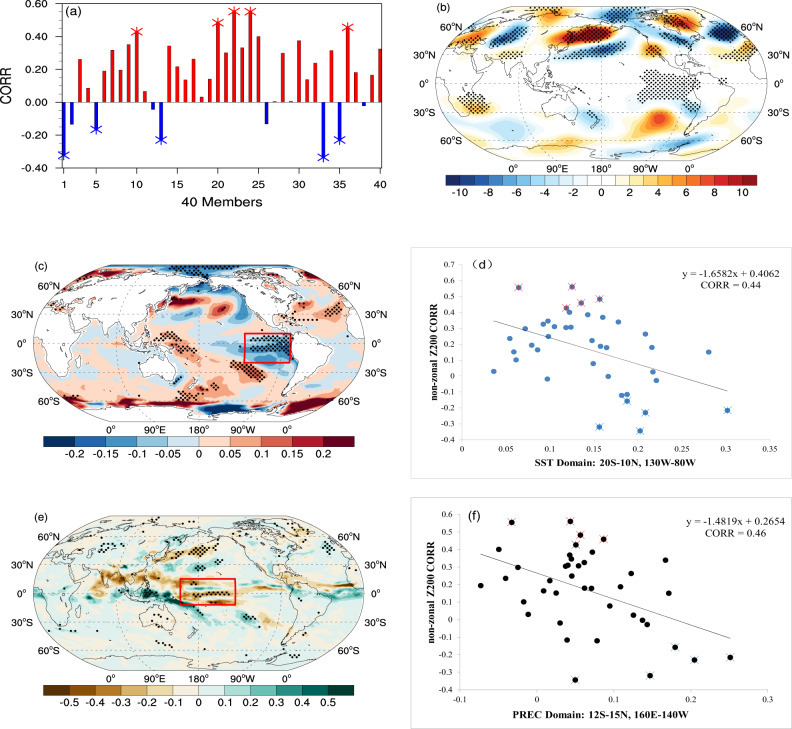
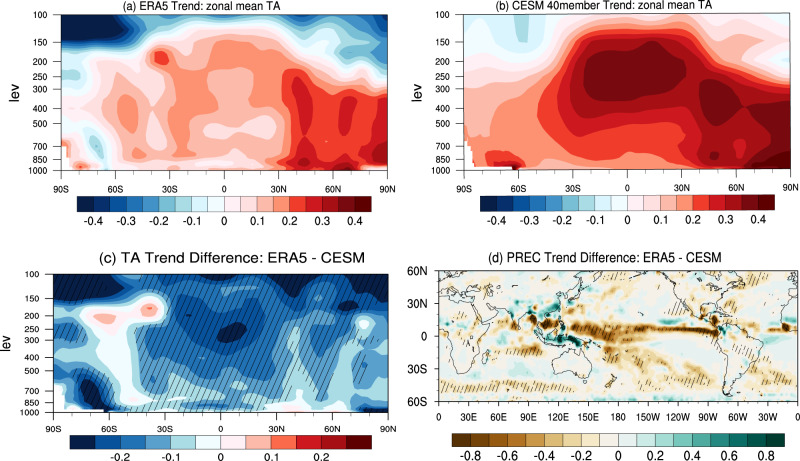
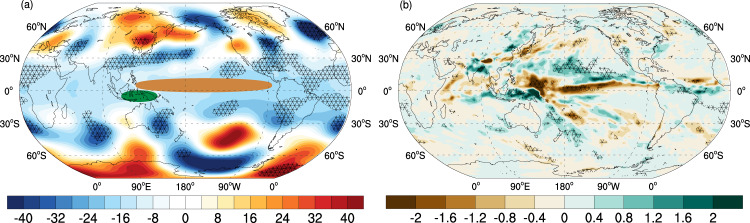
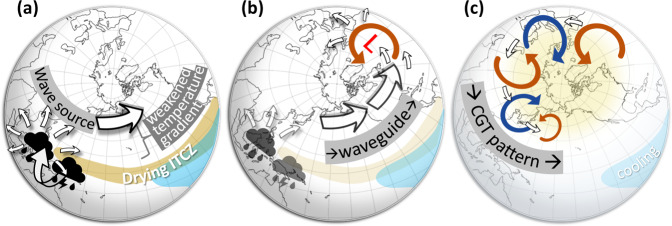
Consensus on the cause of recent midlatitude circulation changes toward a wavier manner in the Northern Hemisphere has not been reached, albeit a number of studies collectively suggest that this phenomenon is driven by global warming and associated Arctic amplification. Here, through a fingerprint analysis of various global simulations and a tropical heating-imposed experiment, we suggest that the suppression of tropical convection along the Inter Tropical Convergence Zone induced by sea surface temperature (SST) cooling trends over the tropical Eastern Pacific contributed to the increased summertime midlatitude waviness in the past 40 years through the generation of a Rossby-wave-train propagating within the jet waveguide and the reduced north-south temperature gradient. This perspective indicates less of an influence from the Arctic amplification on the observed mid-latitude wave amplification than what was previously estimated. This study also emphasizes the need to better predict the tropical Pacific SST variability in order to project the summer jet waviness and consequent weather extremes.


Conflict of interest statement

The authors declare no competing interests.

Figures

Fig. 1
Fig. 1. The recent increase in the wave amplitude of midlatitude circulation and concomitant global climate patterns.
Observed circulation and SST trends over the past 40 years: Linear trends of JJA a Z200 (unit: m/decade), b non-zonal Z200 (unit: m/decade), c V200 (unit: m/s/decade), d the zonal mean component of Z200 (unit: m/decade), e sea surface temperature (SST; unit: K/decade), f “non-global SST” (calculated as the SST pattern with the global mean SST removed in each grid; unit: K/decade), and g precipitation (unit: mm/day/decade) from 1979 to 2018 in observations. Z200 and V200 are the geopotential height and meridional wind at 200 hPa, respectively. The stippled areas indicate significant trends above the 95% confidence level.
Fig. 2
Fig. 2. External forcing alone cannot explain the observed wave amplification.
Circulation and SST trends over the past 40 years from the ensemble mean of the CESM-LE historical run: linear trends of JJA a Z200 (unit: m/decade), b non-zonal Z200 (unit: m/decade), c V200 (unit: m/s/decade), d the zonal mean component of Z200 (unit: m/decade), e SST (unit: K/decade), f non-global SST with the global mean SST removed in each grid (unit: K/decade), and g precipitation (unit: mm/day/decade) from 1979 to 2018 in the ensemble mean of CESM-LE historical simulations. The gray lines in d represent each of the 40 members and the black line is the ensemble mean with the observed one (in red) derived from Fig. 1d.
Fig. 3
Fig. 3. Simulated wavy pattern in the pseudo-ensemble of CESM-LE PI runs.
a spatial correlations (CORR) between non-zonal JJA Z200 trend derived from ERA5 over the past 40 years (1979-2018) and non-zonal Z200 trend over a 40-year period from each member of the pseudo-ensemble of CESM-LE PI simulation runs within the NH (20°N-60°N). The differences of b non-zonal Z200 (unit: m/decade), c SST (unit: K/decade), and d precipitation trends (PREC; unit: mm/day/decade) between the selected 23 positive (POSI) and 16 negative (NEGA) cases. The positive and negative cases (red and blue crosses in a) satisfy the following two conditions: (1) absolute values of the maximum and minimum spatial correlation coefficients are >0.4 and (2) the distances between any two adjacent members in each group (positive or negative) in the time axis are greater than 40 years. The cross-hatched areas in bd denote the significant differences between 23 positive and 16 negative cases based on the two-sample t-test, p < 0.05.
Fig. 4
Fig. 4. The circulation, SST, and precipitation trends over the past 40 years derived from CESM-LE 40-member historical simulation.
a spatial correlations between non-zonal JJA Z200 trend derived from ERA5 and CESM-LE 40-member historical simulation over the past 40 years (1979–2018) within the mid-high latitudes (20°N–60°N). The differences of b non-zonal Z200 (unit: m/decade), c SST (unit: K/decade), and e precipitation (unit: mm/day/decade) trends between the members with the five largest (red markers in a, d, and f) and five smallest (blue markers in a, d, and f) spatial correlations in a. d The scatter plot shows the relationship between domain-averaged SST in tropical eastern Pacific (20°S–10°N, 80°W–130°W) and spatial correlations in a. f The scatter plot shows the relationship between domain-averaged precipitation in the tropical West-Central Pacific (12°S–15°N, 160°E–140°W) and spatial correlations in a. The linear fitting lines and related correlation coefficients (CORR) are indicated in d and f, respectively. The stippled areas in b, c, and e denote the significant differences based on the two-sample t-test, p < 0.05.
Fig. 5
Fig. 5. The stark contrast between ensemble mean simulated and observed vertical temperature and precipitation trends in the tropics.
JJA zonal mean component of air temperature (TA) trend profile from a ERA5 (1979-2018, unit: K/decade) and b the ensemble mean of CESM-LE 40-member runs (1979-2018, unit: K/decade), respectively. c Differences of zonal mean TA trends between ERA5 and the ensemble mean of CESM-LE 40-member historical runs. d Differences of JJA precipitation (PREC) trends (60°S-60°N; unit: mm/day/decade) between ERA5 and the ensemble mean of CESM-LE. The hatched areas in c and d indicate the ERA5 trends lie outside two standard deviations away from the mean of the CESM-LE 40-member simulations.
Fig. 6
Fig. 6. Simulated global JJA Z200 and precipitation response to imposed diabatic heating anomalies in the tropics.
a The Z200 (unit: m) and b precipitation responses (mm/day) in the CESM1 to two additional heating sources added in tropical Western and Central Pacific. The green (10°S-0°, 110°E-150°E) and brown (0°-10°N, 120°E-80°W) color-filled ovals imposed in a denote the location where a pair of positive and negative heating sources are added in the CESM1. The cross-hatched areas in a and b denote the significant differences between the CTL and SEN experiments (Methods section) based on the two-sample t-test, p < 0.05.
Fig. 7
Fig. 7. A schematic diagram illustrating the mechanism.
The mechanism is comprised of three steps: Suppressed ITCZ convection and enhanced convection over the Maritime Continent trigger the formation of the CGT-like short-waves pattern along the jet stream (and other higher-latitude wave trains) by exciting strong local RWS over the Western North Pacific and weakening the pole-to-equator temperature gradient (step a); These changes will further trigger barotropic instability around the jet exit (step b) over the Northeast Atlantic and the establishment of the CGT over Eurasia (step c). See the main text for a more detailed description of the mechanism.

References

    1. Coumou D, Rahmstorf S. A decade of weather extremes. Nat. Clim. Change. 2012;2:491–496.
    1. Cvijanovic I, et al. Future loss of Arctic sea-ice cover could drive a substantial decrease in California’s rainfall. Nat. Commun. 2017;8:1947. - PMC - PubMed
    1. Cohen J, Pfeiffer K, Francis JA. Warm Arctic episodes linked with increased frequency of extreme winter weather in the United States. Nat. Commun. 2018;9:869. - PMC - PubMed
    1. Coumou D, Di Capua G, Vavrus S, Wang L, Wang S. The influence of Arctic amplification on mid-latitude summer circulation. Nat. Commun. 2018;9:2959. - PMC - PubMed
    1. A tug-of-war over the mid-latitudes. Nat. Commun. 10, 5578 (2019). - PMC - PubMed