. 2022 Mar 11;9(1):83.
doi: 10.1038/s41597-022-01196-7.

Global monthly gridded atmospheric carbon dioxide concentrations under the historical and future scenarios

Affiliations

Global monthly gridded atmospheric carbon dioxide concentrations under the historical and future scenarios

Wei Cheng et al. Sci Data. .

Abstract

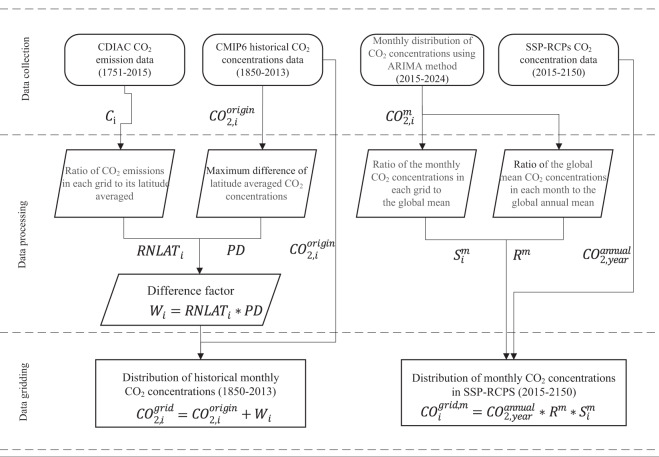
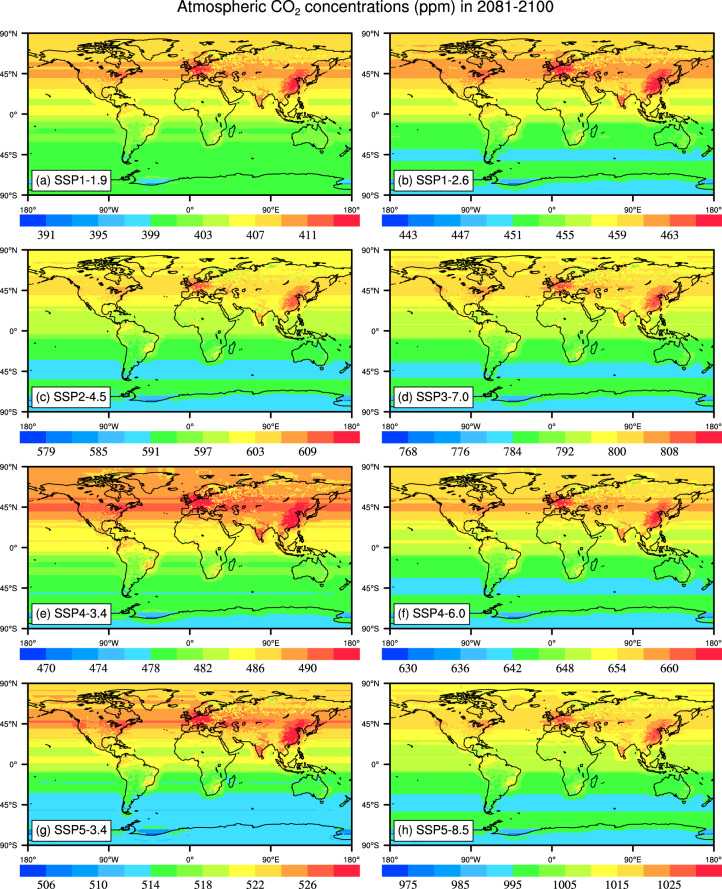
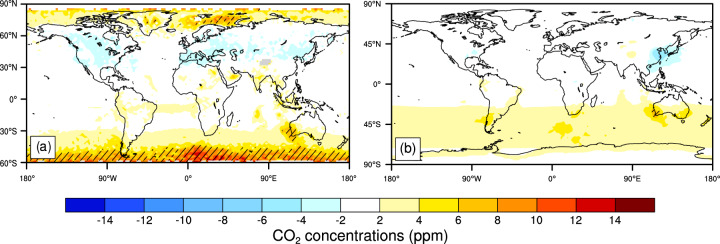
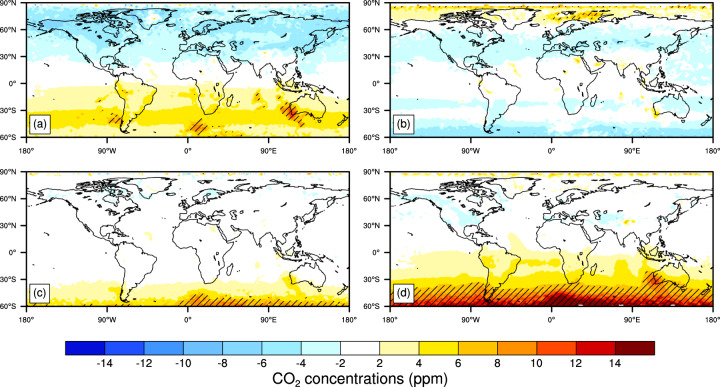
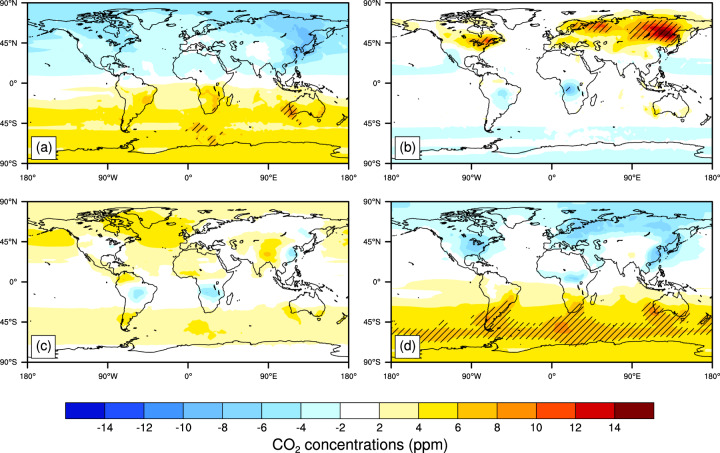
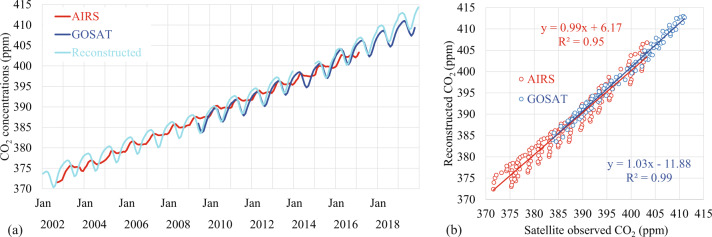
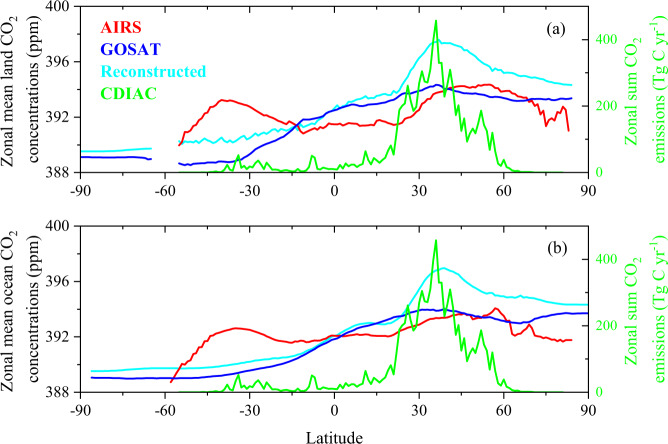
Increases in atmospheric carbon dioxide (CO2) concentrations is the main driver of global warming due to fossil fuel combustion. Satellite observations provide continuous global CO2 retrieval products, that reveal the nonuniform distributions of atmospheric CO2 concentrations. However, climate simulation studies are almost based on a globally uniform mean or latitudinally resolved CO2 concentrations assumption. In this study, we reconstructed the historical global monthly distributions of atmospheric CO2 concentrations with 1° resolution from 1850 to 2013 which are based on the historical monthly and latitudinally resolved CO2 concentrations accounting longitudinal features retrieved from fossil-fuel CO2 emissions from Carbon Dioxide Information Analysis Center. And the spatial distributions of nonuniform CO2 under Shared Socio-economic Pathways and Representative Concentration Pathways scenarios were generated based on the spatial, seasonal and interannual scales of the current CO2 concentrations from 2015 to 2150. Including the heterogenous CO2 distributions could enhance the realism of global climate modeling, to better anticipate the potential socio-economic implications, adaptation practices, and mitigation of climate change.


Conflict of interest statement

The authors declare no competing interests.

Figures

Fig. 1
Fig. 1
The processes for CO2 concentrations distributions reconstruction in the historical period and future scenarios.
Fig. 2
Fig. 2
The maps of global historical atmospheric CO2 concentrations (ppm) averaged during 1890–1989 (Top) and averaged during 2004–2013 (Bottom).
Fig. 3
Fig. 3
The maps of seasonal atmospheric CO2 concentrations (ppm) averaged during 1890–1989 (a) and averaged during 2004–2013 (b) in these March-April-May (MAM), June-July-August (JJA), September-October-November (SON), and December-January-February (DJF).
Fig. 4
Fig. 4
The maps of global atmospheric CO2 concentrations (ppm) averaged during 2041–2060 in the SSP1-1.9, SSP1-2.6, SSP2-4.5, SSP3-7.0, SSP4-3.4, SSP4-6.0, SSP5-3.4 and SSP5-8.5 scenarios. The period of 2041–2060 selected is for the average state in the middle of this century, the key time for carbon neutrality.
Fig. 5
Fig. 5
The maps of global atmospheric CO2 concentrations (ppm) averaged during 2081–2100 in the SSP1-1.9, SSP1-2.6, SSP2-4.5, SSP3-7.0, SSP4-3.4, SSP4-6.0, SSP5-3.4 and SSP5-8.5 scenarios. The period of 2081–2100 in the Fig. 5 chosen is for the average state at the end of this century.
Fig. 6
Fig. 6
Changes in CO2 concentrations (ppm) between the reconstructed and AIRS (a) averaged during 2003–2016 (excluding 2014), and between the reconstructed and GOSAT (b) averaged during 2010–2018 (excluding 2014). The time periods selected are decided by data available. Hatched areas are regions where changes are statistically significant at the 5% level using the Student’s t test.
Fig. 7
Fig. 7
Changes in the seasonal (a, MAM; b, JJA; c, SON; d, DJF) CO2 concentrations (ppm) between the reconstructed and the AIRS product averaged during 2003–2016 (excluding 2014). The time period selected is decided by data available. Hatched areas are regions where changes are statistically significant at the 5% level using the Student’s t test.
Fig. 8
Fig. 8
Changes in the seasonal (a, MAM; b, JJA; c, SON; d, DJF) CO2 concentrations (ppm) between the reconstructed and the GOSAT product averaged during 2010–2018 (excluding 2014). The time period selected is decided by data available. Hatched areas are regions where changes are statistically significant at the 5% level using the Student’s t test.
Fig. 9
Fig. 9
Monthly global mean time evolution of CO2 concentrations (ppm) for the AIRS (red, from Jan 2003 to Feb 2017), the GOSAT (blue, from Jun 2009 to oct 2017), and the reconstructed data (cyan) from 2003 to 2017 (a); and scatter plot between the monthly global mean reconstructed data, and the AIRS (red) and the GOSAT (blue), respectively averaged during 2010–2016 (b). The reconstructed CO2 data from 2010–2013 and 2015–2017 compared here is from the historical and the SSP5-8.5 reconstructions, respectively.
Fig. 10
Fig. 10
Zonal mean CO2 concentrations (ppm) averaged over land (a) and over ocean (b) for the AIRS, the GOSAT, and the reconstructed data during 2010 to 2013. Zonal sum fossil-fuel CO2 emissions (Tg C yr−1) are also showed using the right y axis in each panel from Carbon Dioxide Information Analysis Center (CDIAC) averaged during 2010 to 2013.

References

    1. Cao L, et al. The Global Spatiotemporal Distribution of the Mid-Tropospheric CO2 Concentration and Analysis of the Controlling Factors. Remote Sens. 2019;11:94. doi: 10.3390/rs11010094. - DOI
    1. Lei L, et al. A comparison of atmospheric CO2 concentration GOSAT-based observations and model simulations. Sci. China-Earth Sci. 2014;57:1393–1402. doi: 10.1007/s11430-013-4807-y. - DOI
    1. Kuang Z, Margolis J, Toon G, Crisp D, Yung Y. Spaceborne measurements of atmospheric CO2 by high-resolution NIR spectrometry of reflected sunlight: An introductory study. Geophys. Res. Lett. 2002;29:11-1–11–4. doi: 10.1029/2001GL014298. - DOI
    1. Kuze A, Suto H, Nakajima M, Hamazaki T. Thermal and near infrared sensor for carbon observation Fourier-transform spectrometer on the Greenhouse Gases Observing Satellite for greenhouse gases monitoring. Appl. Optics. 2009;48:6716–6733. doi: 10.1364/AO.48.006716. - DOI - PubMed
    1. Yang D, et al. The First Global Carbon Dioxide Flux Map Derived from TanSat Measurements. Adv. Atmos. Sci. 2021;38:1433–1443. doi: 10.1007/s00376-021-1179-7. - DOI