. 2022 Mar 11;12(1):4284.
doi: 10.1038/s41598-022-08231-y.

Searching for optimal machine learning model to classify mild cognitive impairment (MCI) subtypes using multimodal MRI data

Affiliations

Searching for optimal machine learning model to classify mild cognitive impairment (MCI) subtypes using multimodal MRI data

Tatsuya Jitsuishi et al. Sci Rep. .

Abstract

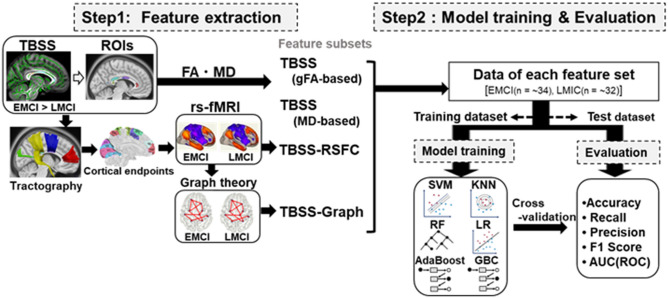
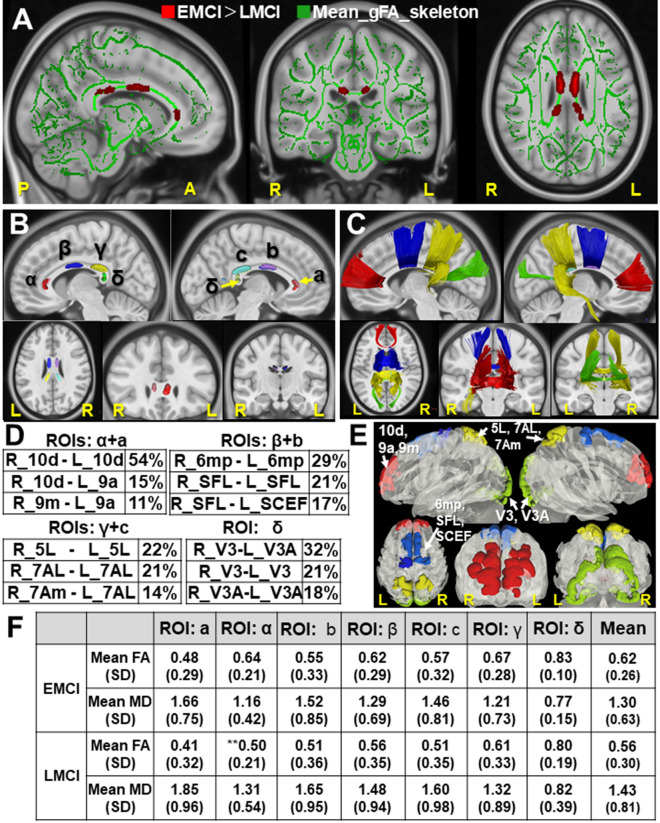
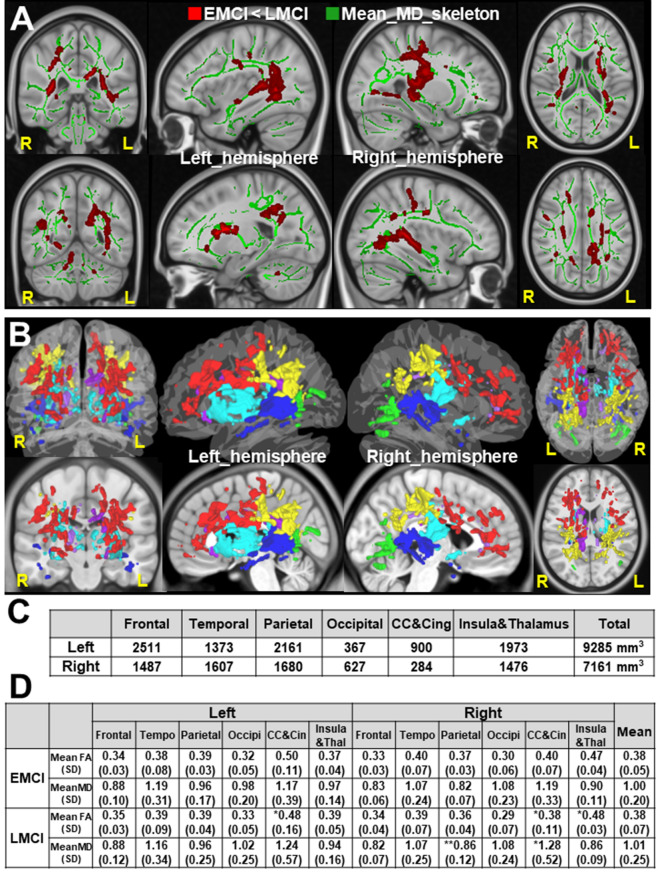
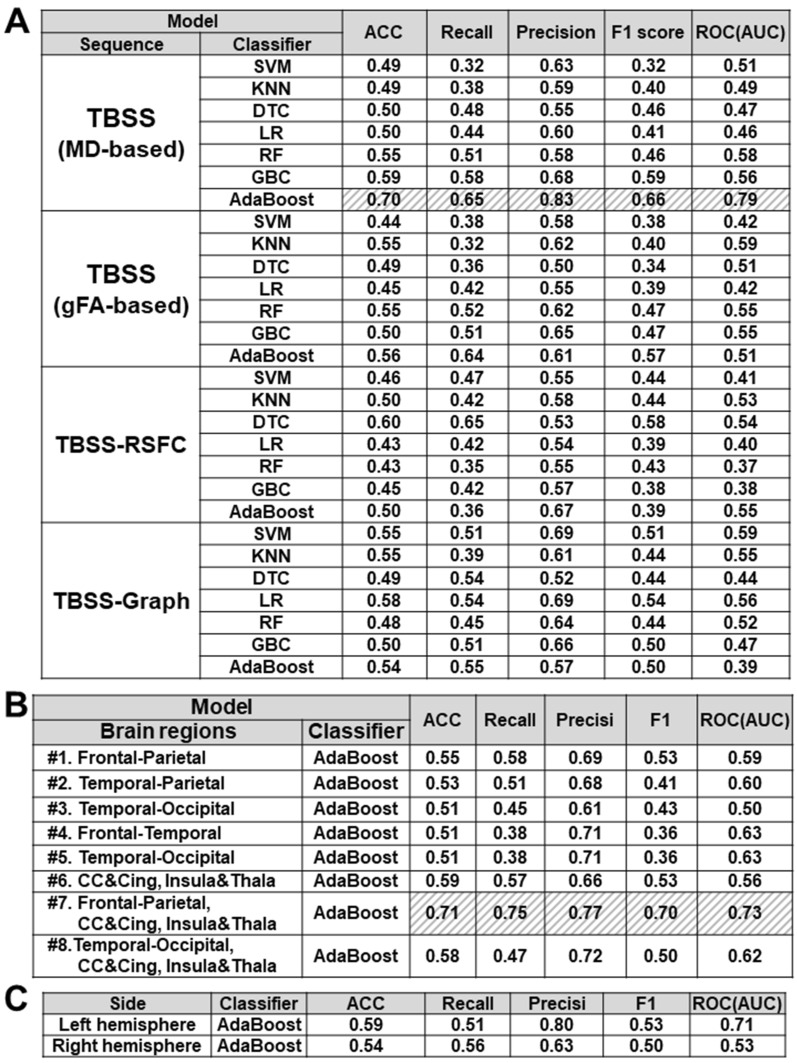
The intervention at the stage of mild cognitive impairment (MCI) is promising for preventing Alzheimer's disease (AD). This study aims to search for the optimal machine learning (ML) model to classify early and late MCI (EMCI and LMCI) subtypes using multimodal MRI data. First, the tract-based spatial statistics (TBSS) analyses showed LMCI-related white matter changes in the Corpus Callosum. The ROI-based tractography addressed the connected cortical areas by affected callosal fibers. We then prepared two feature subsets for ML by measuring resting-state functional connectivity (TBSS-RSFC method) and graph theory metrics (TBSS-Graph method) in these cortical areas, respectively. We also prepared feature subsets of diffusion parameters in the regions of LMCI-related white matter alterations detected by TBSS analyses. Using these feature subsets, we trained and tested multiple ML models for EMCI/LMCI classification with cross-validation. Our results showed the ensemble ML model (AdaBoost) with feature subset of diffusion parameters achieved better performance of mean accuracy 70%. The useful brain regions for classification were those, including frontal, parietal lobe, Corpus Callosum, cingulate regions, insula, and thalamus regions. Our findings indicated the optimal ML model using diffusion parameters might be effective to distinguish LMCI from EMCI subjects at the prodromal stage of AD.


Conflict of interest statement

The authors declare no competing interests.

Figures

Figure 1
Figure 1
Flow chart representing Machine learning (ML) approach for EMCI/LMCI classification. The flow chart represents the framework of machine learning (ML) algorithm for EMCI/LMCI classification. Step1 consists of feature extraction by multi-modal methods, including TBSS, tractography, RSFC, and graph theory. Step 2 consists of ML models (SVM, KNN, LR, DTC, RF, GBC, AdaBoost) with tenfold cross-validation (CV). The dataset was divided into training and test dataset for tenfold CV, calculating the mean ‘accuracy (ACC)’, ‘recall’, ‘precision’, ‘F1 score’, and ‘AUC(ROC)’. MCI mild cognitive impairment, EMCI early MCI, LMCI late MCI, FA fractional anisotropy, MD mean diffusivity, TBSS Tract-based spatial statistics, RSFC resting-state functional connectivity, CV cross-validation, ROI range of interest, ML Machine learning, KNN k-nearest neighbor algorithm, LR Logistic Regression, DTC Decision Tree Classification, RF Random Forest, SVM support vector machine, GBC gradient boosting classifier, AdaBoost Adaptive Boosting, ACC accuracy, ROC Receiver operating characteristic, AUC Area under the curve.
Figure 2
Figure 2
Sequential integration of TBSS and Tractography analyses. (A) The gFA (generalized fractional anisotropy)-based TBSS projects all subjects' gFA data onto a mean gFA tract skeleton before applying voxelwise cross-subject statistics (EMCI vs. LMCI). The registered average subjects’ gFA tract skeleton is represented in green, while LMCI-related white matter changes were represented in red color. The mean gFA tract skeleton was overlaid on the sagittal, coronal, and axial T1-weighted MRI image (ICBM average brain). Left; sagittal view of the left hemisphere, Middle; coronal section, Right; axial view. Significance level was p < 0.05 (EMCI vs. LMCI, Threshold Free Cluster Enhancement and Family-Wise Error corrected). (B) The ROIs for fiber tracking, identified as white matter alterations by gFA-based TBSS (EMCI vs. LMCI), were shown overlaid on the sagittal, axial, and coronal T1-weighted MRI image (ICBM average brain), respectively. The α, β, γ, and δ indicate the ROIs in the Corpus Callosum of the left hemisphere, while the a, b, and c indicate those in the right hemisphere. (C) Tractogram, using the altered white matter regions as ROIs, was shown overlaid on the sagittal, axial, and coronal T1-weighted MRI image (ICBM average brain), respectively. The streamlines passing through the ROIs (α, a), ROIs (β, b), ROIs (γ, c), and ROI (δ), were shown in red, blue, yellow, and green, respectively. (D) The tables show the top 3 of cortical areas (%, number of streamlines/total of each tract) identified by endpoint analyses, into which the callosal fibers project inter-hemispherically. (E) Cortical areas used for TBSS-RSFC and TBSS-Graph method, overlaid on the 3D glass brain (HCP1065). The regions in red are cortical areas in the frontal lobe (i.e. 10d, 9a, 9m), those in blue are in the precentral region (i.e. 6mp, SFL, SCEF), those in yellow are in the parietal lobe (i.e. 5L, 7AL, 7Am), and those in green are in the occipital lobe (i.e. V3, V3A). (F) The table shows mean diffusion parameters (mean FA, MD) in each ROI of LMCI-related white matter changes, which were sub-classed into the ROI of α, a, β, b, γ, c, and δ. **p < 0.05 (EMCI vs. LMCI, t-test). Statistical data are in Supplementary Fig. S3. FA fractional anisotropy, MD mean diffusivity, TBSS Tract-based spatial statistics, ML machine learning, MCI mild cognitive impairment, EMCI early MCI, LMCI late MCI, RSFC resting-state functional connectivity, ROI range of interest, SD standard deviation.
Figure 3
Figure 3
MD-based TBSS and Altered white matter regions. (A) The MD-based TBSS projects all subjects' MD data onto a mean MD tract skeleton before applying voxelwise cross-subject statistics (EMCI vs. LMCI). The registered average subjects’MD tract skeleton is represented in green, while LMCI-related white matter changes were represented in red color. The MD tract skeleton was overlaid on the coronal, sagittal, and axial T1-weighted MRI image (ICBM average brain). Left; coronal view, Middle; sagittal view of left and right hemisphere, Right; axial view. Significance level was p < 0.05 (Threshold Free Cluster Enhancement and Family-Wise Error corrected). (B) The LMCI-related white matter changes, identified by MD-based TBSS (EMCI vs. LMCI), were shown overlaid on the 3D glass average brain (upper images) and T1-weighted MRI image (lower images), respectively. The regions in the frontal, parietal, temporal, occipital lobe, Corpus Callosum (CC) and cingulum, and insula and thalamus regions were shown in red, yellow, blue, green, purple, and sky blue respectively. (C) The table shows the total volume (mm3) for LMCI-related white matter changes in each hemisphere by MD-based TBSS, which were sub-classed into frontal, temporal, parietal, occipital lobe, Corpus Callosum (CC) and cingulum (Cing), and insula and thalamus regions. (D) The table show mean diffusion parameters (mean FA and MD) in each ROI for LMCI-related white matter changes, which were sub-classed into frontal, temporal, parietal, occipital lobe, Corpus Callosum (CC) and cingulum (Cin), and insula and thalamus regions. *p < 0.1, **p < 0.05 (EMCI vs. LMCI, t-test). Statistical data are in Supplementary Fig. S3. FA fractional anisotropy, MD mean diffusivity, TBSS Tract-based spatial statistics, CC Corpus Callosum, MCI mild cognitive impairment, EMCI early MCI, LMCI late MCI.
Figure 4
Figure 4
EMCI/LMCI classification performance in ML models with feature subsets. (A) The table indicates the EMCI/LMCI classification performance of ML models (SVM, KNN, DTC, LR, RF, GBC, AdaBoost), using four feature subsets by gFA-based TBSS, MD-based TBSS, TBSS-RSFC, and TBSS-Graph method. The performance was assessed by measuring mean accuracy (ACC), recall, mean precision, F1 score, and AUC (ROC). (B) The useful brain regions for EMCI/LMCI classification. With features extracted from each combination of brain regions, the classification performance of AdaBoost was evaluated by measuring mean accuracy (ACC), recall, mean precision, F1 score, and AUC (ROC). The brain regions were subclassified into each combination of #1. Frontal and Parietal lobe, #2. Temporal and Parietal lobe, #3. Temporal and Occipital lobe, #4. Frontal and Temporal lobe, #5. Temporal and Occipital lobe, #6.CC&Cing, Insula& Thalamus regions, #7. Frontal and Parietal lobe, Corpus Callosum (CC) and cingulum (Cing), and Insula and Thalamus regions. (C) The useful brain hemisphere for EMCI/LMCI classification. With features extracted from the right or left hemisphere, the classification performance of AdaBoost was evaluated by measuring mean accuracy (ACC), recall, mean precision, F1 score, and AUC (ROC). RSFC resting-state functional connectivity, ROI range of interest, ML Machine learning, SVM support vector machine, KNN k-nearest neighbor algorithm, LR Logistic Regression, DTC decision tree classifier, RF Random Forest, GBC gradient boosting classifier, ACC accuracy, AUC Area under the curve, ROC Receiver operating characteristic, CC Corpus Callosum.

Similar articles

Cited by

References

    1. Morris JC, et al. Mild cognitive impairment represents early-stage Alzheimer disease. Arch. Neurol. 2001;58:397–405. - PubMed
    1. Sperling RA, et al. Toward defining the preclinical stages of Alzheimer’s disease: Recommendations from the National Institute on Aging-Alzheimer’s Association workgroups on diagnostic guidelines for Alzheimer’s disease. Alzheimers Dement. J. Alzheimers Assoc. 2011;7:280–292. - PMC - PubMed
    1. Alzheimer’s Disease Facts and Figures Alzheimers dement. J. Alzheimers Assoc. 2021;17:327–406. - PubMed
    1. Jessen F, et al. AD dementia risk in late MCI, in early MCI, and in subjective memory impairment. Alzheimers Dement. J. Alzheimers Assoc. 2014;10:76–83. - PubMed
    1. Aisen PS, et al. Clinical core of the Alzheimer’s Disease Neuroimaging Initiative: Progress and plans. Alzheimers Dement. J. Alzheimers Assoc. 2010;6:239–246. - PMC - PubMed

Publication types

MeSH terms