. 2022 Mar 11;12(1):4304.
doi: 10.1038/s41598-022-08357-z.

A computational study of red blood cell deformability effect on hemodynamic alteration in capillary vessel networks

Affiliations

A computational study of red blood cell deformability effect on hemodynamic alteration in capillary vessel networks

Saman Ebrahimi et al. Sci Rep. .

Abstract

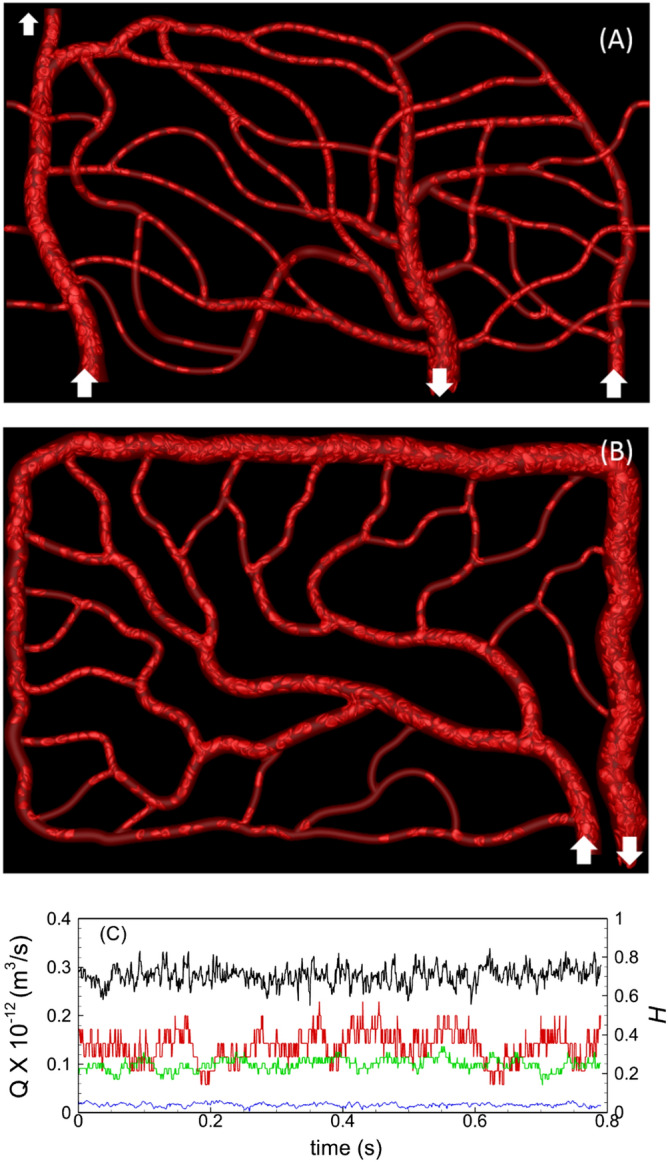
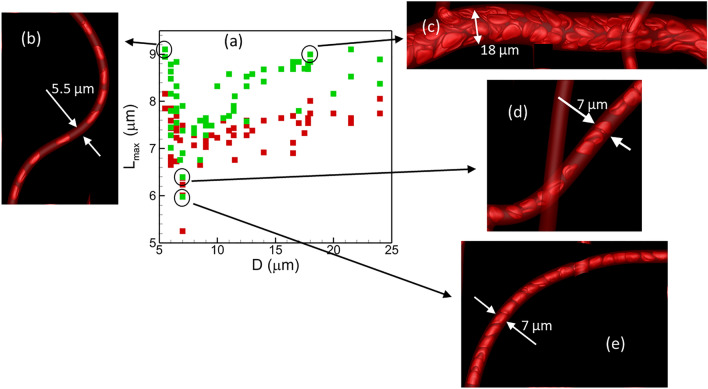
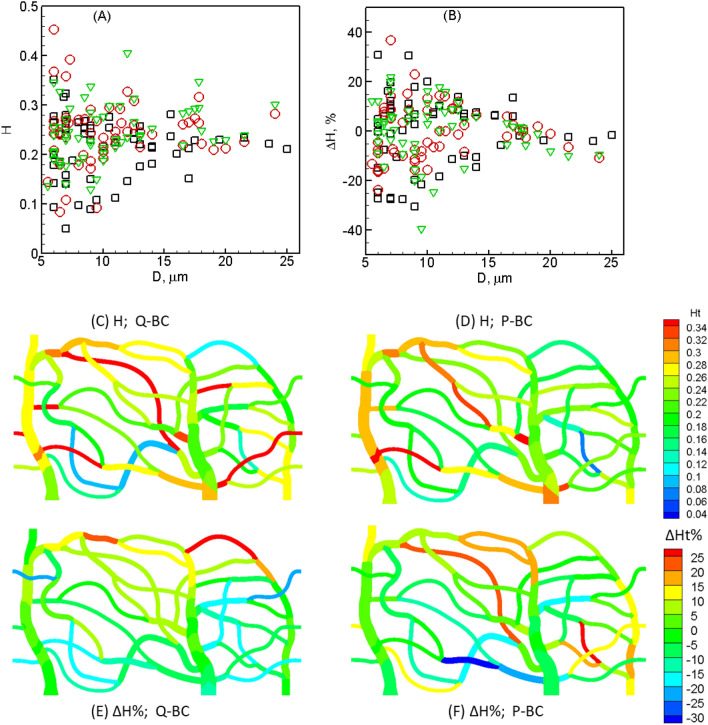
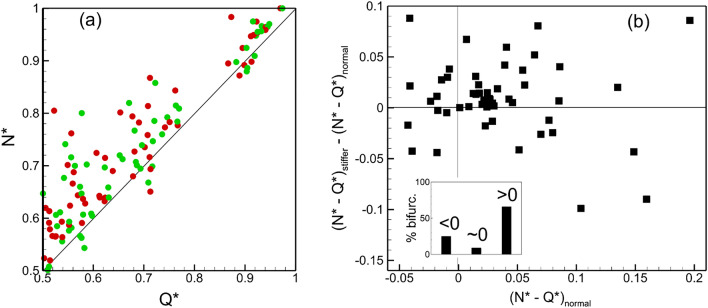
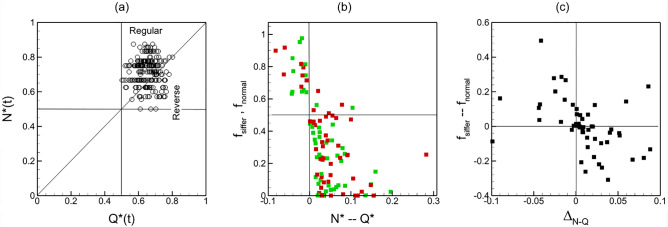
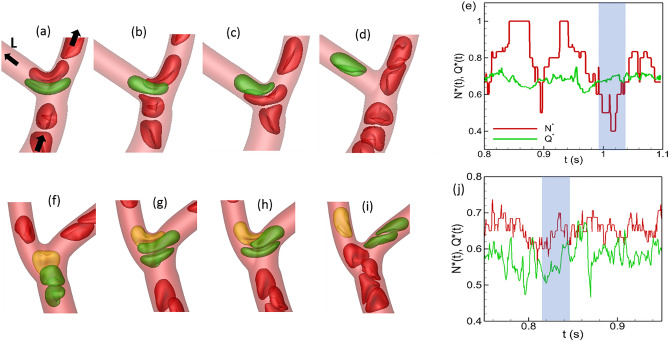
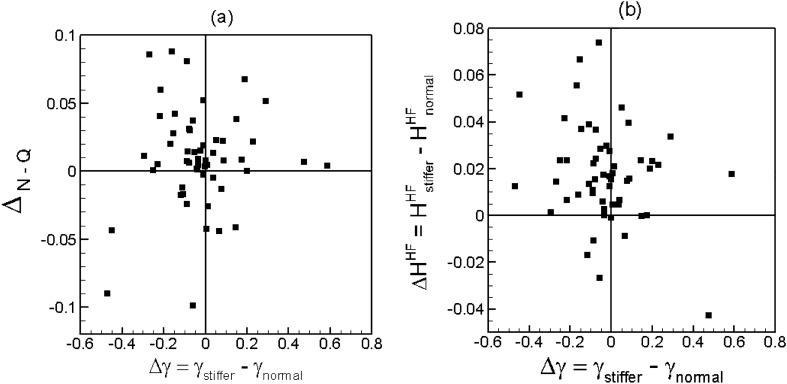
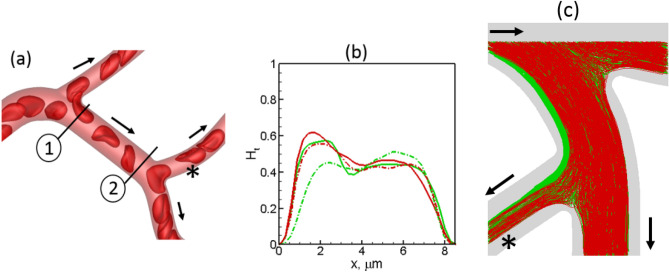
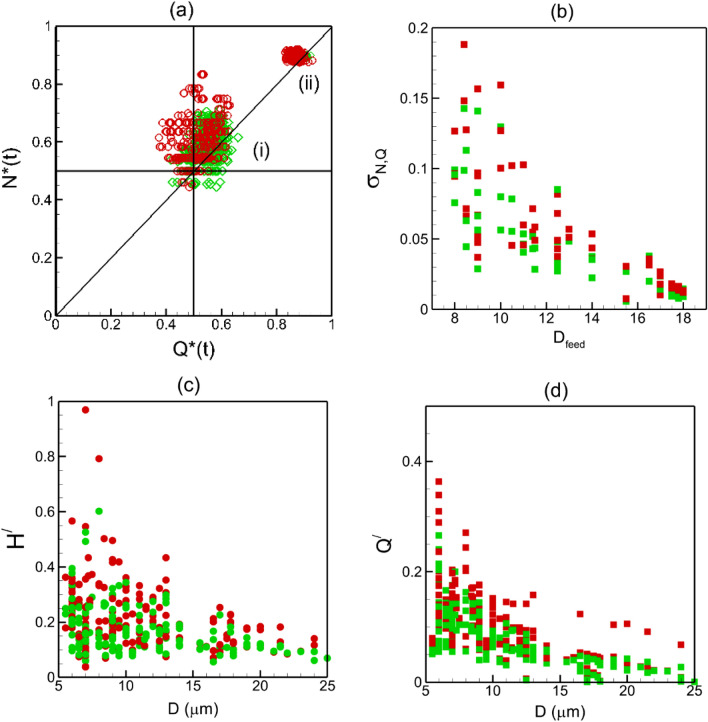
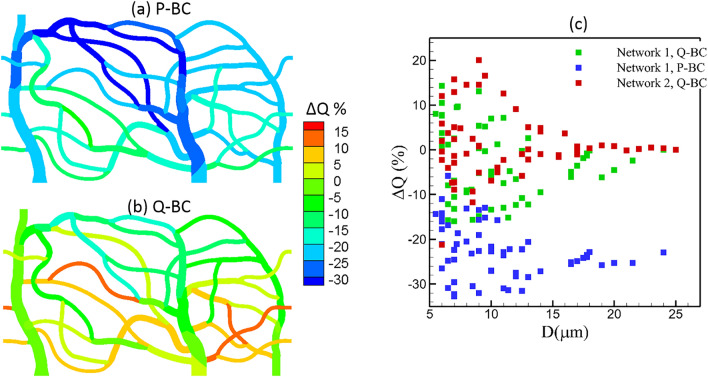
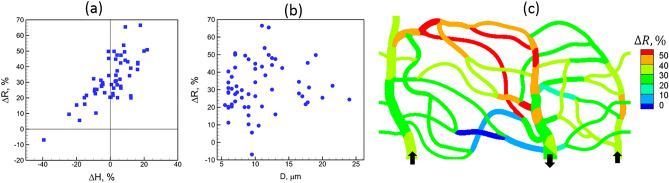
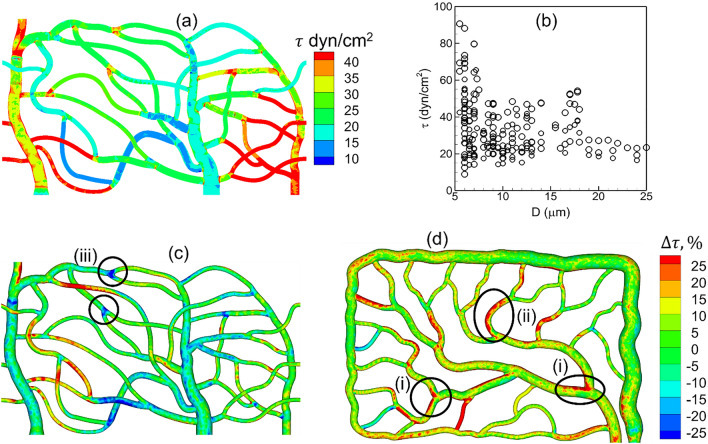
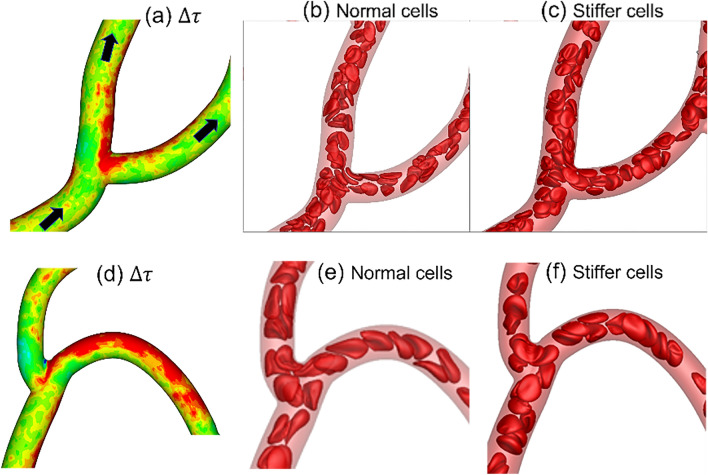
Capillary blood vessels, the smallest vessels in the body, form an intricate network with constantly bifurcating, merging and winding vessels. Red blood cells (RBCs) must navigate through such complex microvascular networks in order to maintain tissue perfusion and oxygenation. Normal, healthy RBCs are extremely deformable and able to easily flow through narrow vessels. However, RBC deformability is reduced in many pathological conditions and during blood storage. The influence of reduced cell deformability on microvascular hemodynamics is not well established. Here we use a high-fidelity, 3D computational model of blood flow that retains exact geometric details of physiologically realistic microvascular networks, and deformation of every one of nearly a thousand RBCs flowing through the networks. We predict that reduced RBC deformability alters RBC trafficking with significant and heterogeneous changes in hematocrit. We quantify such changes along with RBC partitioning and lingering at vascular bifurcations, perfusion and vascular resistance, and wall shear stress. We elucidate the cellular-scale mechanisms that cause such changes. We show that such changes arise primarily due to the altered RBC dynamics at vascular bifurcations, as well as cross-stream migration. Less deformable cells tend to linger less at majority of bifurcations increasing the fraction of RBCs entering the higher flow branches. Changes in vascular resistance also seen to be heterogeneous and correlate with hematocrit changes. Furthermore, alteration in RBC dynamics is shown to cause localized changes in wall shear stress within vessels and near vascular bifurcations. Such heterogeneous and focal changes in hemodynamics may be the cause of morphological abnormalities in capillary vessel networks as observed in several diseases.


Conflict of interest statement

The authors declare no competing interests.

Figures

Figure 1
Figure 1
(A,B) Representative instantaneous visualizations showing RBC flow and distribution in networks A and B. Arrows indicate inlets/outlets. (C) Flow rates (Q, black, blue) and hematocrits (H, red, green) in two representative vessels are shown to indicate the flow reached a quasi-steady state.
Figure 2
Figure 2
(a) Average cell length in each vessel as a function of vessel diameter for normal (green) and stiffer (red) cells. (be) show cell shape in vessels of different diameters. Vessels in (d,e) have same diameter but different hematocrit, 0.22 and 0.37, respectively.
Figure 3
Figure 3
(A) Time-averaged hematocrit H for normal cells in each vessel of both networks and for all boundary conditions (O—network A, flow-rate condition; —network A, pressure condition; —network B, flow-rate condition). (B) Hematocrit change ΔH in each vessel caused by reduced deformability. (C,D) Map of H in network A for flow-rate (Q) and pressure (P) boundary conditions. (E,F) Map of ΔH.
Figure 4
Figure 4
(a) RBC partitioning at each bifurcation in the two networks for both boundary conditions. Green and red circles represent normal and stiffer cells, respectively. (b) Change in RBC partitioning defined as ΔN-Q=(N-Q)stiffer-(N-Q)normal. Inset shows % of total bifurcations for which ΔN-Q<0,0, or >0.
Figure 5
Figure 5
(a) Time-dependent partitioning at one selected bifurcation in a simulated network. Each data point represents an average over 0.1 s time window. (b) Fraction of time that the time-dependent partition is reverse at a bifurcation for normal (fnormal, green symbols) and stiffer (fstiffer, red symbols) cells. (c) Effect of cell deformability on frequency of time-dependent reverse partitioning, computed as fstiffer-fnormal, versus the change in time-average partitioning ΔN-Q.
Figure 6
Figure 6
Alteration of time-dependent partitioning by cell lingering at a bifurcation. (ae): A time-dependent reverse partitioning is caused by a cell momentarily blocking the higher flow rate branch of a bifurcation (right branch), causing a drop in N(t) below Q(t) in the time window marked by shading. (fj) A lingering cell (yellow) blocking the lower flow rate branch (left branch) causing a time-dependent regular partitioning (shaded region).
Figure 7
Figure 7
(a) Change in RBC partitioning ΔN-Q versus change in the fraction of lingering RBCs Δγ. (b) Change in hematocrit ΔHHF=HHFstiffer-HHFnormal in the higher flow rate daughter vessel of a bifurcation versus Δγ.
Figure 8
Figure 8
Additional mechanisms of hematocrit change. (a,b) Deformability causes a center-ward migration of RBCs, reducing the skewness of hematocrit profile more for normal cells than for stiffer cells. Hematocrit profiles at locations 1 (solid lines) and 2 (dash-dot lines) are shown in (b) for normal (green) and stiffer (red) RBCs. Nearly 30% increase in H occurs by this mechanism in the vessel marked by*. (c) Vessel curvature effect. Trajectories of normal (green) and stiffer (red) RBCs are shown. Curvature effect causes a faster migration of more deformation cells toward the inner side of the vessel with the higher curvature. For the bifurcation selected here, this causes a smaller number of stiffer cells entering the vessel marked by *. Arrows indicate flow direction.
Figure 9
Figure 9
(a) Scatter of time-dependent partitioning for two different bifurcations: (i) smaller feeding capillary vessel (Dfeed=8.5 μ m) bifurcating to nearly similar daughter vessels (6.5 μ m) in Y-shape. (ii) larger feeder vessel (Dfeed=17.5 μ m) having a smaller side branch (6 μ m). Green and red indicate normal and stiffer cells, respectively. (b) Standard deviation σN,Q of time-dependent partitioning w.r.t. the average as a function of feeder diameter. (c,d) Coefficient of variation of time-dependent hematocrit and flow rate, respectively, in each vessel as a function vessel diameter.
Figure 10
Figure 10
(a,b), Change is perfusion ΔQ = (Qstiffer—Qnormal)/Qnormal in network 1 obtained from simulations with pressure (P-BC) and flow rate boundary conditions (Q-BC). (c) ΔQ as a function of vessel diameter from all simulations.
Figure 11
Figure 11
(a) Percentage change in flow resistance per vessel against percentage change in hematocrit. (b) Percentage change in flow resistance against vessel diameter. (c) Distribution of ΔR across the network.
Figure 12
Figure 12
(a) 3D distribution of time-averaged WSS for normal RBCs. (b) Spatially averaged WSS per vessel in all simulations with normal RBCs. (c,d) relative change of WSS with stiffer cells. Regions showing local change in WSS are marked; (i) WSS increased at bifurcations, (ii) WSS increased in curved vessels, (iii) WSS decreased near bifurcations.
Figure 13
Figure 13
(ac) Cellular-scale mechanism by which WSS increased near the apex of a bifurcation in presence of stiffer cells. (df) Mechanism by which WSS increased along the side of the vessel that has the higher radius of curvature. For (a,d) the color range is same as that in Fig. 12d.

Similar articles

Cited by

References

    1. Beare JE, Curtis-Whitchurch L, LeBlanc AJ, Hoying JB. Microvasculature in health and disease. In: Vasan RS, Sawyer DB, editors. Encyclopedia of Cardiovascular Research and Medicine. Elsevier; 2018. pp. 349–364.
    1. Blinder P, Tsai PS, Kaufhold JP, Knutsen PM, Suhl H, Kleinfeld D. The cortical angiome: An interconnected vascular network with noncolumnar patterns of blood flow. Nat. Neurosci. 2013;16:889–897. - PMC - PubMed
    1. Couturier A, Mane V, Bonnin S, Erginay A, Massin P, et al. Capillary plexus anomalies in diabetic retinopathy on optical coherence tomography angiography. Retina. 2015;35:2384–3239. - PubMed
    1. Cheung ATW, Chen PCY, Larkin EC, Duong PL, Ramanujan S, et al. Microvascular abnormalities in sickle cell disease: A computer-assisted intravital microscopy study. Blood. 2002;99:3999–4005. - PubMed
    1. Cheung CY, Zheng Y, Hsu W, Lee ML, Lau QP, et al. Retinal vascular tortuosity, blood pressure, and cardiovascular risk factors. Ophthalmology. 2011;118:812–818. - PubMed

Publication types