

doi: 10.1038/s41592-022-01415-4.
MITI minimum information guidelines for highly multiplexed tissue images
Collaborators,
Affiliations
- PMID: 35277708
- PMCID: PMC9009186
- DOI: 10.1038/s41592-022-01415-4
Item in Clipboard
MITI minimum information guidelines for highly multiplexed tissue images
Nat Methods.
2022 Mar.
Abstract
The imminent release of tissue atlases combining multi-channel microscopy with single cell sequencing and other omics data from normal and diseased specimens creates an urgent need for data and metadata standards that guide data deposition, curation and release. We describe a Minimum Information about highly multiplexed Tissue Imaging (MITI) standard that applies best practices developed for genomics and other microscopy data to highly multiplexed tissue images and traditional histology.
Figures
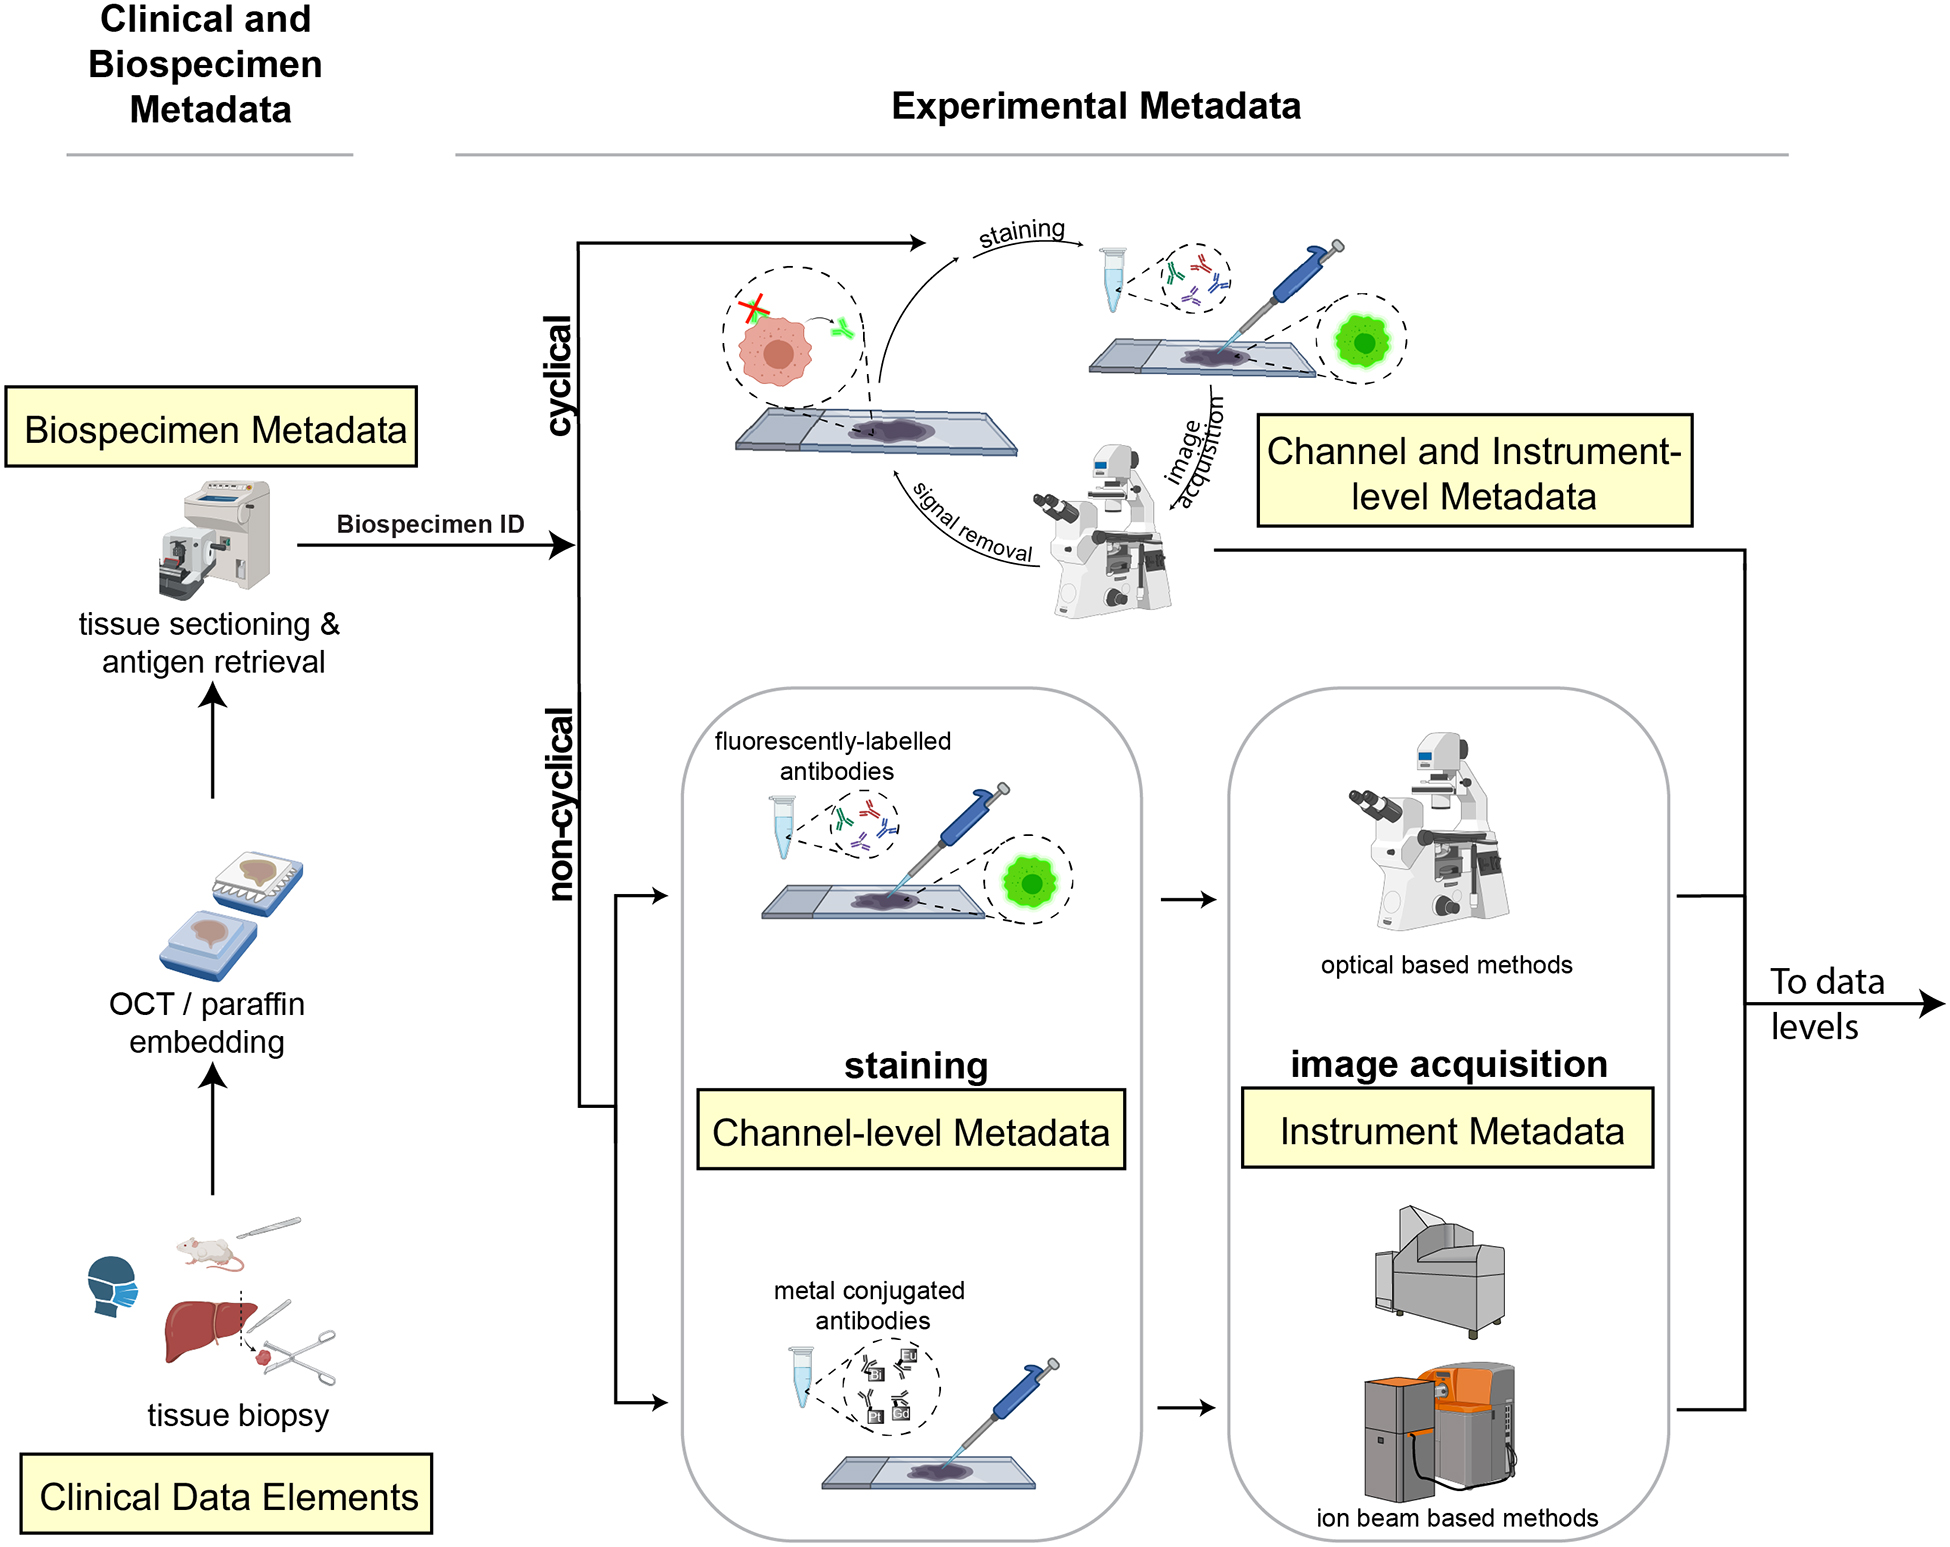
In a typical workflow, samples collected from patient biopsies and resections or from animal models are formaldehyde fixed and paraffin embedded (FFPE) or frozen and then sectioned and mounted onto either a standard glass microscope slide (for CyCIF, mIHC, IMC, MELC or mxIF), fluidic chamber (for CODEX) or specialized carriers (for MIBI). Clinical and biospecimen metadata (extracted from clinical records, for example) is linked to all other levels of metadata via a unique ID (Biospecimen ID). Data is acquired using cyclical or non-cyclical staining and imaging methods and both reagent and experimental metadata collected (consisting of antibody, reagent and instrument metadata). In both cyclic and non-cyclic methods, sections undergo pre-processing, antigen retrieval, and antibody incubation and images are acquired. In cyclical imaging methods, fluorophores or chromogens are inactivated or removed and additional antibodies and/or visualization reagents are applied and data acquisition repeated. Channel and instrument metadata capture these essential details. Created with BioRender.com .
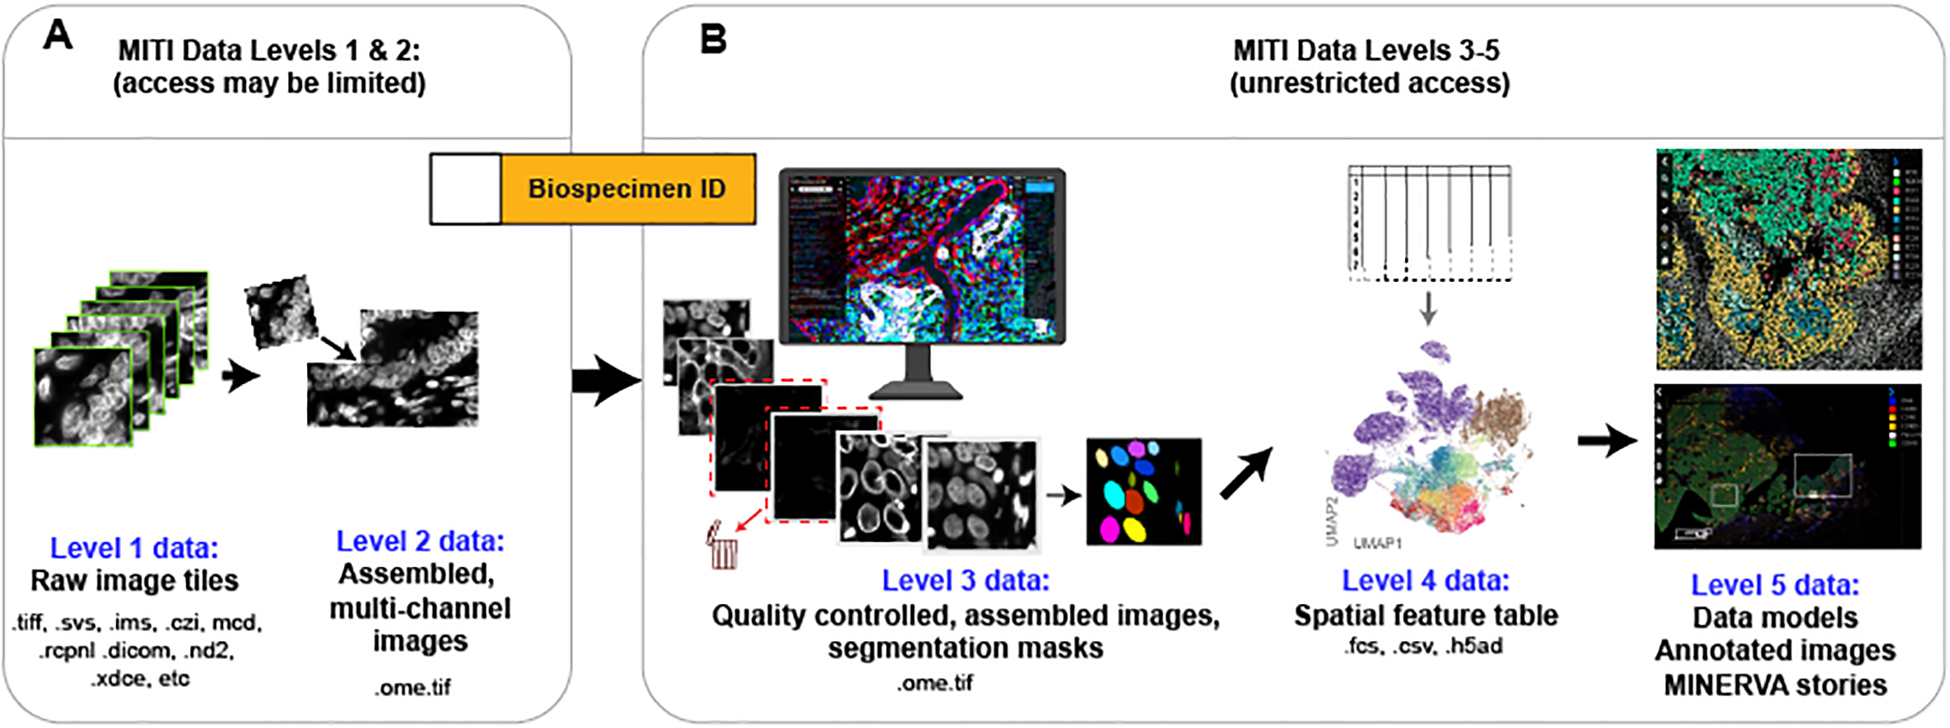
Data levels specify the extent of data processing and, in the case of sequencing data, whether access requires the approval of a data access committee. In common practice, data at levels 3 and up are freely shared. Primary data arising from microscopes and data acquisition instruments corresponds to level 1 data. Because the raw image data acquired from one slide usually consists of separate image fields, possibly from proprietary formats, they are processed to correct for uneven illumination and other instrumentation artifacts and assembled into a single multi-channel image in the OME-TIFF format (level 2 data). OME-TIFF image mosaics undergo quality control (including artefact removal, channel rejection, evaluation of staining quality) to generate full-resolution, assembled and curated level 3 image data; segmentation algorithms generate one or more label masks that also comprise level 3 data. The great majority of users will want to access these level 3 images. Each label mask (e.g., nuclei, cytoplasmic-regions, whole cells, organelles, etc.) is used to compute quantitative features, such as the mean signal intensity, spatial coordinates of individual cells and morphological features, which are stored as level 4 spatial feature tables (where rows represent single cells and columns the extracted cellular features); these data are suitable for analysis using the dimensionality reduction and visualization tools used for other types of single-cell data (e.g. UMAP plots). Spatial models computed from images and spatial feature tables, or by direct application of machine learning to images, as well as images annotated by humans, comprise level 5 data.
References
-
- Bodenmiller B Multiplexed Epitope-Based Tissue Imaging for Discovery and Healthcare Applications. Cell Syst 2, 225–238 (2016). - PubMed
Publication types
Grants and funding
- U54 CA225088/CA/NCI NIH HHS/United States
- U24 CA233243/CA/NCI NIH HHS/United States
- U2C CA233238/CA/NCI NIH HHS/United States
- HHSN261201500003C/CA/NCI NIH HHS/United States
- P30 CA008748/CA/NCI NIH HHS/United States
- U2C CA233262/CA/NCI NIH HHS/United States
- U2C CA233291/CA/NCI NIH HHS/United States
- K08 CA230213/CA/NCI NIH HHS/United States
- OT2 OD026677/OD/NIH HHS/United States
- HHSN261201500003I/CA/NCI NIH HHS/United States
- U2C CA233195/CA/NCI NIH HHS/United States
- HHSN261201500001W/CA/NCI NIH HHS/United States
- R35 CA197570/CA/NCI NIH HHS/United States
- U2C CA233254/CA/NCI NIH HHS/United States
- R01 CA245499/CA/NCI NIH HHS/United States
- HHSN261201000031C/CA/NCI NIH HHS/United States
- U2C CA233280/CA/NCI NIH HHS/United States
- HHSN261201500001C/CA/NCI NIH HHS/United States
- T32 HG000044/HG/NHGRI NIH HHS/United States
- U2C CA233284/CA/NCI NIH HHS/United States
- HHSN261201500001G/CA/NCI NIH HHS/United States
- U2C CA233285/CA/NCI NIH HHS/United States
- U2C CA233303/CA/NCI NIH HHS/United States
- K12 CA184746/CA/NCI NIH HHS/United States
- U2C CA233311/CA/NCI NIH HHS/United States
- R37 CA266185/CA/NCI NIH HHS/United States
LinkOut - more resources
Full Text Sources
