. 2023 Mar;27(1):153-164.
doi: 10.1007/s11325-022-02588-0. Epub 2022 Mar 11.

Mouth puffing phenomena of patients with obstructive sleep apnea when mouth-taped: device's efficacy confirmed with physical video observation

Affiliations

Mouth puffing phenomena of patients with obstructive sleep apnea when mouth-taped: device's efficacy confirmed with physical video observation

Je-Yang Jau et al. Sleep Breath. 2023 Mar.

Abstract

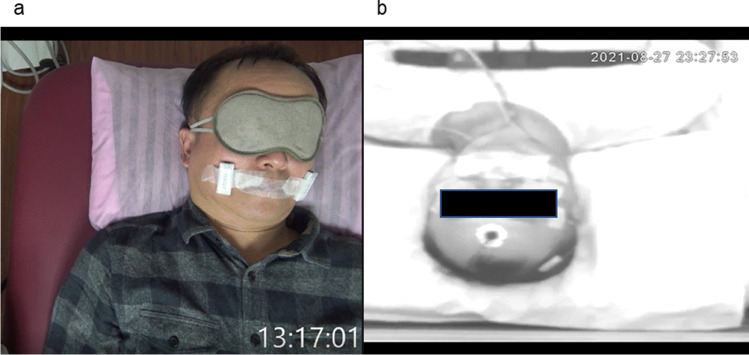
Purpose: This study aimed to design a device to monitor mouth puffing phenomena of patients with obstructive sleep apnea when mouth-taped and to employ video recording and computing algorithms to double-check and verify the efficacy of the device.

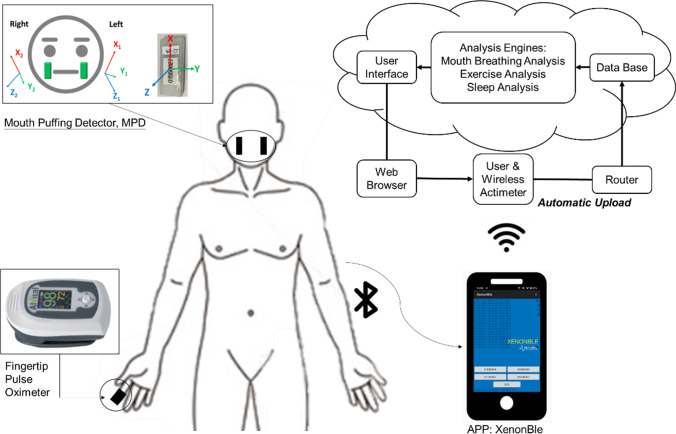
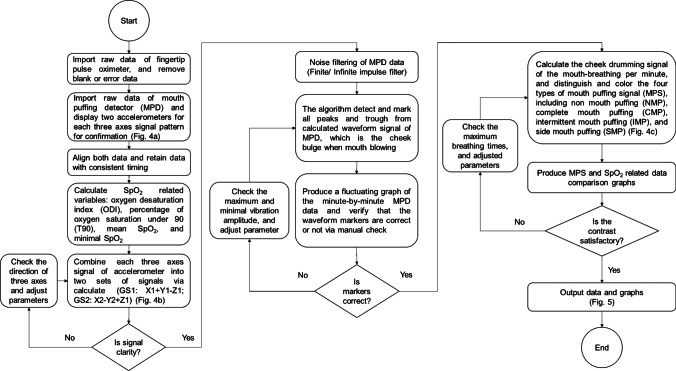
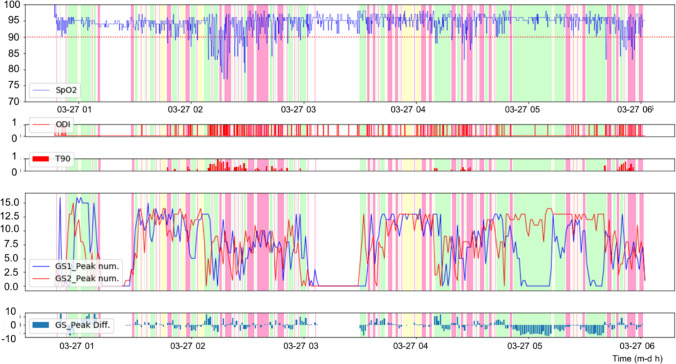
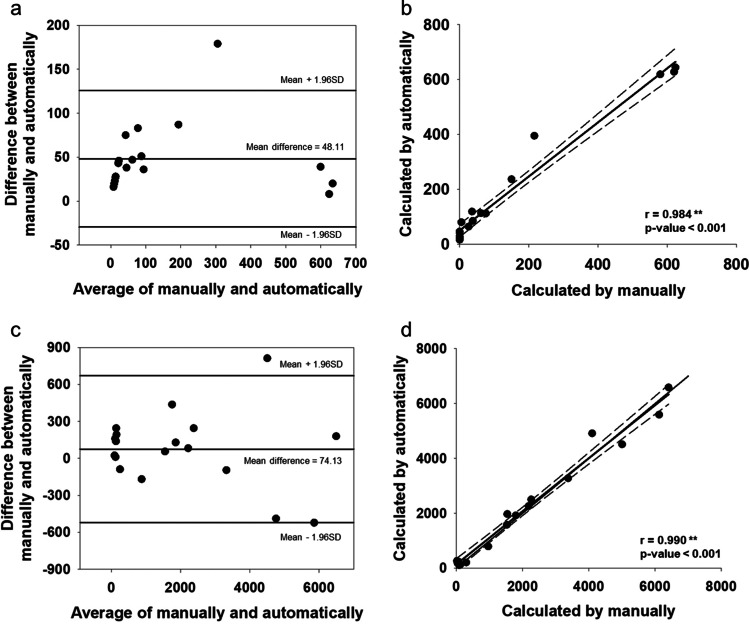
Methods: A mouth puffing detector (MPD) was developed, and a video camera was set to record the patients' mouth puffing phenomena in order to make ensure the data obtained from the device was appropriate and valid. Ten patients were recruited and had polysomnography. A program written in Python was used to investigate the efficacy of the program's algorithms and the relationship between variables in polysomnography (sleep stage, apnea-hypopnea index or AHI, oxygen-related variables) and mouth puffing signals (MPSs). The video recording was used to validate the program. Bland-Altman plot, correlations, independent sample t-test, and ANOVA were analyzed by SPSS 24.0.

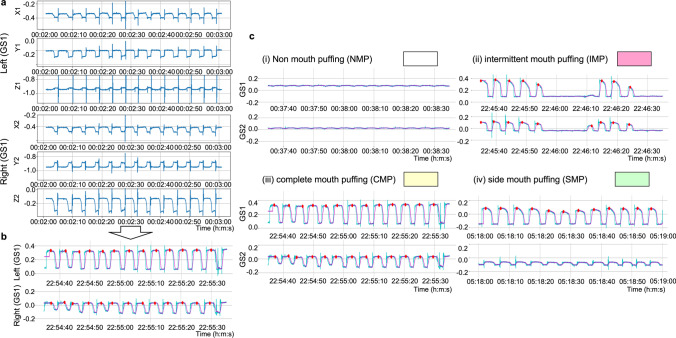
Results: Patients were found to mouth puff when they sleep with their mouths taped. An MPD was able to detect the signals of mouth puffing. Mouth puffing signals were noted and categorized into four types of MPSs by our algorithms. MPSs were found to be significantly related to relative OSA indices. When all participants' data were divided into minutes, intermittent mouth puffing (IMP) was found to be significantly different from non-mouth puffing in AHI, oxygen desaturation index (ODI), and time of oxygen saturation under 90% (T90) (AHI: 0.75 vs. 0.31; ODI: 0.75 vs. 0.30; T90: 5.52 vs. 1.25; p < 0.001). Participants with severe OSA showed a higher IMP percentage compared to participants with mild to moderate OSA and the control group (severe: 38%, mild-to-moderate: 65%, control: 95%; p < 0.001).

Conclusions: This study established a simple way to detect mouth puffing phenomena when patients were mouth-taped during sleep, and the signals were classified into four types of MPSs. We propose that MPSs obtained from patients wearing the MPD can be used as a complement for clinicians to evaluate OSA.

Keywords: Breathing monitoring; Mouth breathing; Mouth puffing; OSA; Sleep disorder breathing.


Conflict of interest statement

The authors declare no competing interests.

Figures

Fig. 1
Fig. 1
The images of the patient when video-recorded at the clinic (a) and at the laboratory (b)
Fig. 2
Fig. 2
The diagram shows how the devices are utilized and data acquired. The participant, wearing a wireless fingertip pulse oximetry and an MPD, is mouth-taped and tested. All signals are instantaneously stored in a microcontroller and then intermittently transmitted to a router (mobile phone app, XenonBLE) with bluetooth. The router receives and relays the signals to a cloud server where the signals are processed and stored
Fig. 3
Fig. 3
Diagram shows the process of device detection and data acquisition. The raw data from both devices were imported and blank and error data were removed. Two accelerometers were displayed for each of the three axes signal patterns per minute for confirmation (Fig. 4a) separately. Both data were aligned and retained with consistent timing. The SpO2-related variables were calculated. The data from the mouth puffing detector (MPD) were combined for each accelerometer into two sets of signals (GS1 (on the left): X1 + Y1-Z1; GS2 (on the right): X2-Y2 + Z2; Fig. 4b), and the signal clarity was assessed. If the signal was unclear, then the direction of each three axes signal and parameters were adjusted and checked. During noise filtering of the MPD data, the algorithms were detected, and all the peaks and troughs were marked from the calculated waveform signal of MPD, which is indicated by cheek bulge when mouth puffing. Then, a fluctuating graph of the minute-by-minute MPD data was produced, and the waveform markers were verified manually. If markers were mostly incorrect, then the vibration amplitude was checked, and the parameters were adjusted and calculated. The cheek drumming signal of the mouth breathing per minute was also calculated. Then, the four types of mouth breathing signal (MPS), including NMP (colored white), CMP (colored yellow), IMP (colored red), and SMP (colored green) were distinguished and colored (Fig. 4c). The MPS and SpO2-related data comparison graphs were produced (Fig. 5). If the contrast was unsatisfactory, then the maximum breathing times were checked, and the parameters were adjusted, followed by the final output data and graphs
Fig. 4
Fig. 4
The processing of mouth puffing detector (MPD) data analysis. a Image of MPD data per minute with three axes in two accelerometers; b image of calculated MPD data per minute in the two accelerometers; c image of mouth breathing signal (MPS) meaning and color. To better understand the signal meaning, the MPD data per minute with three axes were split into two accelerometers by the algorithm (a) and the signal was calculated through its signal direction (b). Depending on the peak feature, there are four types of mouth breathing signals (c)
Fig. 5
Fig. 5
Image of the combined mouth puffing signal (MPS) and SpO2 variable data from one of the participants. After the analysis of MPS and SpO2, the MPS and SpO2 variable data were combined with color to understand the relationship between MPS and SpO2. For GS1 and GS2, the accelerometers are on the left and right sides, respectively; GS1 and GS2 peak num represents the number of waveform signals detected and marked by algorithms (GS1: X1 + Y1-Z1; GS2: X2-Y2 + Z2), and GS_Peak Diff. is the difference between GS1_Peak num and GS2_Peak num (GS_Peak Diff. = GS1_Peak num—GS2_Peak num)
Fig. 6
Fig. 6
a Bland–Altman plot of the manual versus algorithm when participant slept in clinic; b correlation of mouth puffing signal (MPS) when participant slept in clinic; c Bland–Altman plot of the manual versus algorithm when participant slept with PSG in laboratory; d correlation of mouth puffing signal (MPS) calculated manually and automatically when participant slept with PSG in laboratory

References

    1. Jordan AS, McSharry DG, Malhotra A. Adult obstructive sleep apnoea. Lancet. 2014;383(9918):736–747. doi: 10.1016/s0140-6736(13)60734-5. - DOI - PMC - PubMed
    1. Deegan PC, McNicholas WT. Pathophysiology of obstructive sleep apnoea. Eur Respir J. 1995;8(7):1161–1178. doi: 10.1183/09031936.95.08071161. - DOI - PubMed
    1. Foldvary-Schaefer NR, Waters TE. Sleep-disordered breathing. Continuum (Minneap Minn) 2017;23(4, Sleep Neurology):1093–1116. doi: 10.1212/01.CON.0000522245.13784.f6. - DOI - PubMed
    1. Gonzaga C, Bertolami A, Bertolami M, Amodeo C, Calhoun D. Obstructive sleep apnea, hypertension and cardiovascular diseases. J Hum Hypertens. 2015;29(12):705–712. doi: 10.1038/jhh.2015.15. - DOI - PubMed
    1. Peppard PE, Young T, Barnet JH, Palta M, Hagen EW, Hla KM. Increased prevalence of sleep-disordered breathing in adults. Am J Epidemiol. 2013;177(9):1006–1014. doi: 10.1093/aje/kws342. - DOI - PMC - PubMed

LinkOut - more resources