. 2022 Jul;16(4):653-661.
doi: 10.1111/irv.12976. Epub 2022 Mar 12.

Interactions among common non-SARS-CoV-2 respiratory viruses and influence of the COVID-19 pandemic on their circulation in New York City

Affiliations

Interactions among common non-SARS-CoV-2 respiratory viruses and influence of the COVID-19 pandemic on their circulation in New York City

Haokun Yuan et al. Influenza Other Respir Viruses. 2022 Jul.

Abstract

Background: Non-pharmaceutical interventions (NPIs) and voluntary behavioral changes during the COVID-19 pandemic have influenced the circulation of non-SARS-CoV-2 respiratory infections. We aimed to examine interactions among common non-SARS-CoV-2 respiratory virus and further estimate the impact of the COVID-19 pandemic on these viruses.

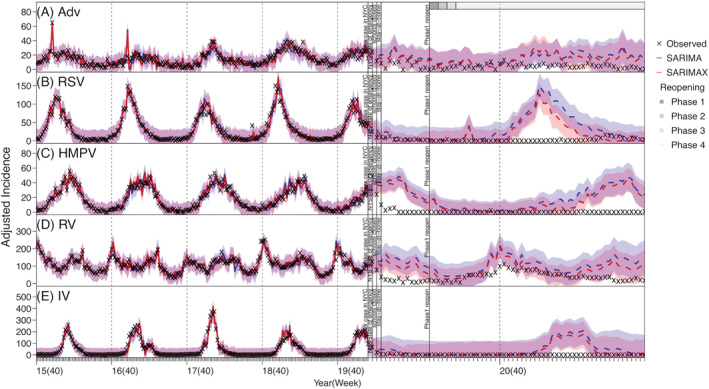
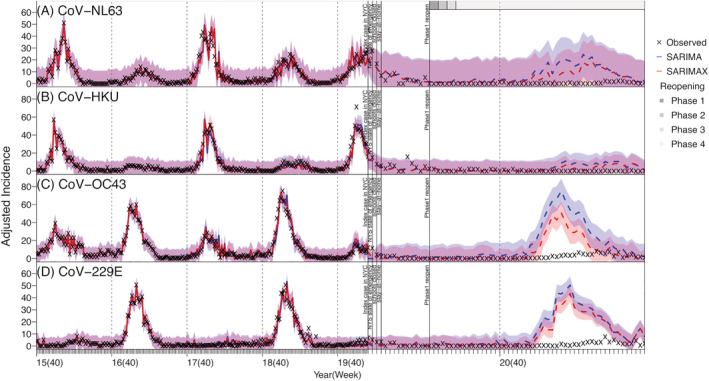
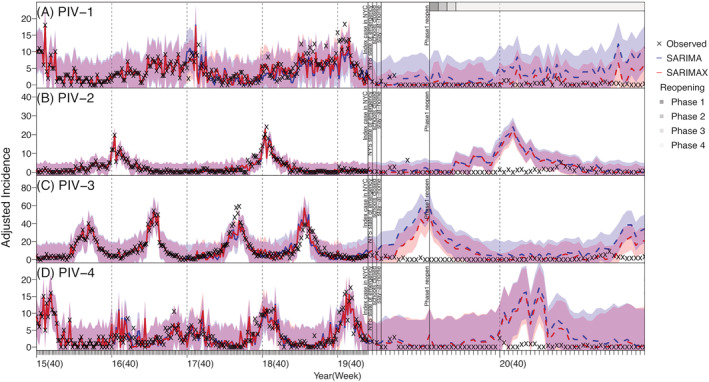
Methods: We analyzed incidence data for seven groups of respiratory viruses in New York City (NYC) during October 2015 to May 2021 (i.e., before and during the COVID-19 pandemic). We first used elastic net regression to identify potential virus interactions and further examined the robustness of the found interactions by comparing the performance of Seasonal Auto Regressive Integrated Moving Average (SARIMA) models with and without the interactions. We then used the models to compute counterfactual estimates of cumulative incidence and estimate the reduction during the COVID-19 pandemic period from March 2020 to May 2021, for each virus.

Results: We identified potential interactions for three endemic human coronaviruses (CoV-NL63, CoV-HKU, and CoV-OC43), parainfluenza (PIV)-1, rhinovirus, and respiratory syncytial virus (RSV). We found significant reductions (by ~70-90%) in cumulative incidence of CoV-OC43, CoV-229E, human metapneumovirus, PIV-2, PIV-4, RSV, and influenza virus during the COVID-19 pandemic. In contrast, the circulation of adenovirus and rhinovirus was less affected.

Conclusions: Circulation of several respiratory viruses has been low during the COVID-19 pandemic, which may lead to increased population susceptibility. It is thus important to enhance monitoring of these viruses and promptly enact measures to mitigate their health impacts (e.g., influenza vaccination campaign and hospital infection prevention) as societies resume normal activities.

Keywords: COVID-19 pandemic impact; coronaviruses; human metapneumovirus; parainfluenza; respiratory virus interactions; rhinovirus.


Figures

FIGURE 1
FIGURE 1
Model fit and counterfactual‐estimates of weekly incidence for adenovirus (Adv; A), respiratory syncytial virus (RSV; B), human metapneumovirus (HMPV; C), rhinovirus (RV; D), and influenza virus (IV; E) using SARIMA and SARIMAX models. Crosses (“x”) show scaled weekly incidence. Blue lines (mean) and shaded areas (95% confidence intervals) show model fit (solid lines) and counterfactual‐estimates (dashed lines) using the SARIMA models; red lines (mean) and shaded areas (95% confidence intervals) show model fit (solid lines) and counterfactual‐estimates (dashed lines) using the SARIMAX models. Vertical dashed lines indicate the start of each respiratory virus season, and vertical black lines mark timing of major COVID‐19 events; gray bars on the top of the plot indicate different reopening phases in NYC (see criteria of reopening and phases at https://forward.ny.gov). Note the x‐axis scale for the pandemic counterfactual‐estimates is expanded to show more details
FIGURE 2
FIGURE 2
Model fit and counterfactual‐estimates of weekly incidence for human endemic coronaviruses: Cov‐NL63 (A), Cov‐HKU (B), Cov‐OC43 (C), and Cov‐229E (D) using SARIMA and SARIMAX models. Blue lines (mean) and shaded areas (95% confidence intervals) show model fit (solid lines) and counterfactual‐estimates (dashed lines) using the SARIMA models; red lines (mean) and shaded areas (95% confidence intervals) show model fit (solid lines) and counterfactual‐estimates (dashed lines) using the SARIMAX models. Vertical dashed lines indicate the start of each respiratory virus season, and vertical black lines mark timing of major COVID‐19 events; gray bars on the top of the plot indicate different reopening phases in NYC (see criteria of reopening and phases at https://forward.ny.gov). Note the x‐axis scale for the pandemic counterfactual‐estimates is expanded to show more details
FIGURE 3
FIGURE 3
Model fit and counterfactual‐estimates of weekly incidence for parainfluenza viruses: PIV‐1 (A), PIV‐2 (B), PIV‐3 (C), and PIV‐4 (D) using SARIMA and SARIMAX models. Blue lines (mean) and shaded areas (95% confidence intervals) show model fit (solid lines) and counterfactual‐estimates (dashed lines) using the SARIMA models; red lines (mean) and shaded areas (95% confidence intervals) show model fit (solid lines) and counterfactual‐estimates (dashed lines) using the SARIMAX models. Vertical dashed lines indicate the start of each respiratory virus season, and vertical black lines mark timing of major COVID‐19 events; gray bars on the top of the plot indicate different reopening phases in NYC. (see criteria of reopening and phases at https://forward.ny.gov). Note the x‐axis scale for the pandemic counterfactual‐estimates is expanded to show more details

References

    1. Vos T, Lim SS, Abbafati C, et al. Global burden of 369 diseases and injuries in 204 countries and territories, 1990–2019: a systematic analysis for the Global Burden of Disease Study 2019. The Lancet. 2020;396(10258):1204‐1222. doi: 10.1016/S0140-6736(20)30925-9 - DOI - PMC - PubMed
    1. Dixon RE. Economic costs of respiratory tract infections in the United States. Am J Med. 1985;78(6, Supplement 2):45‐51. doi: 10.1016/0002-9343(85)90363-8 - DOI - PubMed
    1. Putri WCWS, Muscatello DJ, Stockwell MS, Newall AT. Economic burden of seasonal influenza in the United States. Vaccine. 2018;36(27):3960‐3966. doi: 10.1016/j.vaccine.2018.05.057 - DOI - PubMed
    1. Opatowski L, Baguelin M, Eggo RM. Influenza interaction with cocirculating pathogens and its impact on surveillance, pathogenesis, and epidemic profile: A key role for mathematical modelling. PLoS Pathog. 2018;14(2):e1006770. doi: 10.1371/journal.ppat.1006770 - DOI - PMC - PubMed
    1. Meningher T, Hindiyeh M, Regev L, Sherbany H, Mendelson E, Mandelboim M. Relationships between A(H1N1)pdm09 influenza infection and infections with other respiratory viruses. Influenza Other Respi Viruses. 2014;8(4):422‐430. doi: 10.1111/irv.12249 - DOI - PMC - PubMed

Publication types