. 2022 May 18;110(10):1631-1640.e4.
doi: 10.1016/j.neuron.2022.02.012. Epub 2022 Mar 11.

Neural correlates of blood flow measured by ultrasound

Affiliations

Neural correlates of blood flow measured by ultrasound

Anwar O Nunez-Elizalde et al. Neuron. .

Abstract

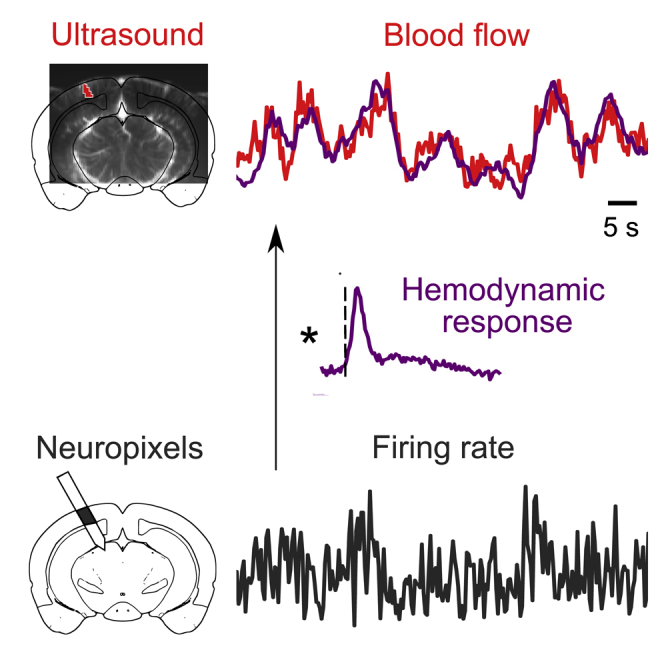
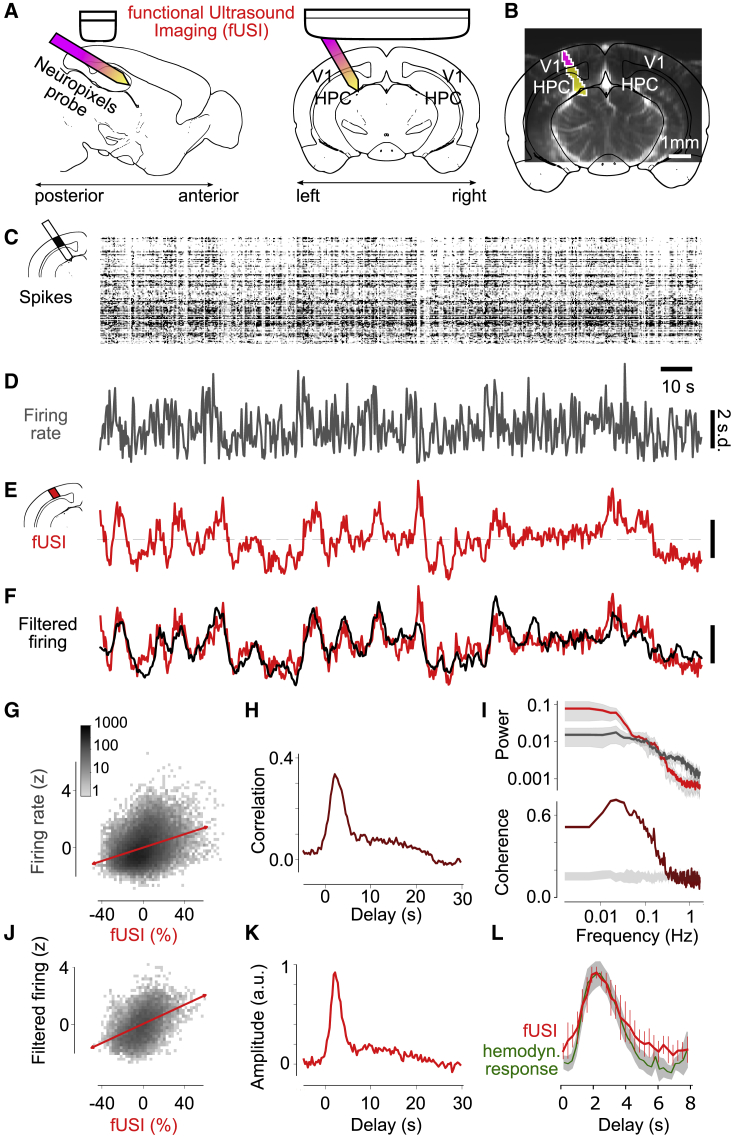
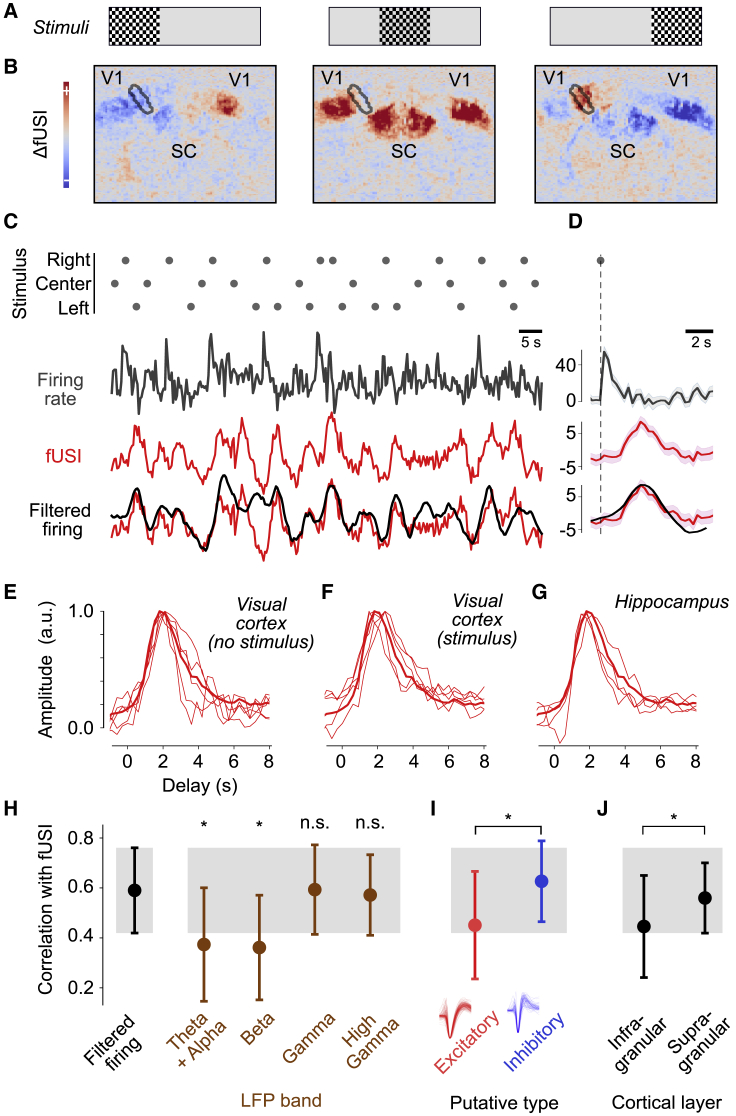
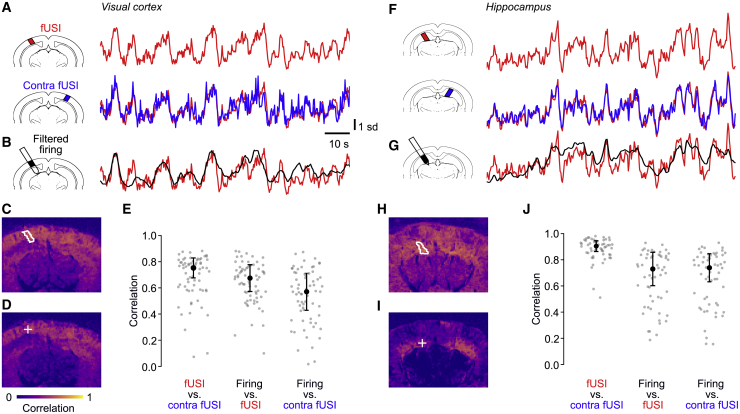
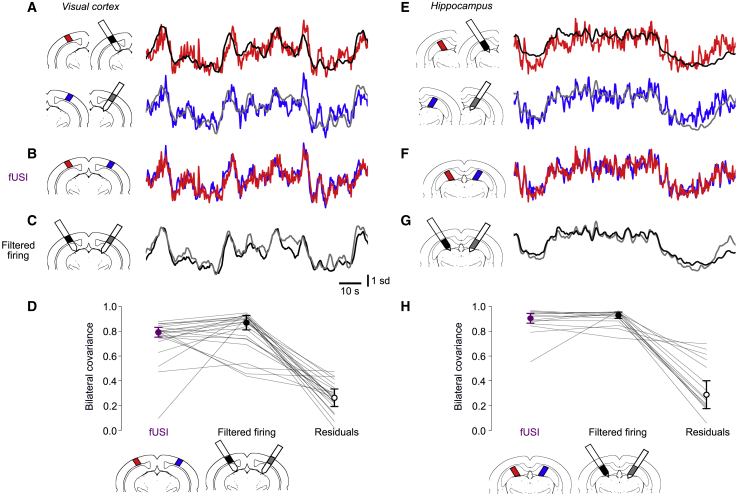
Functional ultrasound imaging (fUSI) is an appealing method for measuring blood flow and thus infer brain activity, but it relies on the physiology of neurovascular coupling and requires extensive signal processing. To establish to what degree fUSI trial-by-trial signals reflect neural activity, we performed simultaneous fUSI and neural recordings with Neuropixels probes in awake mice. fUSI signals strongly correlated with the slow (<0.3 Hz) fluctuations in the local firing rate and were closely predicted by the smoothed firing rate of local neurons, particularly putative inhibitory neurons. The optimal smoothing filter had a width of ∼3 s, matched the hemodynamic response function of awake mice, was invariant across mice and stimulus conditions, and was similar in the cortex and hippocampus. fUSI signals also matched neural firing spatially: firing rates were as highly correlated across hemispheres as fUSI signals. Thus, blood flow measured by ultrasound bears a simple and accurate relationship to neuronal firing.

Keywords: electrophysiology; hemodynamic coupling; mice; ultrasound measurements.


Conflict of interest statement

Declaration of interests A.U. is the founder and a shareholder of AUTC, a company commercializing neuroimaging solutions for preclinical and clinical research. M.C. is a member of Neuron’s Advisory Board.

Figures

None
Graphical abstract
Figure 1
Figure 1
fUSI signal reflects temporally filtered firing rates during spontaneous activity (A) Schematic of simultaneous fUSI and electrophysiological recordings showing the primary visual cortex (V1) and hippocampus (HPC). (B) Coronal fUSI slice with the location of the Neuropixels probe passing through this plane (purple) and in front of it (yellow). (C) Spikes recorded in V1 in an example recording as a function of time and recording depth. (D) The resulting mean firing rates. (E) fUSI signal measured simultaneously in the same location (average over 51 voxels). (F) Smoothing the firing rates with the optimal filter (shown in K) yields good predictions (black) of the fUSI signals (red). (G) Comparison of fUSI signals and firing rates measured 2.1 s earlier (the optimal value), with best-fitting lines indicating correlation (red). 34 recordings in 5 mice. (H) Cross-correlations between firing rates and fUSI signals, averaged across 34 recordings in 5 mice. (I) Power spectra (top) and spectral coherence (bottom) of firing rates and fUSI, averaged across recordings. The gray bands in the top plot show 1 median absolute deviation (MAD). The gray band in the bottom plot shows coherence of randomly circularly shifted traces. (J) Comparison of fUSI signals and filtered firing rates. (K) Optimal linear filter across recordings obtained with cross-validation. Median of 34 recordings in 5 mice. (L) The filter (red) resembles the hemodynamic response function measured in awake mice (green, from Pisauro et al., 2013). Error bars show ± MAD of 34 recordings in 5 mice.
Figure 2
Figure 2
Constant hemodynamic coupling across stimulus conditions and neural sources (A) Flashing checkerboards were presented on the left, center, or right. (B) fUSI voxel responses to checkerboards, showing deviations from the mean activity. Black outline indicates the voxels traversed by the Neuropixels probe in V1. (C) Response to an example sequence of 30 stimuli (dots), showing firing rates in left V1 (gray), the corresponding fUSI signal (red), and the filtered firing rate (black). (D) Same format as (C), showing the average response to the right (optimal) stimulus. (E and F) The estimated HRFs for the visual cortex under spontaneous activity and visual stimulation for individual mice (n = 5) resembled the mean HRF computed across mice, areas, and conditions (thick curve). (G) Individual HRFs for hippocampus estimated across spontaneous activity and visual stimulation (n = 4) resembled the mean HRF (thick curve, same as in E and F). (H) Correlation between fUSI signals and LFP bands (n = 187 recordings across hippocampus and visual cortex, in 5 animals). Asterisks indicate significant differences between firing rates and LFP bands (p < 10−12). (I) Correlation between fUSI signals and putative excitatory and inhibitory neurons (n = 187 recordings). (J) Correlation between fUSI signals and infragranular and supragranular units recorded from the visual cortex (n = 100 recordings in 5 animals).
Figure 3
Figure 3
fUSI signals and firing rates are correlated across hemispheres (A) fUSI traces measured during spontaneous activity in an example recording, in an ROI in the left visual cortex (top) and in a symmetrical ROI in the right visual cortex (bottom). (B) Filtered firing rates measured simultaneously in the left ROI. (C) Correlations between the fUSI voxels in the left ROI (white contour) and all the other fUSI voxels. (D) Correlations between the filtered firing rates measured in the left ROI (plus sign) and all the individual fUSI voxels. (E) Correlations between fUSI signals in the left and right visual cortices (left) and between filtered firing rates and simultaneous fUSI signals in the same location in the visual cortex (center) and in the opposite hemisphere (right). Black dot and error bars show median ± MAD across n = 68 recordings during spontaneous activity and visual stimulation. (F–J) Same analyses for recordings where firing rates and fUSI were measured in hippocampus (n = 58 recordings).
Figure 4
Figure 4
Bilateral firing largely explains bilateral fUSI signals (A) Example recordings from two Neuropixels probes inserted bilaterally, yielding simultaneous measurements of firing rates (filtered with the HRF, black and gray curves) and fUSI signals (red and blue curves) during spontaneous activity in left and right visual cortices. (B and C) Superposition of the bilateral fUSI signals (B) and of the bilateral filtered firing rates (C). (D) Covariance between left and right fUSI signals (left), filtered firing rates (middle), and residuals obtained by subtracting the filtered firing rates from the fUSI signals (right). Because fUSI signals and filtered firing rates are Z scored, their covariance equals their correlation. Dots and error bars indicate median ± MAD across 22 recordings (lines) in 3 mice during spontaneous activity and visual stimulations. (E–H) Same analysis for hippocampus (14 recordings in 3 mice).

Comment in

References

    1. Anenberg E., Chan A.W., Xie Y., LeDue J.M., Murphy T.H. Optogenetic stimulation of GABA neurons can decrease local neuronal activity while increasing cortical blood flow. J. Cereb. Blood Flow Metab. 2015;35:1579–1586. doi: 10.1038/jcbfm.2015.140. - DOI - PMC - PubMed
    1. Attwell D., Iadecola C. The neural basis of functional brain imaging signals. Trends Neurosci. 2002;25:621–625. - PubMed
    1. Aydin A.K., Haselden W.D., Goulam Houssen Y., Pouzat C., Rungta R.L., Demené C., Tanter M., Drew P.J., Charpak S., Boido D. Transfer functions linking neural calcium to single voxel functional ultrasound signal. Nat. Commun. 2020;11:2954. doi: 10.1038/s41467-020-16774-9. - DOI - PMC - PubMed
    1. Baranger J., Arnal B., Perren F., Baud O., Tanter M., Demené C. Adaptive spatiotemporal SVD clutter filtering for ultrafast Doppler imaging using similarity of spatial singular vectors. IEEE Trans. Med. Imaging. 2018;37:1574–1586. doi: 10.1109/TMI.2018.2789499. - DOI - PubMed
    1. Barthó P., Hirase H., Monconduit L., Zugaro M., Harris K.D., Buzsáki G. Characterization of neocortical principal cells and interneurons by network interactions and extracellular features. J. Neurophysiol. 2004;92:600–608. - PubMed

Publication types

LinkOut - more resources