. 2022 Apr 7;29(4):577-592.e8.
doi: 10.1016/j.stem.2022.02.010. Epub 2022 Mar 11.

Lamin B1 deletion in myeloid neoplasms causes nuclear anomaly and altered hematopoietic stem cell function

Affiliations

Lamin B1 deletion in myeloid neoplasms causes nuclear anomaly and altered hematopoietic stem cell function

Andreea Reilly et al. Cell Stem Cell. .

Abstract

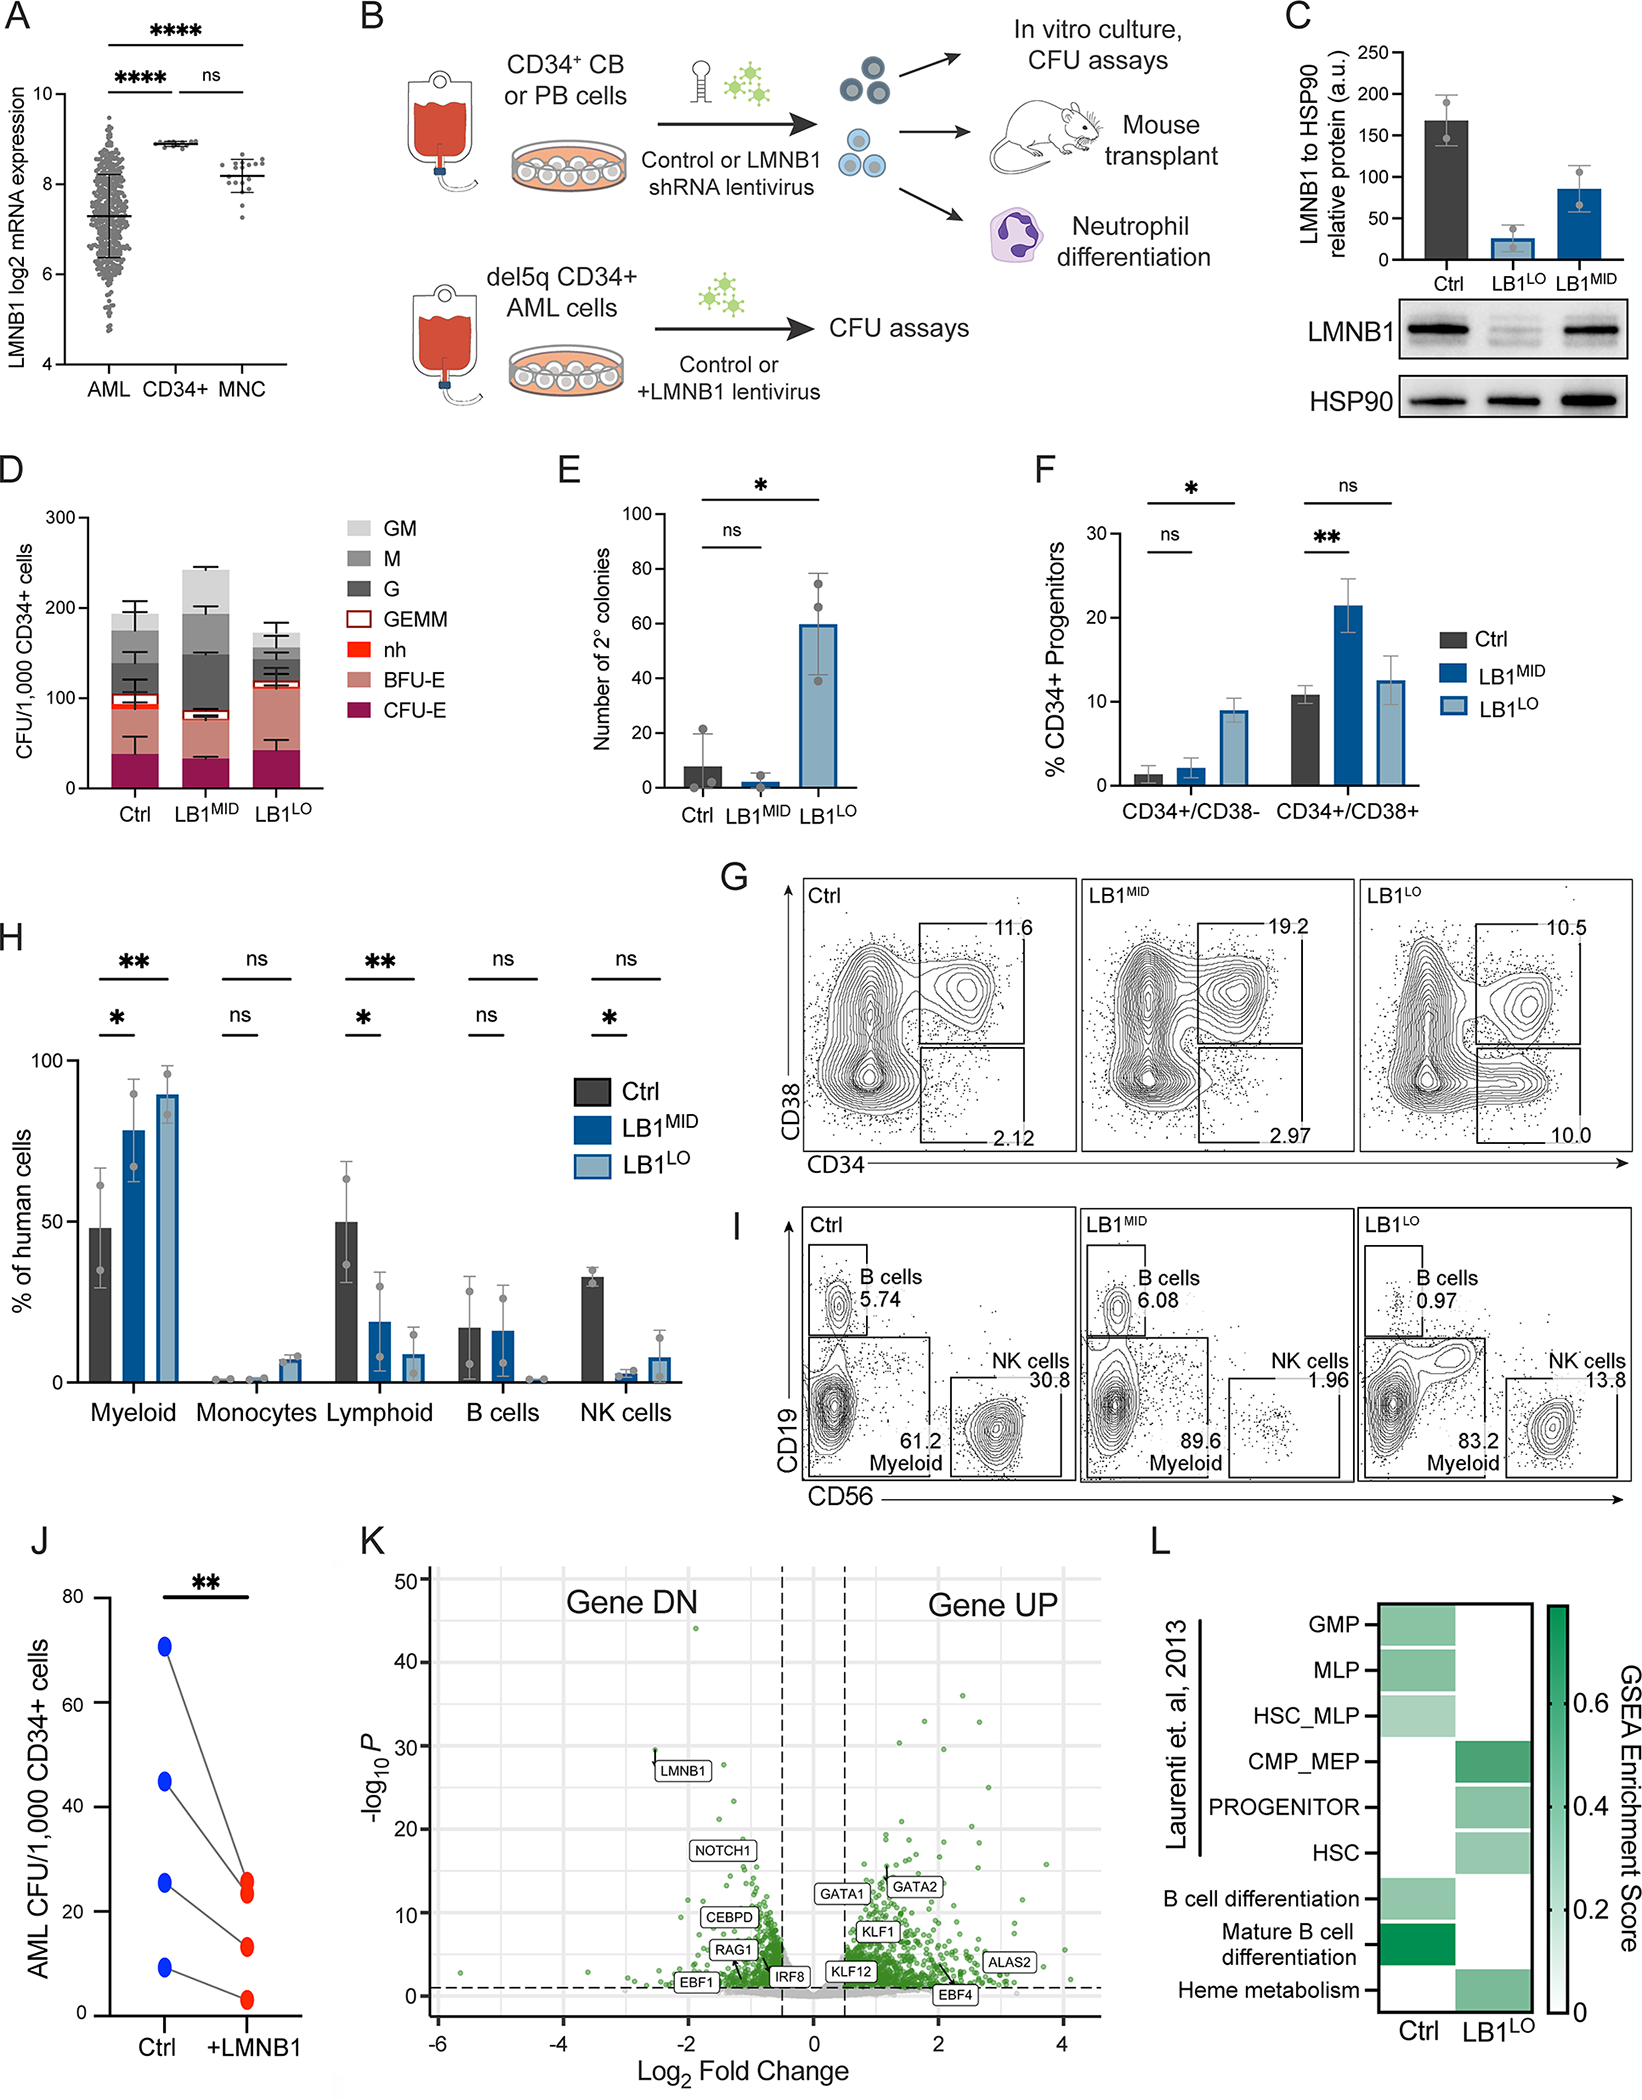
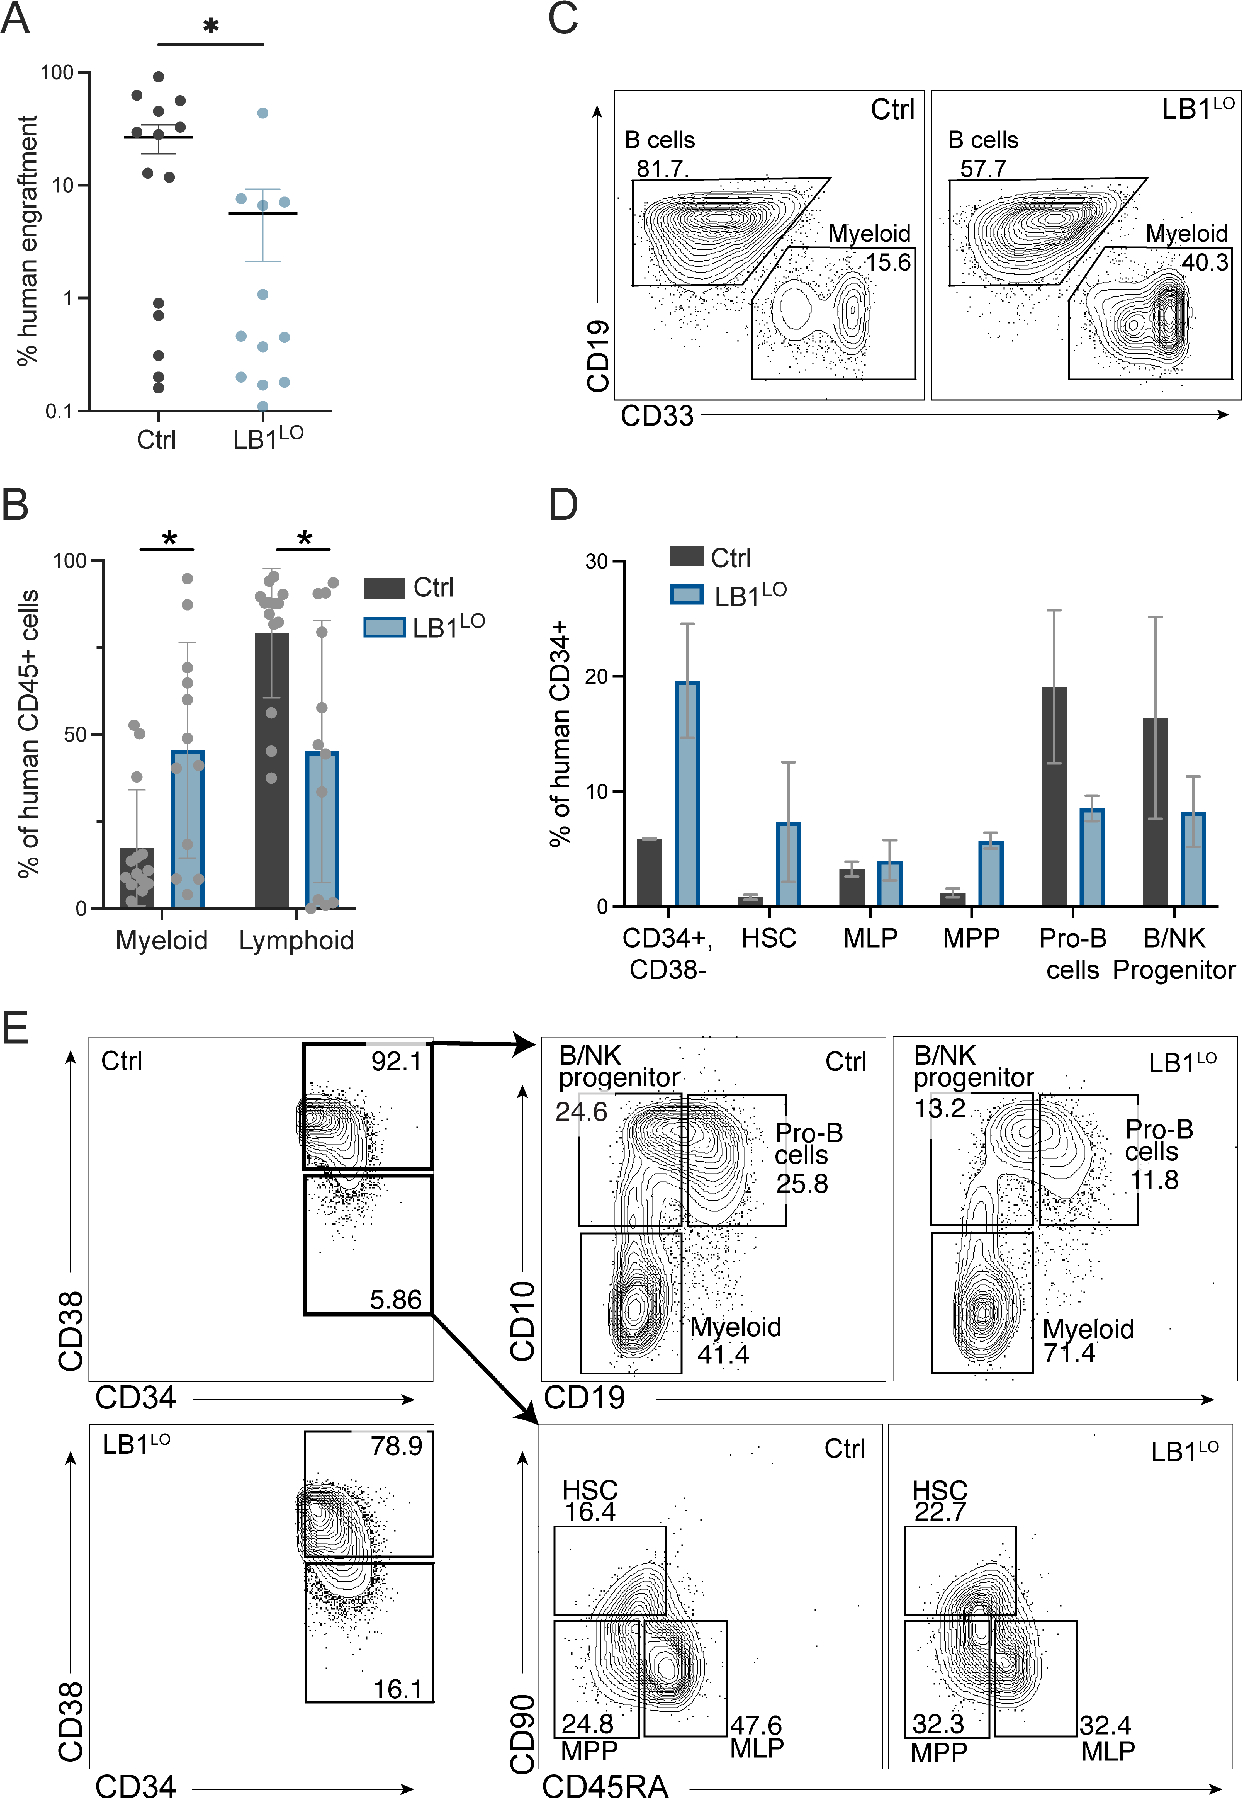
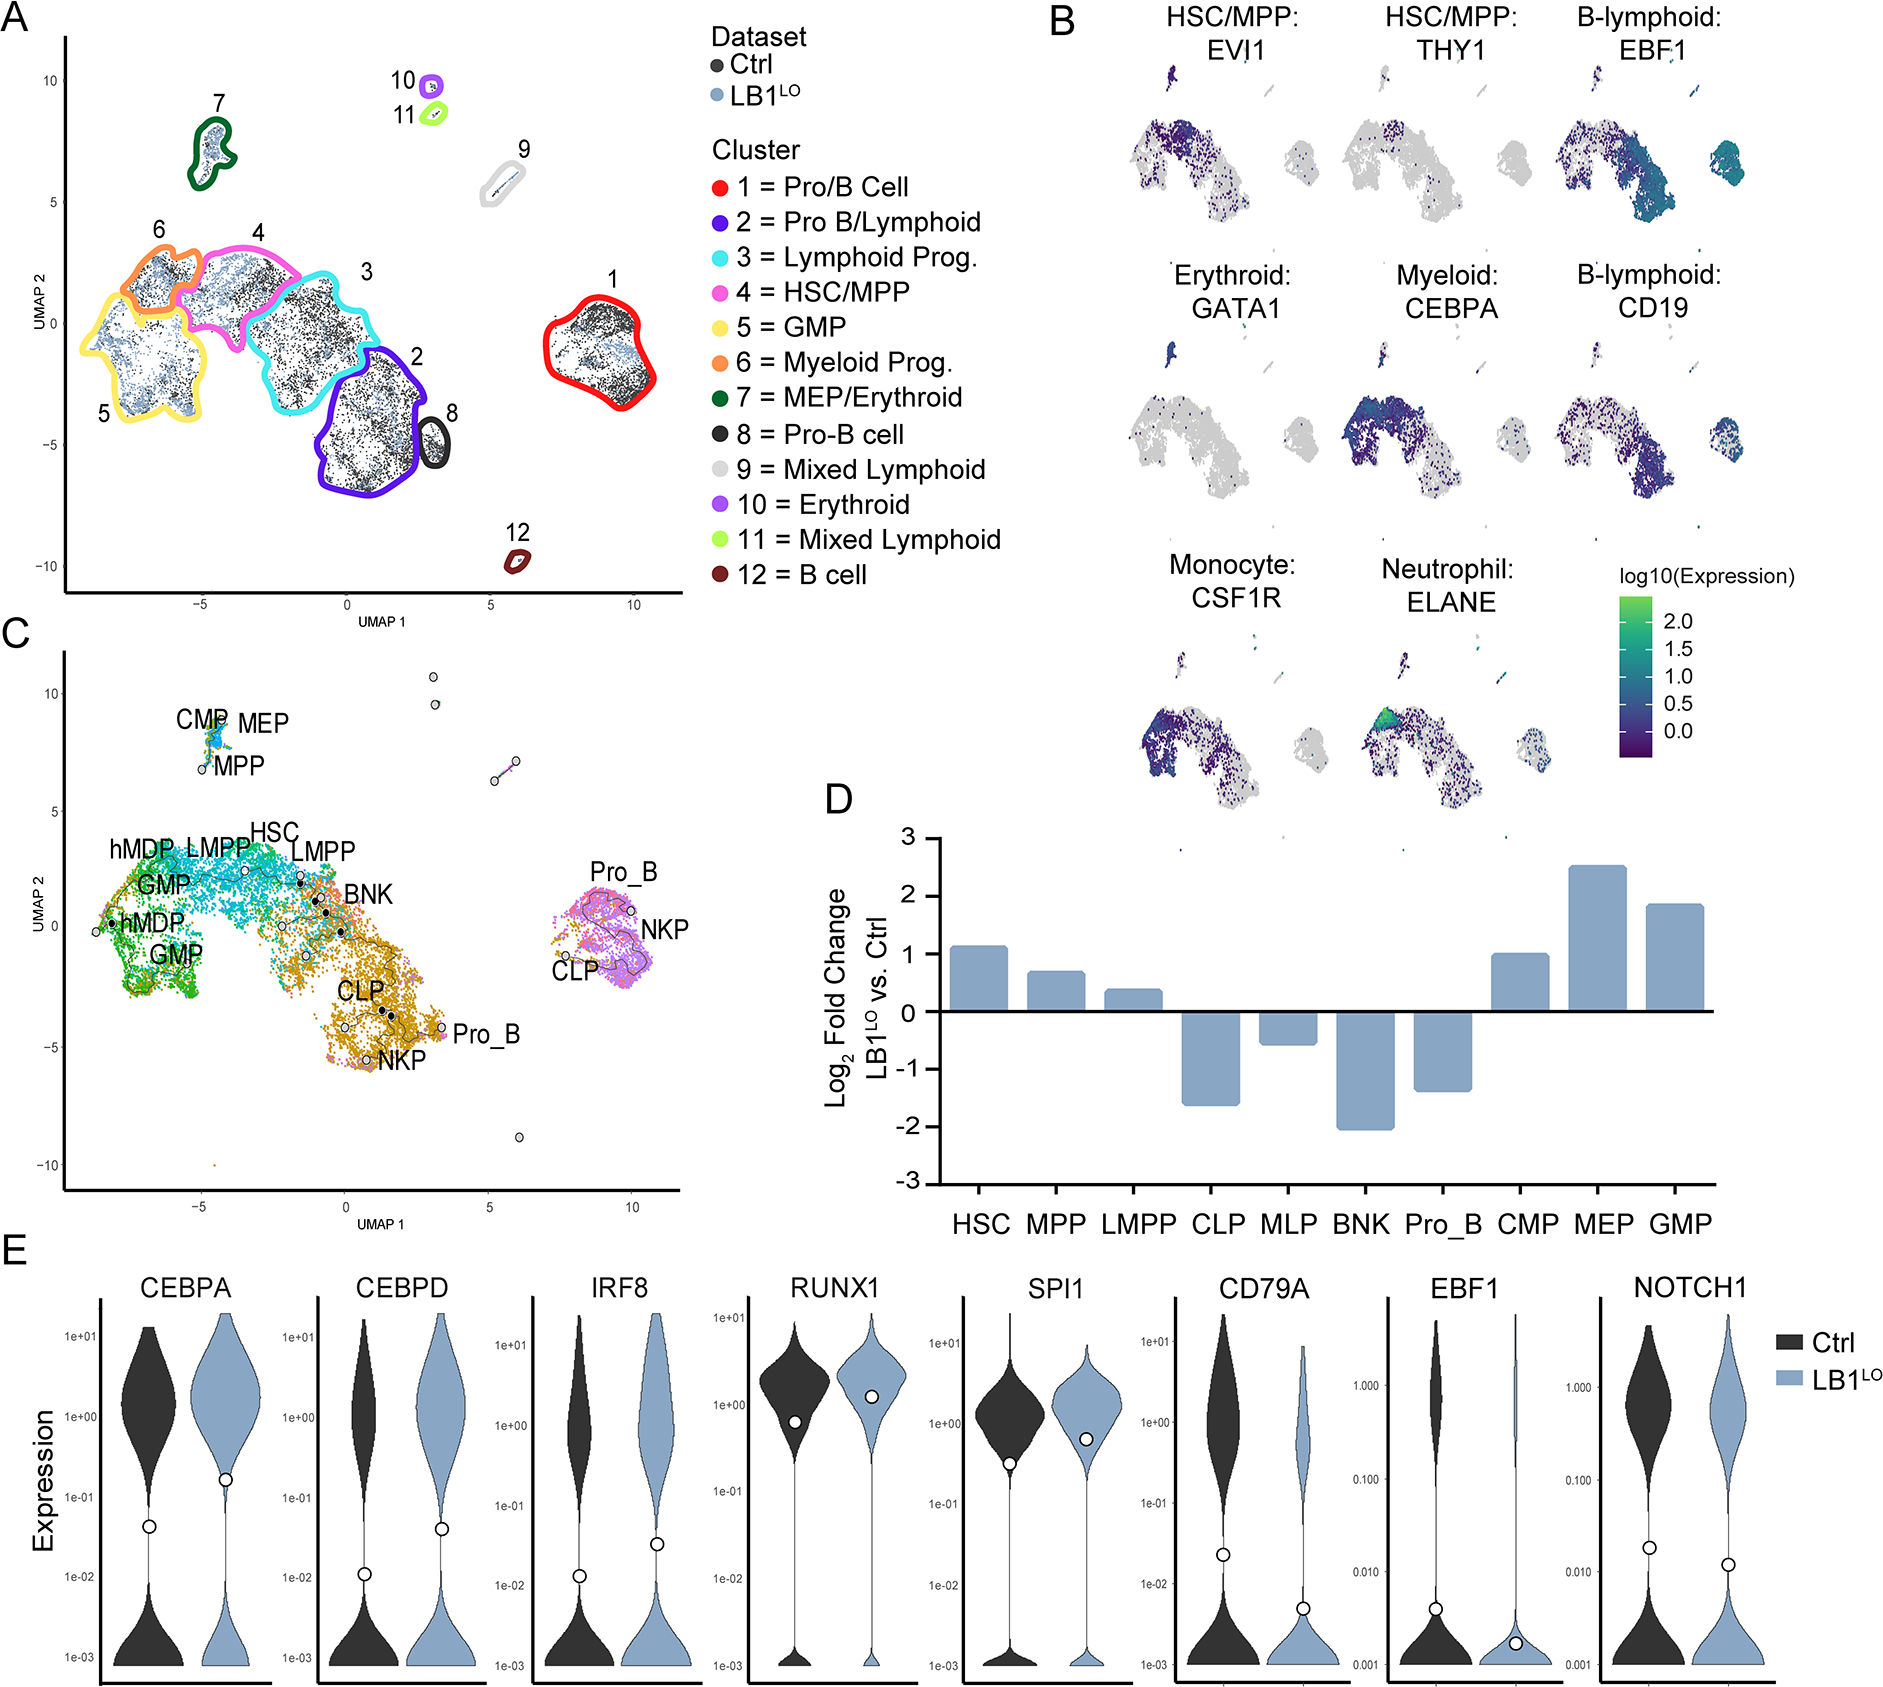
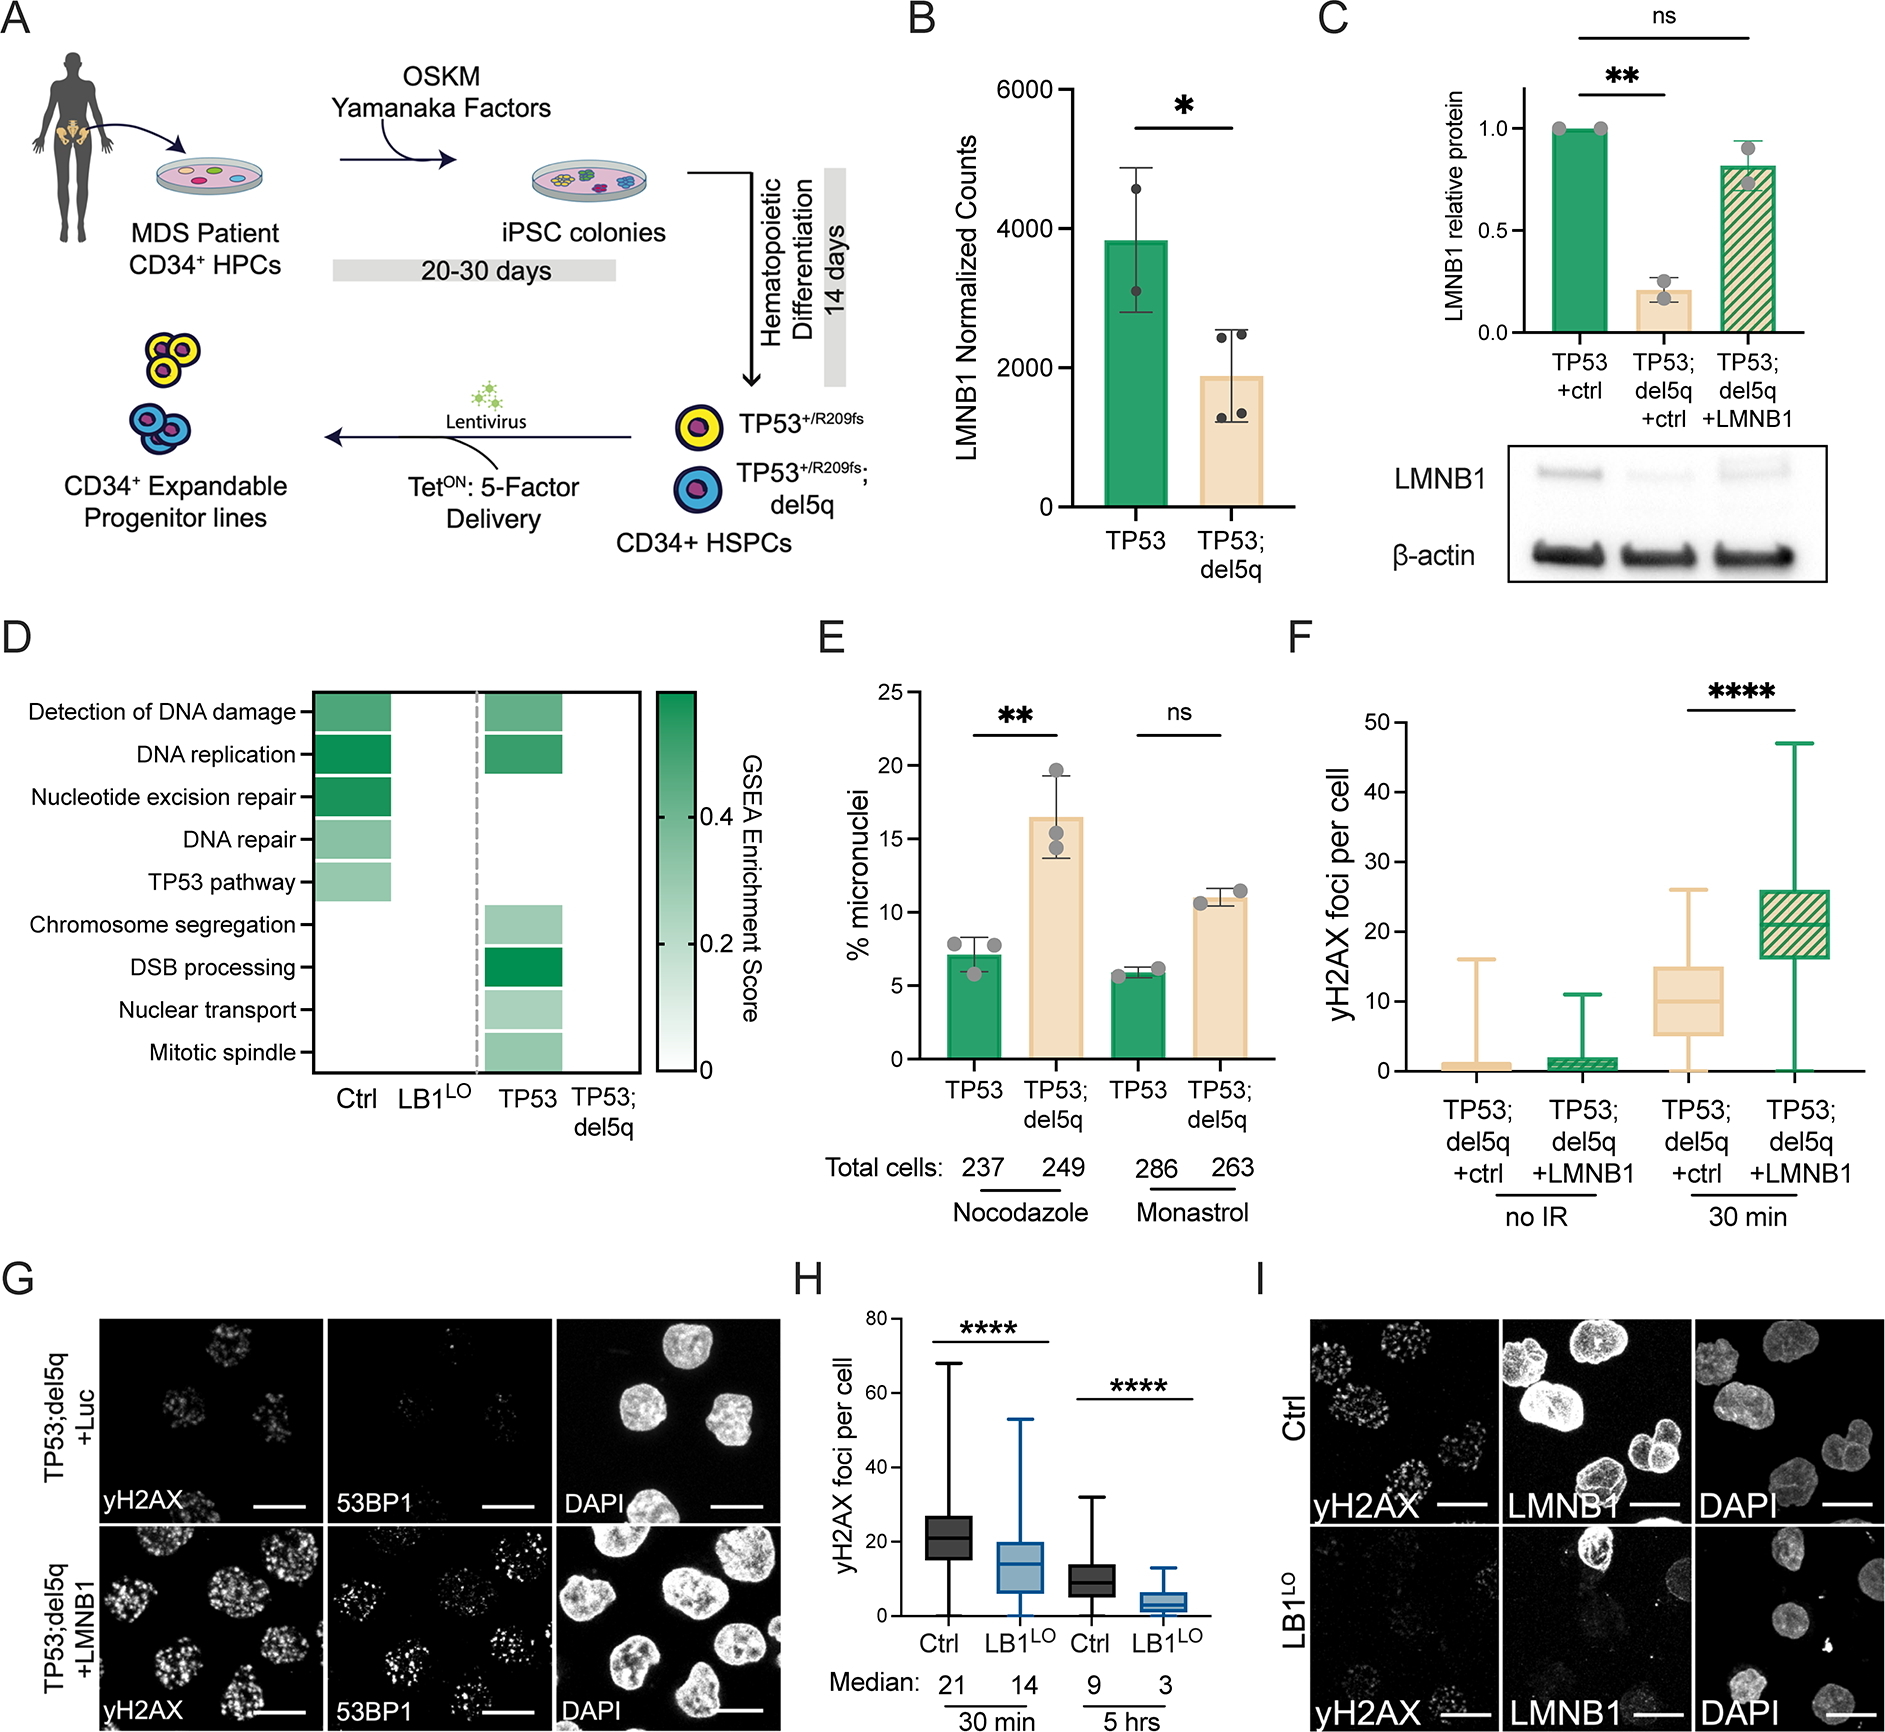
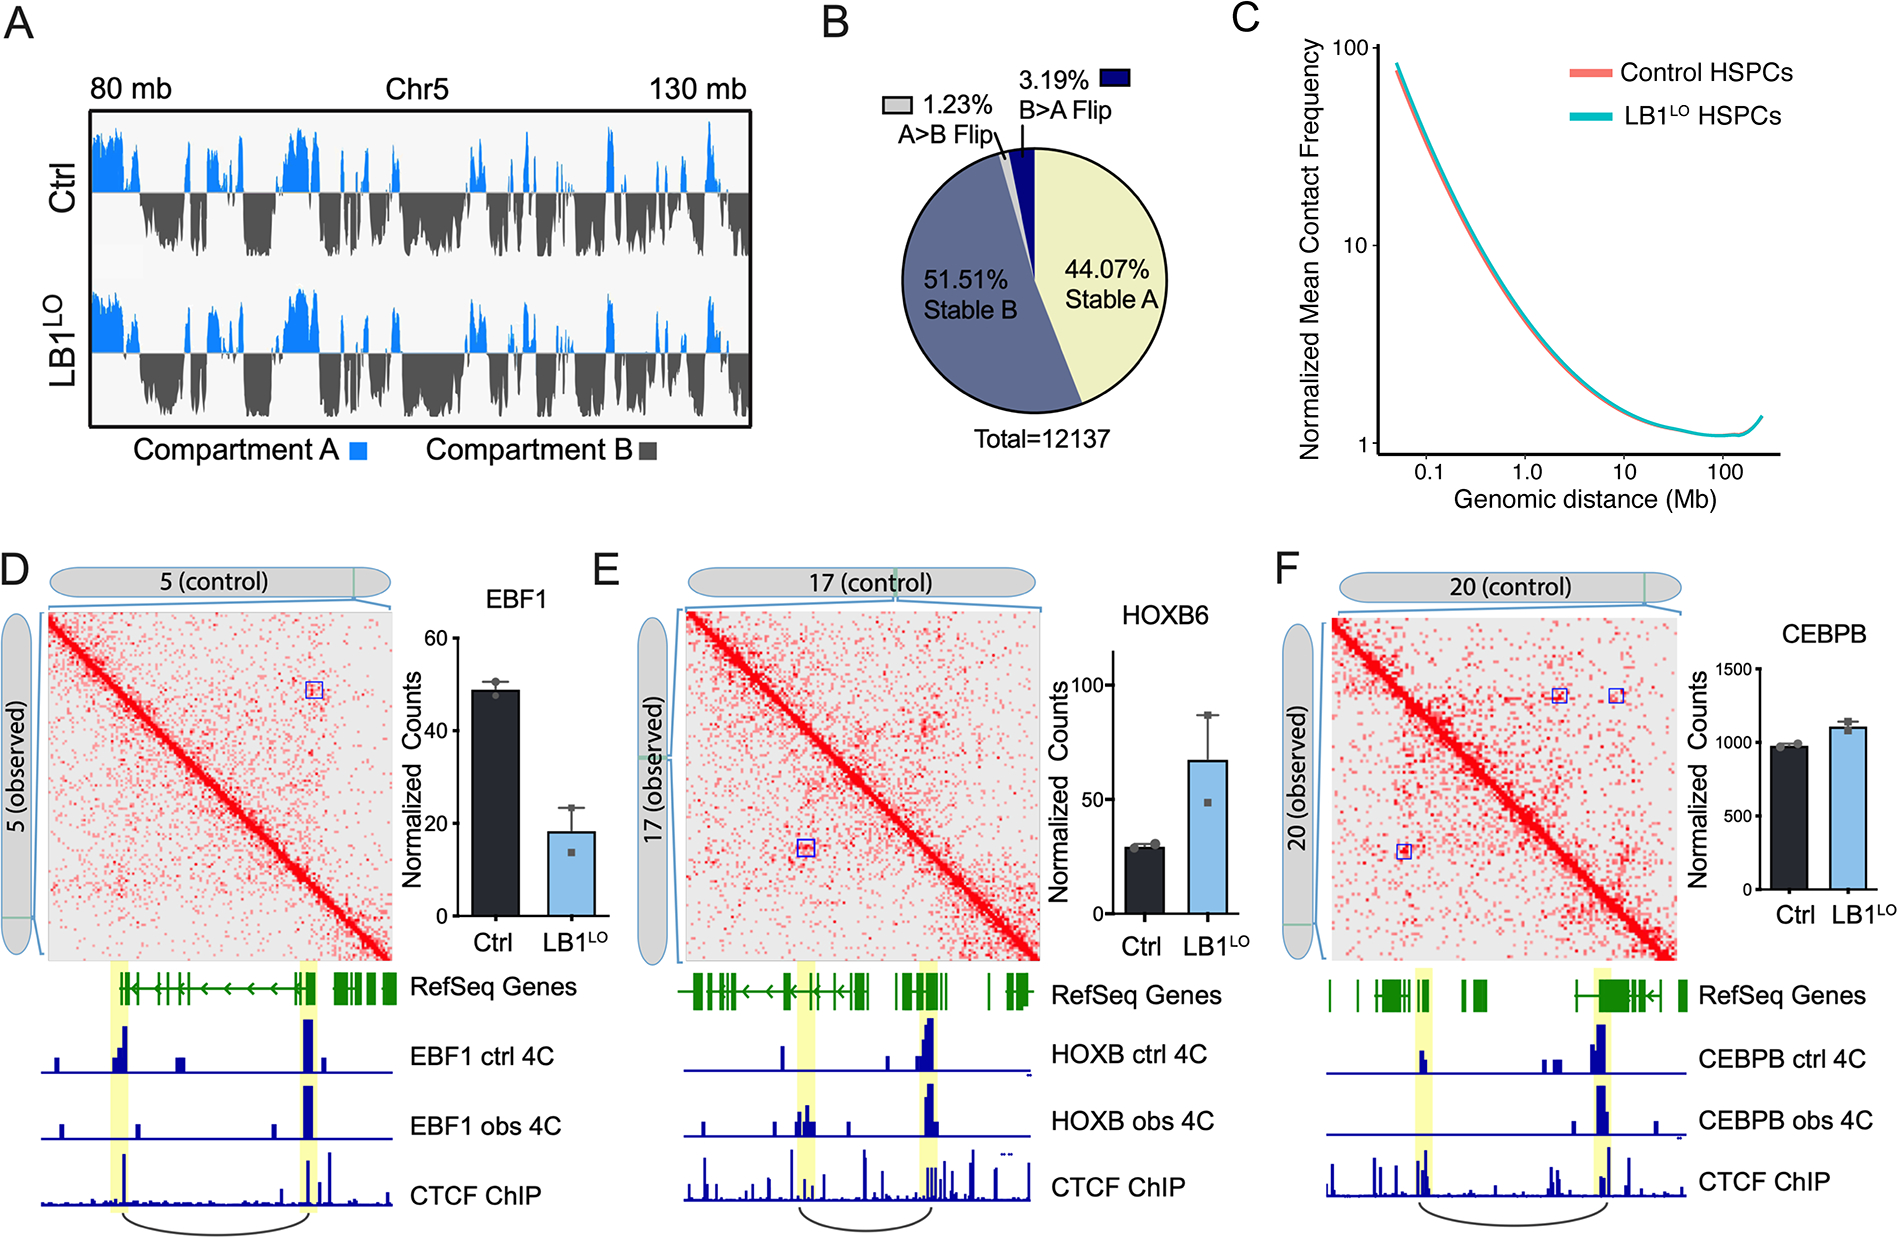
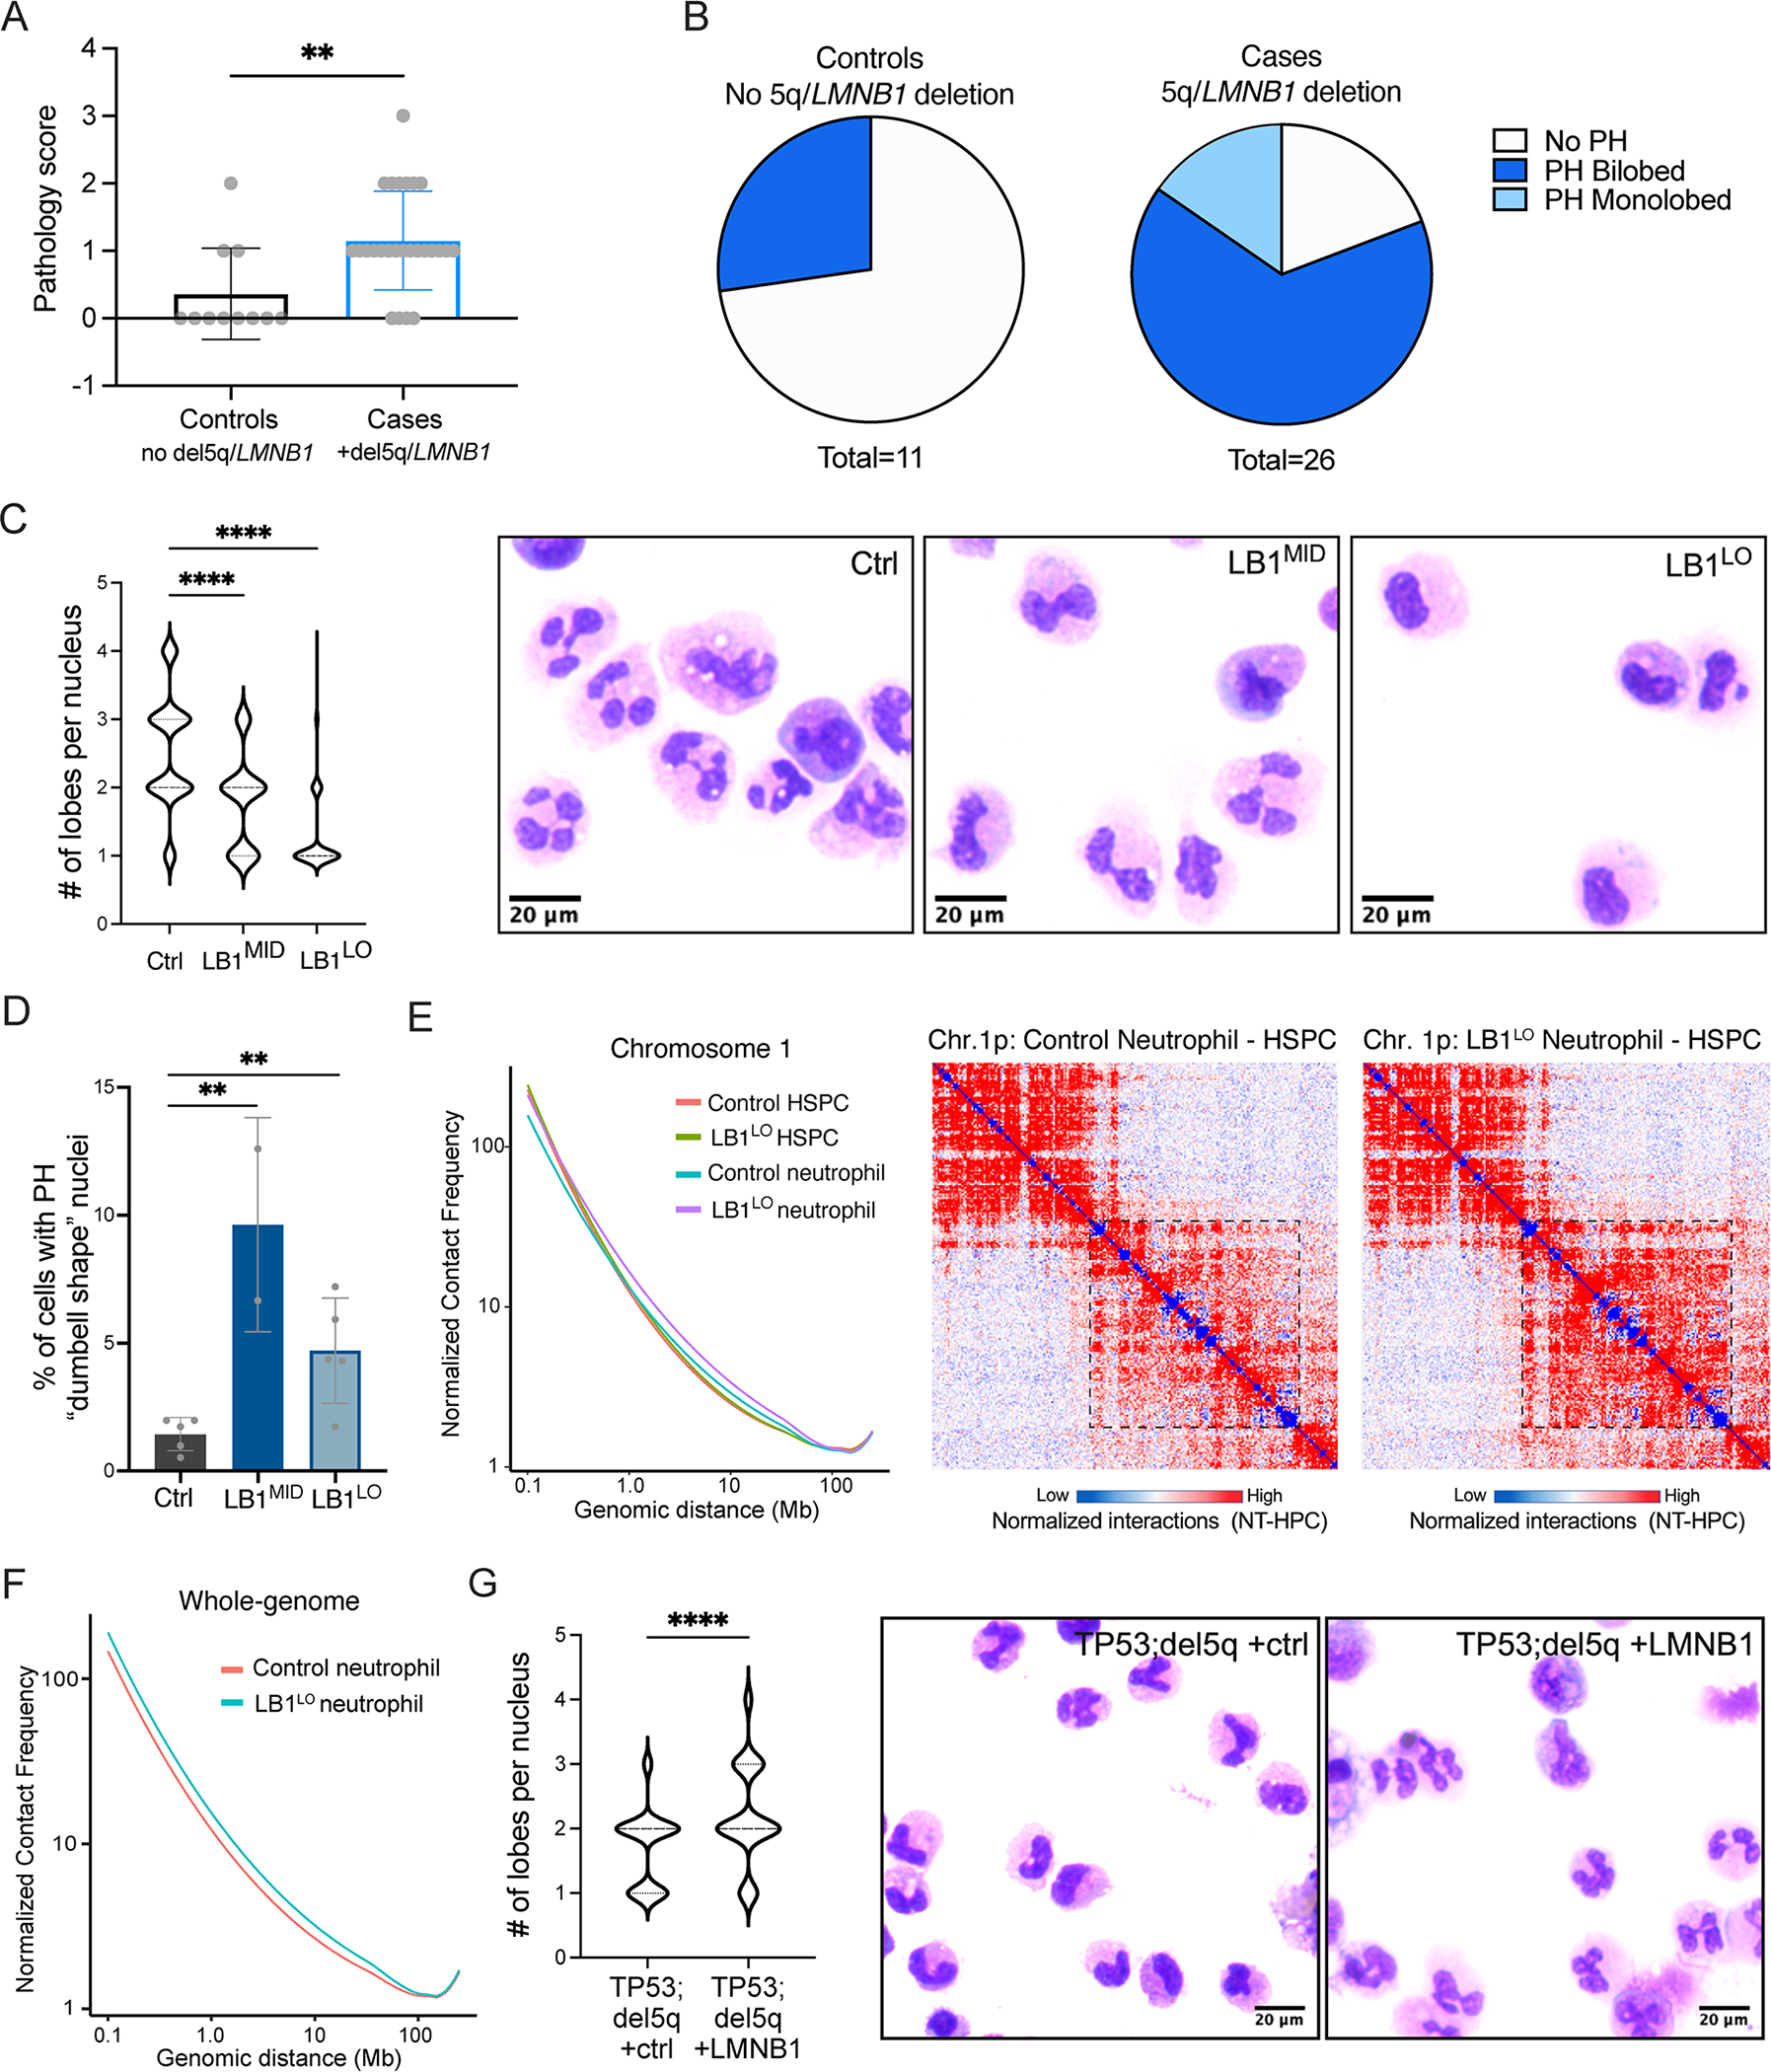
Abnormal nuclear morphology is a hallmark of malignant cells widely used in cancer diagnosis. Pelger-Huët anomaly (PHA) is a common abnormality of neutrophil nuclear morphology of unknown molecular etiology in myeloid neoplasms (MNs). We show that loss of nuclear lamin B1 (LMNB1) encoded on chromosome 5q, which is frequently deleted in MNs, induces defects in nuclear morphology and human hematopoietic stem cell (HSC) function associated with malignancy. LMNB1 deficiency alters genome organization inducing in vitro and in vivo expansion of HSCs, myeloid-biased differentiation with impaired lymphoid commitment, and genome instability due to defective DNA damage repair. Nuclear dysmorphology of neutrophils in patients with MNs is associated with 5q deletions spanning the LMNB1 locus, and lamin B1 loss is both necessary and sufficient to cause PHA in normal and 5q-deleted neutrophils. LMNB1 loss thus causes acquired PHA and links abnormal nuclear morphology with HSCs and progenitor cell fate determination via genome organization.

Keywords: 3D genome; 5q deletions; genome instability; hematopoietic stem and progenitor cells; lineage determination; myeloid neoplasms; neutrophils; nuclear lamins; nuclear morphology.


Conflict of interest statement

Declaration of interests The authors declare no competing interests.

Figures

Figure 1.
Figure 1.. Lamin B1 loss promotes self-renewal and myeloid-biased differentiation in vitro.
A. LMNB1 mRNA expression (log2 RPKM) in the BeatAML cohort of AML patient samples compared to CD34+ HSPCs or bone marrow mononuclear cells (MNC) from matching healthy controls; n=442 AML samples, 13 CD34+ samples, 19 MNC samples; ****p<0.0001, one-way ANOVA, mean ± SD. B. Schematic of experimental workflow for LMNB1 knockdown in CB or PB CD34+ cells, and LMNB1 ORF expression in del5q CD34+ AML cells. C. Lamin B1 protein expression in PB HSPCs transduced with shRNAs targeting LMNB1 (LB1MID or LB1LO) relative to HSP90 control. Mean ± SD of 2 experiments. D. Colony-forming potential of control, LB1MID or LB1LO CB HSPCs per 1000 CD34+ cells. BFU/CFU-E=erythroid, G=granulocyte, M=macrophage, GEMM=mixed lineage, nh=erythroid not hemoglobinized. Mean ± SD of n=6 and n=2 experiments for LB1LO and LB1MID respectively; groups not statistically different, 2-way ANOVA. E. Number of secondary CFU colonies per 1000 primary CB HSPCs. Mean ± SD of 2–3 experiments, *p=0.011, one-way ANOVA. F,G. Frequency of CD34+ cells after 11 days of culture of control, LB1MID, or LB1LO CB HSPCs. CD34+CD38 = HSCs and multipotent progenitors, CD34+CD38+ = committed progenitors. Quantitation (F) and representative flow plots (G) showing mean ± SD of n=2 experiments, *p=0.016 for LB1LO in CD34+CD38 fraction and **p=0.0034 for LB1MID in CD38+CD38+ fraction, 2-way ANOVA. H,I. Frequency of myeloid cells (CD11b+), or lymphoid NK cells (CD56+) or B cells (CD19+), after 4 weeks of MS-5 stromal co-culture of 500 control, LB1MID, or LB1LO CB HSPCs. Quantitation (H) and representative flow plots (I) showing mean ± SD of n=2 experiments, *p<0.035, **p<0.005 for all comparisons, 2-way ANOVA. J. Colony-forming potential of primary del5q AML cells per 1000 CD34+ cells transduced with control or LMNB1 ORF (+LMNB1) lentivirus. n = 4 AML patient samples, ratio paired t-test, **p=0.0053. K. Volcano plot of differentially expressed genes (DEGs; log2 fold change > 0.5 (UP) or < −0.5 (DN), p<0.01) in control or LB1LO CB HSPCs. L. Enrichment score of human HSC and progenitor gene signatures from (Laurenti et al., 2013) and Hallmark gene sets in GSEA analysis of control versus LB1LO CB HSPCs, FDR q < 0.05 for all. See also Figure S1 and Figure S2.
Figure 2.
Figure 2.. Lamin B1 loss promotes myeloid-biased hematopoiesis in vivo.
A. Engraftment of control or LB1LO CB HSPCs transplanted into NSG mice. Mice were transplanted for 14 weeks and human cell engraftment was determined as % human CD45+ transduced cells of total bone marrow cells. Mean ± SEM of 2 independent experiments, n=14 mice for control, n=12 mice for LB1LO; *p=0.023, Welch’s t-test. B,C. Frequency of CD33+ myeloid cells and CD19+ B cells as % of human CD45+ cell engraftment. Quantitation (B) and representative flow plots (C) showing mean ± SD of n=2 independent experiments, n=14 mice for control, n=12 mice for LB1LO; *p<0.025 for both groups, Welch’s t-test. D,E. Frequency of human HSPC populations as % of human CD34+ cells 14 weeks post transplant. Mean ± SD of 2 independent experiments, each condition consists of cells pooled from 5 mice of equivalent engraftment. Quantitation (D) and flow cytometric gating strategy (E) as described in (Doulatov et al., 2010).
Figure 3.
Figure 3.. Single cell analysis of human HSC differentiation in vivo.
A. Combined UMAP of human control and LB1LO CD34+ HSPCs engrafted in NSG mice after filtering and clustering (resolution = 6 × 10⁻⁴) using the Monocle 3 R package. Cells are colored by dataset of origin (control=dark grey, LB1LO=light blue) and clusters (outlined) were manually annotated based on expression of known lineage markers. B. Relative expression (log10) of key hematopoietic lineage markers on the combined UMAP; yellow = highest level of expression (2.5), violet = lowest level (0), and grey = no detected transcripts. C. UMAP of assigned predicted cell type identity based on transcriptional comparison of the combined dataset to the Atlas of human Blood Cells dataset using the SingleR package. Inferred pseudotime trajectory determined by Monocle 3 is overlaid on the plot. D. Relative frequencies (log2 fold change) of HSCs and progenitors in LB1LO vs control HSPCs based on unbiased SingleR analysis. E. Violin plots of expression of myeloid and lymphoid lineage determination factors in single control or LB1LO LMPPs predicted by SingleR. Median expression shown as white dot. See also Figure S3.
Figure 4.
Figure 4.. Lamin B1 loss impairs DNA damage repair in MDS-derived cells.
A. Schematic of iPSC reprogramming of MDS patient CD34+ HSPCs and derivation of TP53+/R209fs (TP53) and TP53+/R209fs;del5q (TP53;del5q) iPSC-MDS HPCs. B. LMNB1 mRNA expression in MDS HPCs, mean ± SD of 2 replicates TP53+/R209fs (TP53), and 4 replicates TP53;del5q, *p<0.04, t-test. C. Lamin B1 protein expression in TP53+/R209fs (TP53) and TP53;del5q MDS HPCs, transduced with control (+ctrl) or LMNB1 ORF (+LMNB1) lentiviruses; mean ± SD of 2 replicates, **p=0.0034. D. Enrichment score of DNA damage-related gene sets in GSEA analysis of TP53+/R209fs (TP53) vs. TP53;del5q MDS HPCs and control vs LB1LO CB HSPCs, FDR q < 0.05 for all comparisons. E. Frequency of micronuclei in TP53+/R209fs (TP53) and TP53;del5q HPCs after monastrol or nocodazole treatment. Mean ± SD of 2–3 experiments, >230 cells per condition, nocodazole **p<0.001, Welch’s t-test, ns = not statistically significant. F,G. Number of γ-H2AX and 53BP1 foci before (no IR) and 30 minutes post-irradiation in TP53;del5q MDS HPCs expressing control or LMNB1 ORF (+LMNB1). Quantitation of γ-H2AX foci (F) and representative images (G). Boxplot showing median and quartiles of n=2 combined experiments, >300 cells per condition, p<0.0001, Mann-Whitney test. Scale bar = 10 μm. H, I. Number of γ-H2AX foci 30 minutes and 5 hours post irradiation in control or LB1LO CB HSPCs. Quantitation (H) and representative staining of γ-H2AX and nuclear lamin B1 levels (I). Boxplot showing median and quartiles of n=3 combined experiments, >300 cells per condition, ****p<0.0001, Mann-Whitney test. Scale bar = 10 μm. See also Figure S4.
Figure 5.
Figure 5.. Lamin B1 loss alters 3D chromatin organization.
A. A and B compartment scores in control or LB1LO CB HSPCs over a representative genomic region (chromosome 5: 80–130 Mb). Blue denotes positive signal in PC1 (A compartment), grey is negative signal in PC2 (B compartment). Data from 2 combined replicates. B. Proportion of genomic regions switching between A and B compartments, or regions that did not switch compartments, in control compared to LB1LO CB HSPCs. Data from 2 combined replicates. C. Line of best fit of the mean whole genome Hi-C contact frequencies (normalized for depth) over genomic distance for control and LB1LO CB HSPCs; 100 kb resolution. D-F. Contact matrices of control or LB1LO CB HSPCs at EBF1 (D), HOXB (E), and CEBPB (F) loci. Control: control contacts in the top right triangle; observed: LB1LO contacts in the bottom left triangle. Significant loops called by HOMER are denoted with a blue square. mRNA expression is displayed on the right, mean ± SD of 2 replicates. Virtual 4C tracks generated from original Hi-C matrix signal denote the interaction signal at promoter and enhancer regions. CTCF ChIP-seq track from CD34+ cord blood HSPCs denotes regions of CTCF binding and loop anchors. See also Figure S5.
Figure 6.
Figure 6.. Lamin B1 deletion causes pseudo-Pelger-Huët anomaly in MDS/AML.
A. Score of abnormal neutrophil nuclear morphology in MDS patient cases (5q/LMNB1 deletion) or controls (MDS without 5q/LMNB1 deletion). Pathology score was calculated based on % of bi-lobed or monolobed PHA neutrophils as follows: 0 (not detected), 1 (1–9%), 2 (10–25%), 3 (>25%). Welch’s approximate t-test, **p=0.008, mean ± SD. B. Proportion of MDS cases (5q/LMNB1 deletion) or controls (no 5q/LMNB1 deletion) with abnormal bi-lobed or monolobed PHA neutrophils. Fisher’s exact test p=0.0028. C. Number of nuclear lobes in neutrophils derived from control, LB1MID, or LB1LO CB HSPCs. Quantitation (left) and representative May-Grunwald-Giemsa staining of neutrophils (right). ANOVA Kruskal-Wallis test, n=5 experiments for LB1LO, n=2 experiments for LB1MID, ****p<0.0001. D. Frequency of neutrophils exhibiting the classical bi-lobed “dumbbell shape” Pelger-Huet nuclear morphology derived from control, LB1MID, or LB1LO CB HSPCs. Mean ± SD of 2–5 experiments, **p<0.01 for both LB1MID and LB1LO, t-test. E,F. Line of best fit of the mean chromosome 1 (E) or whole genome (F) Hi-C contact frequencies (normalized for depth) over genomic distance for control and LB1LO CB HSPCs and neutrophils; 100 kb resolution. Right: contact heatmap of a representative genomic region (chr. 1p) at 500 kb resolution; color indicates difference in contacts between neutrophils and HSPCs. The box indicates a region of increased long-range interactions in LB1LO compared to control neutrophils. G. Number of nuclear lobes in neutrophils derived from TP53;del5q MDS HPCs overexpressing control or LMNB1 ORF. Quantitation (left) and representative May-Grunwald-Giemsa staining neutrophils (right). Mann-Whitney test, 2 experiments, ****p<0.0001. See also Figure S6.

Comment in

Similar articles

Cited by

References

    1. Aran D, Looney AP, Liu L, Wu E, Fong V, Hsu A, Chak S, Naikawadi RP, Wolters PJ, Abate AR, et al. (2019). Reference-based analysis of lung single-cell sequencing reveals a transitional profibrotic macrophage. Nature Immunology 20, 163–172. 10.1038/s41590-018-0276-y. - DOI - PMC - PubMed
    1. Arber DA, Orazi A, Hasserjian R, Thiele J, Borowitz MJ, Le Beau MM, Bloomfield CD, Cazzola M, and Vardiman JW (2016). The 2016 revision to the World Health Organization classification of myeloid neoplasms and acute leukemia. Blood 127, 2391–2405. 10.1182/blood-2016-03-643544. - DOI - PubMed
    1. Arnould C, Rocher V, Finoux A-L, Clouaire T, Li K, Zhou F, Caron P, Mangeot PE, Ricci EP, Mourad R, et al. (2021). Loop extrusion as a mechanism for formation of DNA damage repair foci. Nature 590, 660–665. 10.1038/s41586-021-03193-z. - DOI - PMC - PubMed
    1. Best S, Salvati F, Kallo J, Garner C, Height S, Thein SL, and Rees DC (2003). Lamin B-receptor mutations in Pelger-Huet anomaly. Br J Haematol 123, 542–544. 10.1046/j.1365-2141.2003.04621.x. - DOI - PubMed
    1. Bin Imtiaz MK, Jaeger BN, Bottes S, Machado RAC, Vidmar M, Moore DL, and Jessberger S (2021). Declining lamin B1 expression mediates age-dependent decreases of hippocampal stem cell activity. Cell Stem Cell 28, 967–977.e968. 10.1016/j.stem.2021.01.015. - DOI - PubMed

Publication types