. 2022 Apr 7;29(4):515-527.e8.
doi: 10.1016/j.stem.2022.02.009. Epub 2022 Mar 11.

3D-organoid culture supports differentiation of human CAR+ iPSCs into highly functional CAR T cells

Affiliations

3D-organoid culture supports differentiation of human CAR+ iPSCs into highly functional CAR T cells

Zhiqiang Wang et al. Cell Stem Cell. .

Erratum in

Abstract

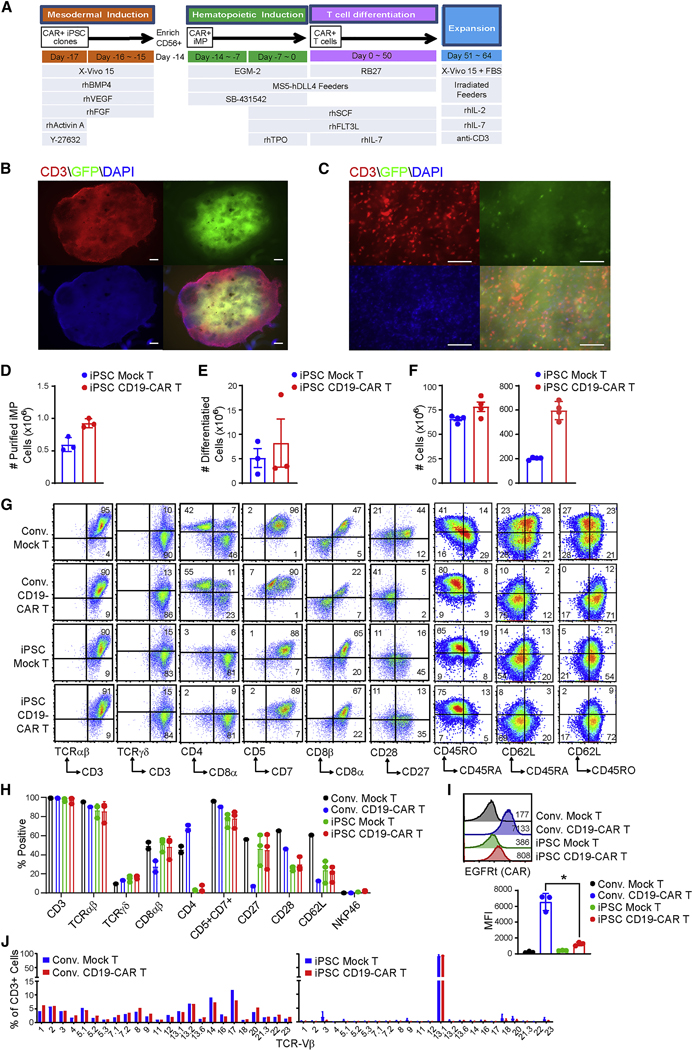
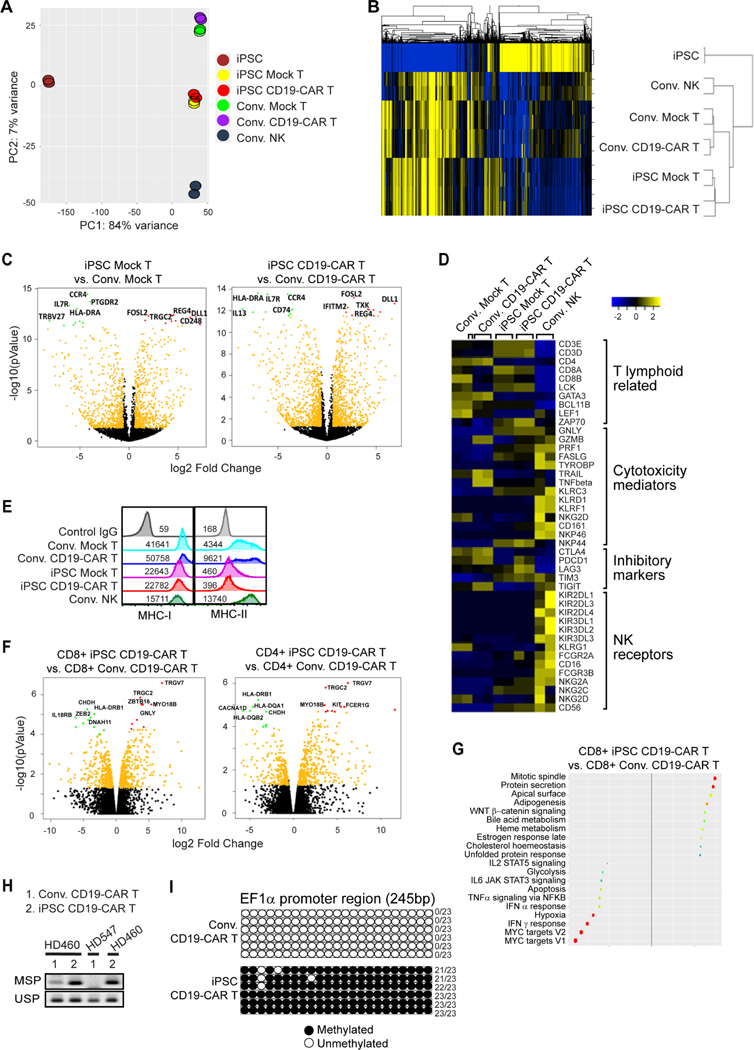
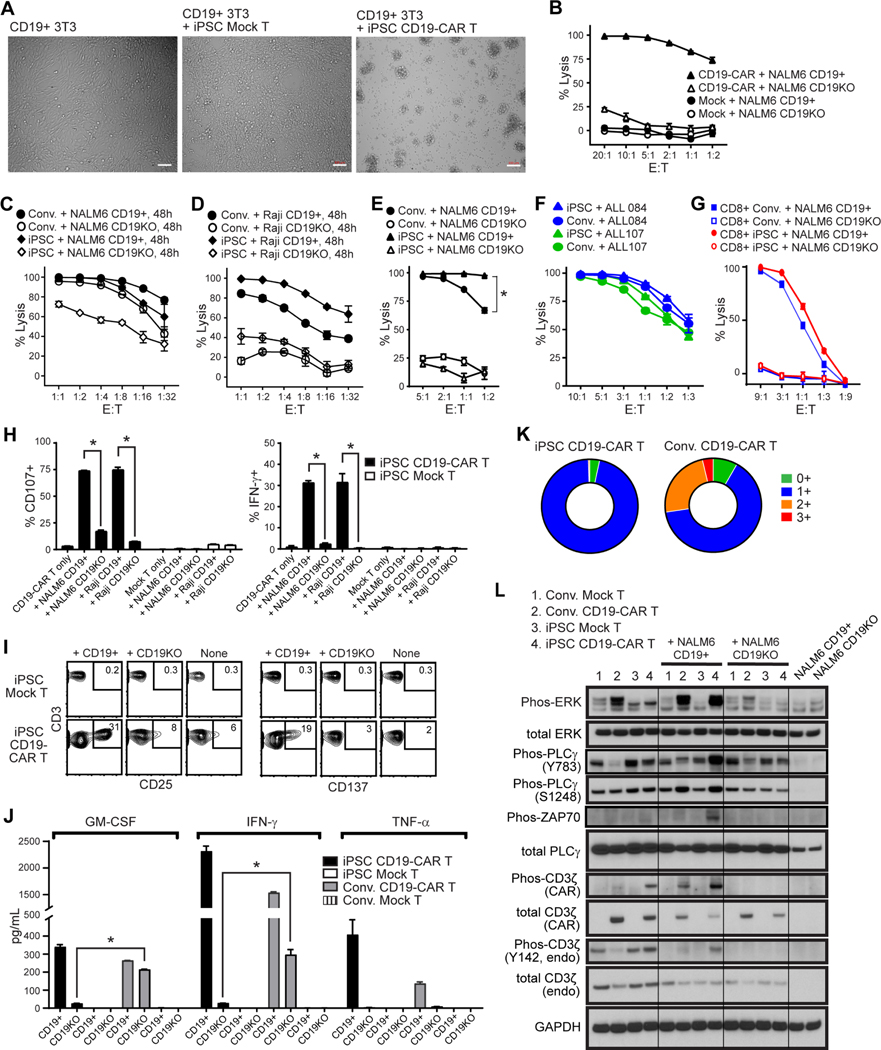
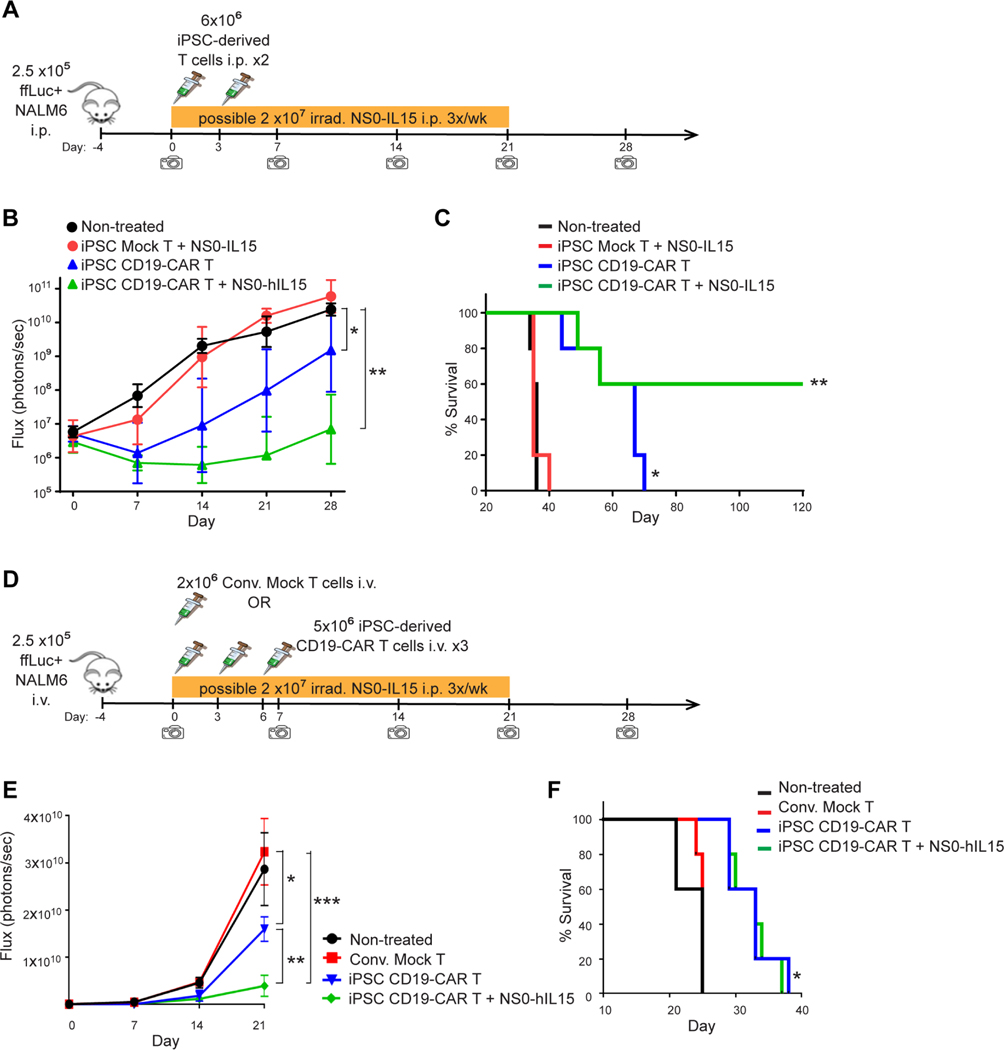
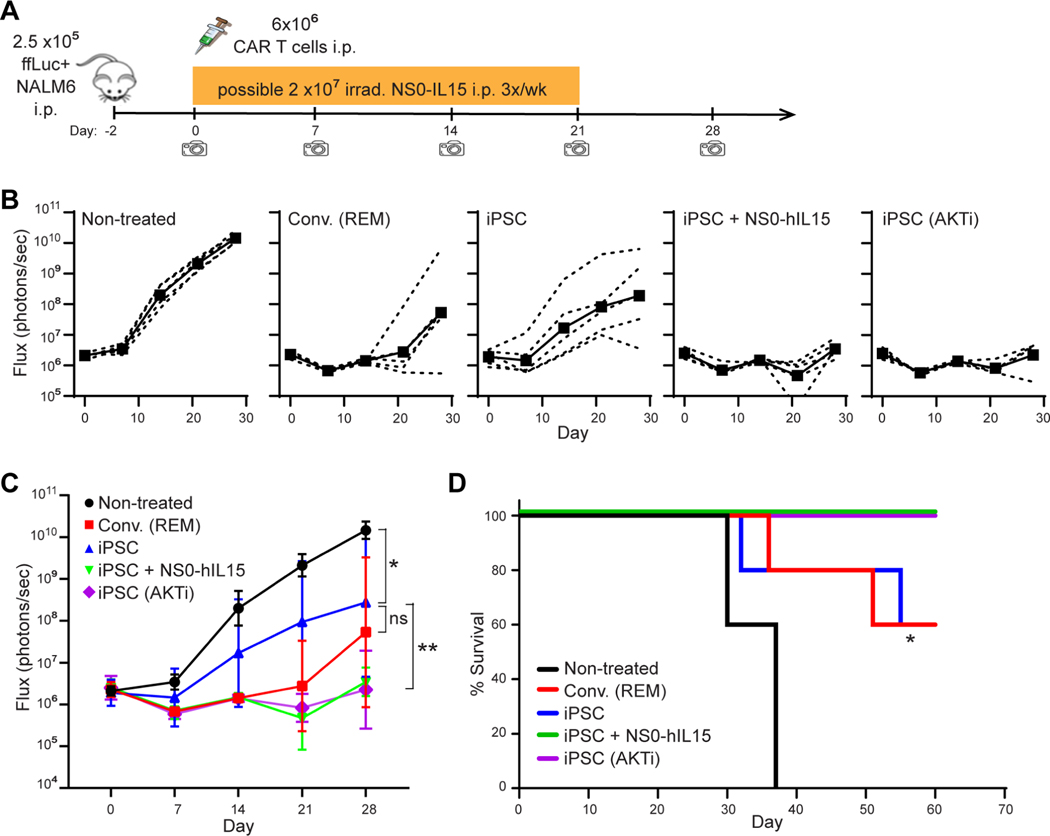
Unlimited generation of chimeric antigen receptor (CAR) T cells from human-induced pluripotent stem cells (iPSCs) is an attractive approach for "off-the-shelf" CAR T cell immunotherapy. Approaches to efficiently differentiate iPSCs into canonical αβ T cell lineages, while maintaining CAR expression and functionality, however, have been challenging. We report that iPSCs reprogramed from CD62L+ naive and memory T cells followed by CD19-CAR engineering and 3D-organoid system differentiation confers products with conventional CD8αβ-positive CAR T cell characteristics. Expanded iPSC CD19-CAR T cells showed comparable antigen-specific activation, degranulation, cytotoxicity, and cytokine secretion compared with conventional CD19-CAR T cells and maintained homogeneous expression of the TCR derived from the initial clone. iPSC CD19-CAR T cells also mediated potent antitumor activity in vivo, prolonging survival of mice with CD19+ human tumor xenografts. Our study establishes feasible methodologies to generate highly functional CAR T cells from iPSCs to support the development of "off-the-shelf" manufacturing strategies.

Keywords: 3D-organoid culture; CAR; PSC-ATO; chimeric antigen receptor T cells; human iPSC; immunotherapy; off-the-shelf; pluripotent stem cell-artificial thymic organoid culture.


Conflict of interest statement

Declaration of interests C.E.B., S.J.F., and Z.W. are listed on patent(s) relating to this work: Forman, S.J., Brown, C.E., and Wang, Z. Generation of chimeric antigen receptor modified T cells from stem cells and therapeutic uses thereof. U.S. application n. 62/931125. PCT application no. PCT/US2020/059216. A.M.H., C.S.S., and G.M.C. are co-founders of Pluto Immunotherapeutics, which holds certain rights over intellectual property relating to the ATO system.

Figures

Figure 1.
Figure 1.. Generation of iPSC-derived CD19-CAR T cells.
(A) Schematic of events (top), cell type (middle) and media conditions (bottom) during PSC-ATO culture. Reference online STAR Methods. (B, C), Seven-week organoid cultures of iPSC CD19-CAR T cells with GFP+ DLL4+ MS5 feeder cells were fixed by 2% paraformaldehyde and stained with CD3 (red) and DAPI (blue) in situ. Composites of individual images have been stitched together. White bars indicate scales of 500 μm (B) and 100 μm (C). (D) Number of differentiated mesodermal progenitor cells (iMP) derived from 1 million mock-transduced or CD19-CAR expressing Tn/mem-iPSC. Data of three separate experiments is depicted, with mean ± S.E.M as bars. (E) Number of differentiated T cells derived from 1 million mock-transduced or CD19-CAR expressing iMP. Data of three separate experiments is depicted, with mean ± S.E.M as bars. (F) Yield of iPSC-derived Mock T and CD19-CAR T cells. T cells were expanded as indicated in (A). Numbers of cells expanded from 1 × 10⁶ differentiated T cells (Left) or from 1 × 10⁶ iPSC cells (Right) are depicted using data of three separate experiments, with mean ± S.E.M as bars. (G) Representative flow cytometric analysis of the indicated markers on conventional (Conv.) vs. iPSC-derived mock-transduced (Mock) and CD19-CAR expressing T cells. Percentages of cells expressing each marker are indicated in the relevant quadrants, which were drawn based on isotype control staining. (H) Percentages of cells staining with the indicated markers in three separate experiments, with mean ± S.D. as bars. (I) Comparison of transgene expression levels on conventional (Conv.) vs. iPSC-derived Mock T and CD19-CAR T cells. Top, representative histograms of EGFRt staining as a marker for CAR expression, with mean fluorescence intensity (MFI) indicated. Bottom, transgene MFI data of three separate experiments is depicted, with mean ± S.D. as bars. *, P = 0.0011 using Student’s t-test. (J) TCR Vx repertoire of conventional vs. iPSC-derived Mock T and CD19-CAR T cells.
Figure 2.
Figure 2.. Gene and signaling signature of iPSC CD19-CAR T cells.
(A) Principle components analysis (PCA) and (B) hierarchical clustering of global transcriptional profiles of two samples of iPSC, conventional (Conv.) mock-transduced (Mock) or CD19-CAR T cells, iPSC-derived Mock T or CD19-CAR T cells, or conventional PBMC-derived NK cells. (C) Vocano plots of iPSC Mock T vs. Conv. Mock T cells (left), or of iPSC CD19-CAR T vs. Conv. CD19-CAR T cells (right). Top five upregulated genes in conventional cells are highlighted with green dots, while those in iPSC-derived cells are highlighted by red dots. (D) Heat map of z score value of T lymphoid related genes, cytotoxicity mediators, inhibitory markers and NK receptor genes. (E) HLA ABC (MHC-I) and HLA-DR,DP,DQ (MHC-II) expression levels on the surface of Conv. Mock T, Conv.CD19-CAR T, iPSC Mock T and iPSC CD19-CAR T cells, with mean fluorescence intensity (MFI) indicated. (F) Vocano plots of CD8+ iPSC CD19-CAR T vs. CD8+ Conv. CD19-CAR T cells (left), or of CD4+ iPSC CD19-CAR T vs. CD4+ Conv. CD19-CAR T cells (right). Top five upregulated genes in conventional cells are highlighted with green dots, while those in iPSCderived cells are highlighted by red dots. (G) Bubble plot showing top up- or down- regulated signaling pathway derived from GSEA comparison of CD8+ iPSC CD19-CAR T vs. CD8+ Conv. CD19-CAR T cells. (H) Bisulfite converted genomic DNA was used as a template for PCR analysis using methylationspecific primers (MSP) and unmethylation-specific primers (USP) within the EF1α promoter. (I) EF1α promoter methylation determination by bisulfite sequencing. Region 114–360bp of EF1α promoter was PCR amplified from bisulfite converted genomic DNA, sub-cloned, and 6 clones for each group were sequenced. Number of methylated CG sites for each clone, out of the 23 CG sites in this 245bp region, are indicated at the right of each row.
Figure 3.
Figure 3.. Functional profile of iPSC CD19-CAR T cells.
(A), Brightfield images after 4 hour co-culture of iPSC-derived mock-transduced (Mock) or CD19-CAR T cells with CD19+ 3T3 cells at an effector-to-target (E:T) ratio of 4:1. White bars indicate scale of 100 μm. (B-E), Cytotoxic activity of iPSC CD19-CAR T cells against CD19+ or CD19-negative/knockout (CD19KO) NALM6 (B, C, E), or Raji (D) target cells when co-cultured at the indicated E:T ratios for 4h (B, E) or 48h (C, D). Lytic activity was compared to that of iPSC-derived mock transduced T cells (MOCK, B) or conventional CD19-CAR T cells (Conv., C, D, E). Mean ± S.D. values of duplicate cultures are depicted. *, P < 0.001 by two way ANOVA test in (E). (F), Cytotoxic activity of iPSC-derived (iPSC) or conventional (Conv.) CD19-CAR T cells against patient derived ALL cells when co-cultured at the indicated E:T ratios for 4h. (G) Cytotoxic activity of flow cytometry sorted CD8+ iPSC-derived (CD8+ iPSC) or conventional CD8+ CD19-CAR T cells (CD8+ Conv.) against CD19+ or CD19-negative/knockout (CD19KO) NALM6. (H) Degranulation (i.e., surface CD107, left) and intracellular IFN-g levels (right) in iPSC-derived mock-transduced (Mock) or CD19-CAR T cells was measured by flow cytometry after co-culture with the indicated stimulator cells (X-axis labels) at an E:T ratio of 1:1 for 5 hours in the presence of the Golgi Stop protein transport inhibitor. *, P < 0.01 by Students t-test. (I) Flow cytometric analysis of activation markers were compared between iPSCderived Mock T and CD19-CAR T cells that were unstimulated (None), or stimulated with CD19+ or CD19-negative/knockout (CD19KO) NALM6 at an E:T ratio of 1:1 for 24 hours. Percentages of CD3+ cells expressing CD25 or CD137/4–1BB are indicated in each contour plot, with gates drawn based on isotype control staining. (J) Cytokine production by iPSC-derived or conventional (Conv.) Mock T or CD19-CAR T cells was measured by Bio-Plex analysis of supernatants harvested 24 hours after coculture with CD19+ or CD19-negative/knockout (CD19KO) NALM6 cells at an E:T ratio of 1:1. *, P < 0.001 by Student’s t-test. (K) T cell exhaustion marker profile of iPSC-derived or conventional (Conv.) CD19-CAR T cells after being re-challenged by CD19+ NALM6 cells every 2 days for a total of 3 stimulations at an E:T ratio of 1:2. Cells were stained with anti-PD-1, anti-TIM-3, anti-LAG-3 and percentages of CD3+ cells staining for no (0+), one (1+), two (2+) or all three (3+) markers were determined by flow cytometry. (L) Western Blot analysis of ERK, phosphorylated ERK, PLCγ, PLCγ phorphorylated at Y782, PLCγ phosphorylated at Ser1248, endogenous CD3ζ, phosphorylated endogenous CD3ζ, CD3ζ within the CAR, phosphorylated CD3ζ within the CAR, or GAPDH as a loading control in the indicated T cells cultured for 60 minutes alone, or with NALM6 tumors that are either CD19+ or CD19-negative (CD19KO). Tumor cells cultured alone were also examined as controls. Composites of individual images have been stitched together.
Figure 4.
Figure 4.. iPSC CD19-CAR T cells demonstrate potent anti-tumor activity in vivo.
(A) Schema of animal studies using intraperitoneal (i.p.) tumor model. On day −4, NSG mice were inoculated i.p. with 2.5×10⁵ ffluc+ NALM6 cells. Mice were then either left untreated, or treated with 6×10⁶ iPSC-derived mock-transduced (Mock) or CD19-CAR T cells i.p. on days 0 and 3; in one group receiving iPSC CD19-CAR T cells, 2×10⁷ irradiated NS0-hIL15 cells were also administered 3 times a week for 3 weeks. Tumor burden was determined by weekly bioluminescent imaging. (B), Geometric mean ± 95% CI of i.p. tumor ffLuc Flux over time. Using two-way ANOVA test: *, P = 0.0008, ** P < 0.0001. (C), Kaplan-Meier survival analysis of i.p. xenografted mice. Using Mantel-Cox test: *, P = 0.0034 comparing the iPSC CD19-CAR T treated group to the non-treated group; **, P = 0.0016 comparing the iPSC CD19-CAR T + NS0-hIL15 treated group to the iPSC CD19-CAR T treated group. (D), Schema of animal studies using intravenous (i.v.) tumor model. On day −4, NSG mice were inoculated i.v. with 2.5×10⁵ ffluc+ NALM6 cells. Mice were then either left untreated, or treated with 5×10⁶ iPSC-derived CD19-CAR T cells i.v. on days 0, 3 and 6; where indicated, 2×10⁷ irradiated NS0-hIL15 cells were administered 3 times a week for 3 weeks. Other control groups included mice that received 2×10⁶ donor-matched Tn/mem-derived Mock T at day 0. Tumor burden was determined by weekly bioluminescent imaging. (E), Geometric mean ± 95% CI of i.v. tumor ffLuc Flux over time. Using two-way ANOVA test: *, P = 0.0019, **, P = 0.0002, ***, P < 0.0001. (F), Kaplan-Meier survival analysis of i.v. xenografted mice. Using Mantel-Cox test: *, P = 0.0035 comparing either iPSC CD19-CAR T treated group to the non-treated group.
Figure 5.
Figure 5.. Combination with IL15 or pre-treatment with AKT inhibitor (AKTi) improves anti-tumor activity of iPSC CD19-CAR T cells in vivo.
(A) Schema of animal studies using intraperitoneal (i.p.) tumor model. On day −2, NSG mice were inoculated i.p. with 2.5×10⁵ ffluc+ NALM6 cells. Mice were then either left untreated, or treated i.p. on day 0 with 6×10⁶ Conv. CD19-CAR T cells that had undergone REM, or iPSC CD19-CAR T cells with or without AKT inhibitor (AZD5363) treatment during expansion; in one group receiving iPSC CD19-CAR T cells, 2×10⁷ irradiated NS0-hIL15 cells were also administered i.p. 3 times a week for 3 weeks. Tumor burden was determined by weekly bioluminescent imaging. (B, C), Tumor ffLuc Flux of individual mice (dashed lines) and geometric mean ± 95% CI of tumor ffLuc Flux (solid lines) over time. Using two-way ANOVA test: *, P = 0.0157, iPSC CD19-CAR T vs. Non-treated; **, P = 0.0178, comparing iPSC CD19-CAR T + NS0+hIL15 or iPSC CD19-CAR T (AKTi) treated groups to iPSC CD19-CAR T treatment alone. (D), Kaplan-Meier survival analysis of i.p. xenografted mice. Using Mantel-Cox test: *, P = 0.0008 comparing the iPSC CD19-CAR T treated group to the non-treated group; P = 0.1342 comparing the iPSC CD19-CAR T + NS0-hIL15 treated group, or iPSC CD19-CAR T (AKTi) treated group to the iPSC CD19-CAR T treated group.

Comment in

Similar articles

Cited by

References

    1. Akbar AN, and Henson SM (2011). Are senescence and exhaustion intertwined or unrelated processes that compromise immunity? Nature reviews Immunology 11, 289–295. - PubMed
    1. Alizadeh D, Wong RA, Yang X, Wang D, Pecoraro JR, Kuo CF, Aguilar B, Qi Y, Ann DK, Starr R, et al. (2019). IL15 Enhances CAR-T Cell Antitumor Activity by Reducing mTORC1 Activity and Preserving Their Stem Cell Memory Phenotype. Cancer Immunol Res 7, 759–772. - PMC - PubMed
    1. Black J, and Vos JM (2002). Establishment of an oriP/EBNA1-based episomal vector transcribing human genomic beta-globin in cultured murine fibroblasts. Gene Ther 9, 1447–1454. - PubMed
    1. Brady BL, Steinel NC, and Bassing CH (2010). Antigen receptor allelic exclusion: an update and reappraisal. Journal of immunology 185, 3801–3808. - PMC - PubMed
    1. Brentjens RJ, Riviere I, Park JH, Davila ML, Wang X, Stefanski J, Taylor C, Yeh R, Bartido S, BorquezOjeda O, et al. (2011). Safety and persistence of adoptively transferred autologous CD19-targeted T cells in patients with relapsed or chemotherapy refractory B-cell leukemias. Blood 118, 4817–4828. - PMC - PubMed

Publication types

Substances