

Global, regional, and national consumption of animal-source foods between 1990 and 2018: findings from the Global Dietary Database
- PMID: 35278390
- PMCID: PMC8926870
- DOI: 10.1016/S2542-5196(21)00352-1
Global, regional, and national consumption of animal-source foods between 1990 and 2018: findings from the Global Dietary Database
Erratum in
-
Correction to Lancet Planet Health 2022; 6: e243-56.Lancet Planet Health. 2025 Jul;9(7):101144. doi: 10.1016/S2542-5196(24)00233-X. Epub 2024 Sep 10. Lancet Planet Health. 2025. PMID: 39270699 Free PMC article. No abstract available.
Abstract
Background: Diet is a major modifiable risk factor for human health and overall consumption patterns affect planetary health. We aimed to quantify global, regional, and national consumption levels of animal-source foods (ASF) to inform intervention, surveillance, and policy priorities.
Methods: Individual-level dietary surveys across 185 countries conducted between 1990 and 2018 were identified, obtained, standardised, and assessed among children and adults, jointly stratified by age, sex, education level, and rural versus urban residence. We included 499 discrete surveys (91·2% nationally or subnationally representative) with data for ASF (unprocessed red meat, processed meat, eggs, seafood, milk, cheese, and yoghurt), comprising 3·8 million individuals from 134 countries representing 95·2% of the world population in 2018. We used Bayesian hierarchical models to account for differences in survey methods and representativeness, time trends, and input data and modelling uncertainty, with five-fold cross-validation.
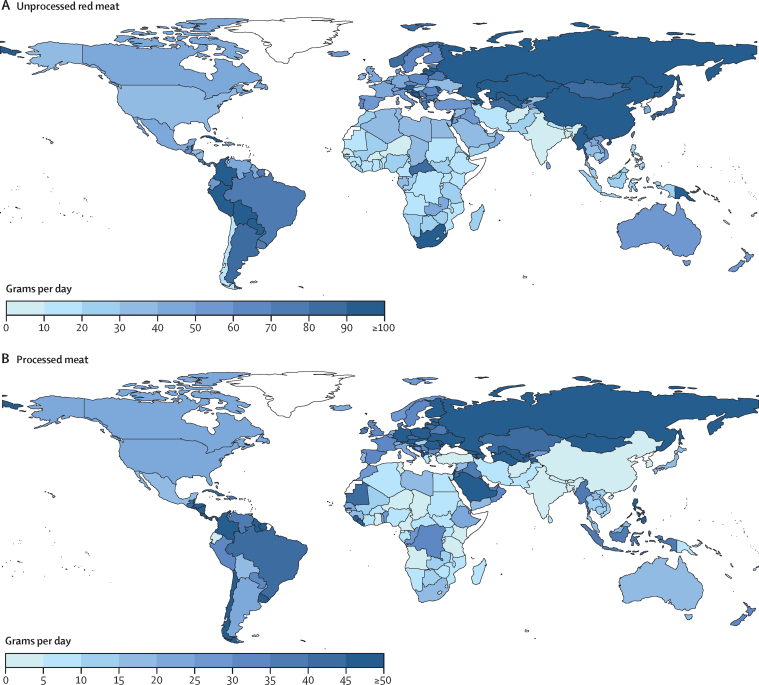
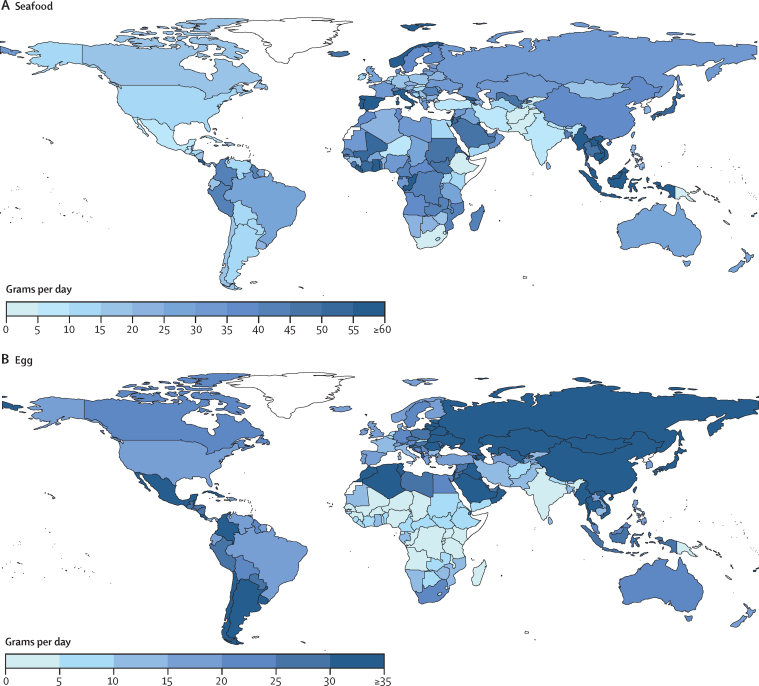
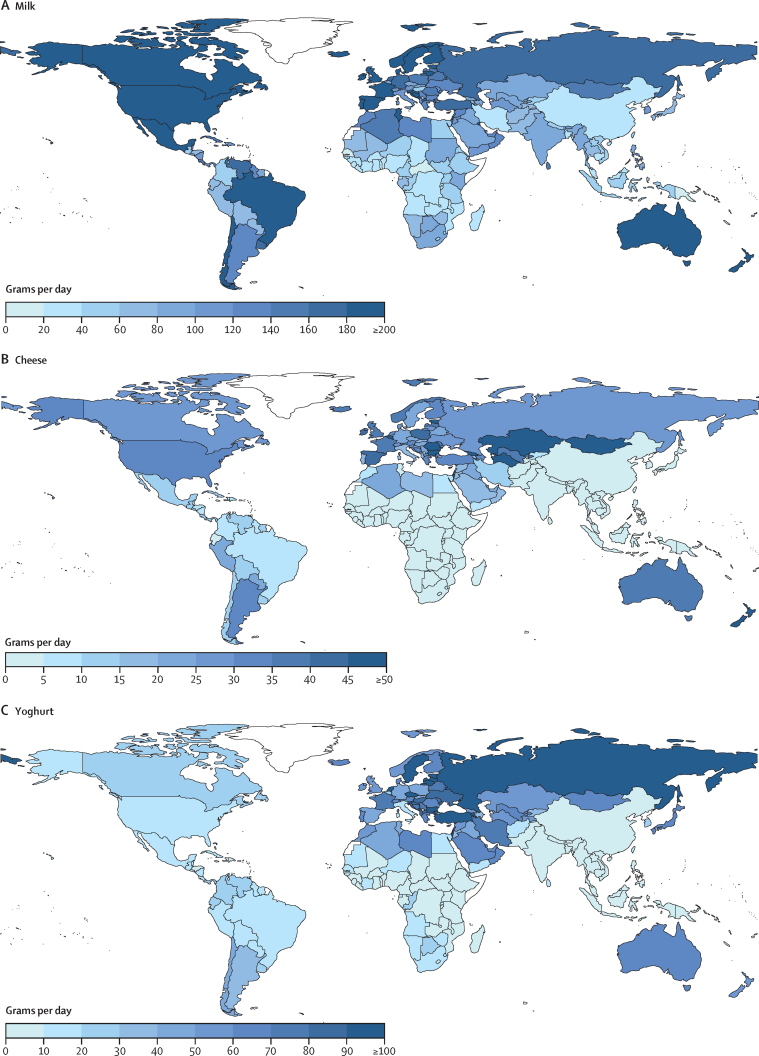
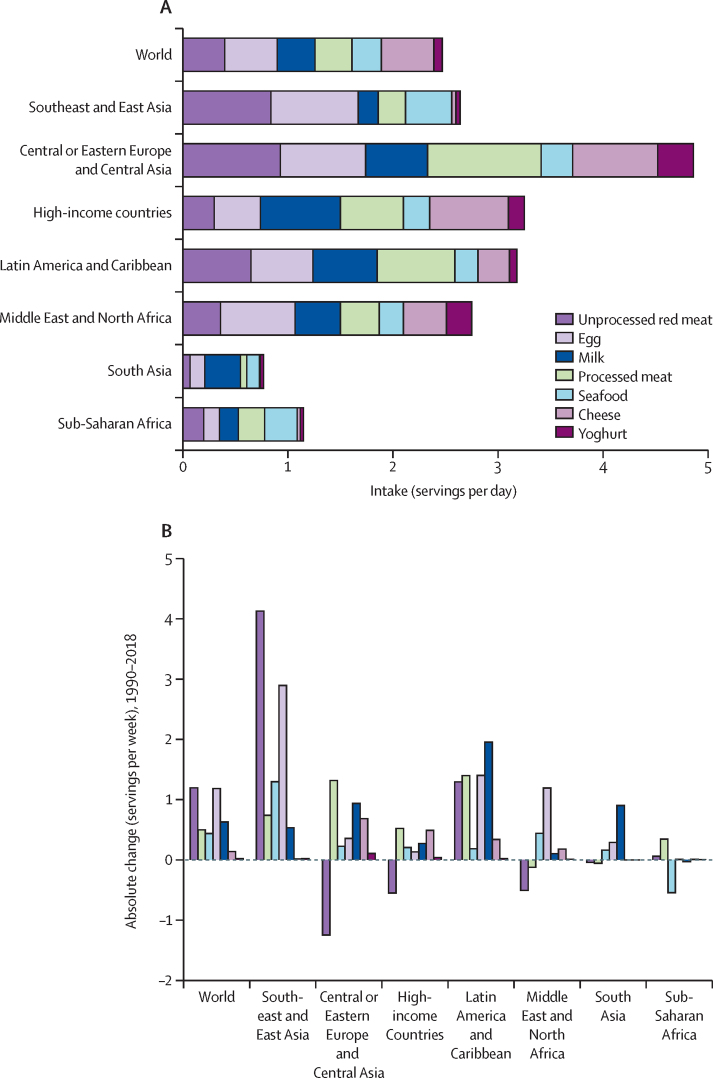
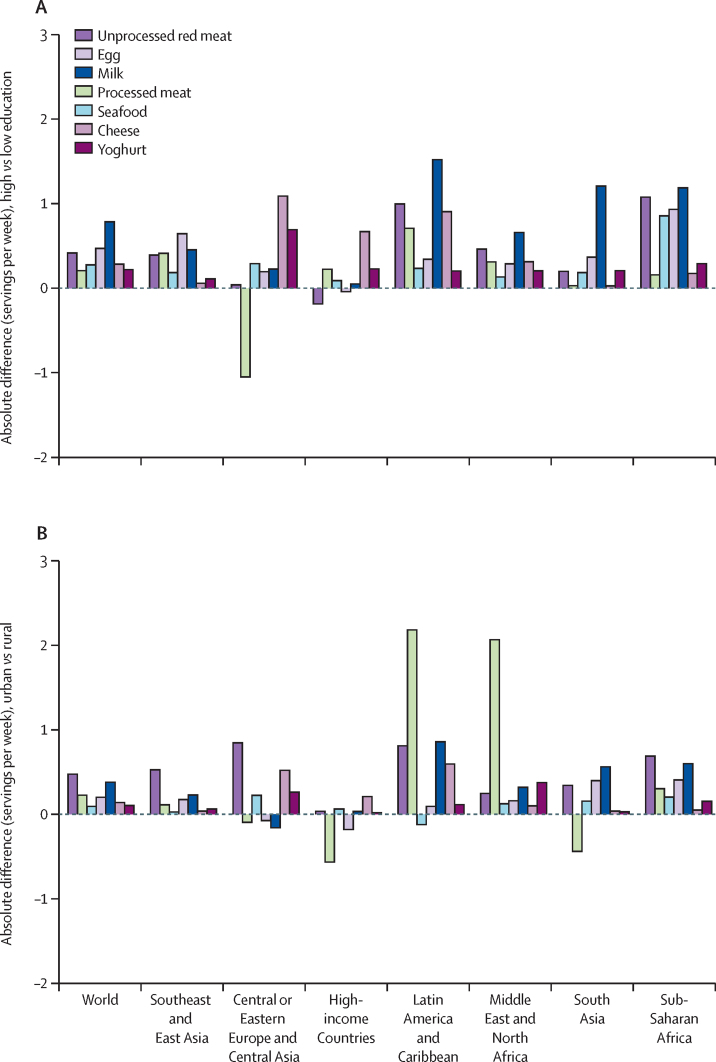
Findings: In 2018, mean global intake per person of unprocessed red meat was 51 g/day (95% uncertainty interval [UI] 48-54; region-specific range 7-114 g/day); 17 countries (23·9% of the world's population) had mean intakes of at least one serving (100 g) per day. Global mean intake of processed meat was 17 g/day (95% UI 15-21 g/day; region-specific range 3-54 g/day); seafood, 28 g/day (27-30 g/day; 12-44 g/day); eggs, 21 g/day (18-24 g/day; 6-35 g/day); milk 88 g/day (84-93 g/day; 45-185 g/day); cheese, 8 g/day (8-10 g/day; 1-34 g/day); and yoghurt, 20 g/day (17-23 g/day; 7-84 g/day). Mean national intakes were at least one serving per day for processed meat (≥50 g/day) in countries representing 6·9% of the global population; for cheese (≥42 g/day) in 2·3%; for eggs (≥55 g/day) in 0·7%; for milk (≥245 g/day) in 0·3%; for seafood (≥100 g/day) in 0·8%; and for yoghurt (≥245 g/day) in less than 0·1%. Among the 25 most populous countries in 2018, total ASF intake was highest in Russia (5·8 servings per day), Germany (3·8 servings per day), and the UK (3·7 servings per day), and lowest in Tanzania (0·9 servings per day) and India (0·7 servings per day). Global and regional intakes of ASF were generally similar by sex. Compared with children, adults generally consumed more unprocessed red meat, seafood and cheese, and less milk; energy-adjusted intakes of other ASF were more similar. Globally, ASF intakes (servings per week) were higher among more-educated versus less-educated adults, with greatest global differences for milk (0·79), eggs (0·47), unprocessed red meat (0·42), cheese (0·28), seafood (0·28), yoghurt (0·22), and processed meat (0·21). This was also true for urban compared to rural areas, with largest global differences (servings per week) for unprocessed red meat (0·47), milk (0·38), and eggs (0·20). Between 1990 and 2018, global intakes (servings per week) increased for unprocessed red meat (1·20), eggs (1·18), milk (0·63), processed meat (0·50), seafood (0·44), and cheese (0·14).
Interpretation: Our estimates of ASF consumption identify populations with both lower and higher than optimal intakes. These estimates can inform the targeting of intervention, surveillance, and policy priorities relevant to both human and planetary health.
Funding: Bill & Melinda Gates Foundation and American Heart Association.
Copyright © 2022 The Author(s). Published by Elsevier Ltd. This is an Open Access article under the CC BY 4.0 license. Published by Elsevier Ltd.. All rights reserved.
Conflict of interest statement
Declaration of interests The investigators did not receive funding from a pharmaceutical company or other agency to write this report. JR, JZ, and PS report research funding from Nestlé, outside the submitted work. JC reports research funding from the Bill & Melinda Gates Foundation, outside the submitted work. RM reports grants from US National Institutes of Health, Nestlé, and Danone, and personal fees from Bunge, Development Initiatives, outside the submitted work. PW reports research grants and contracts from the US Agency for International Development and personal fees from the Global Panel on Agriculture and Food Systems for Nutrition, outside the submitted work. DM reports research funding from the US National Institutes of Health and the Gates Foundation; personal fees from GOED, Bunge, Indigo Agriculture, Motif FoodWorks, Amarin, Acasti Pharma, Cleveland Clinic Foundation, America's Test Kitchen, and Danone; scientific advisory board member for Brightseed, DayTwo, Elysium Health, Filtricine, HumanCo, and Tiny Organics; and chapter royalties from UpToDate, all outside the submitted work. All other authors declare no competing interests. Editorial note: the Lancet Group takes a neutral position with respect to territorial claims in published maps and institutional affiliations.
Figures
References
-
- FAO and WHO Sustainable healthy diets—guiding principles. 2019. http://www.fao.org/3/ca6640en/ca6640en.pdf
-
- Clark MTD, Tilman D. Comparative analysis of environmental impacts of agricultural production systems, agricultural input efficiency, and food choice. Environ Res Lett. 2017;12
-
- Clune S. Systematic review of greenhouse gas emissions for different fresh food categories. J Clean Prod. 2017;140:766–783.
-
- Murphy SP, Allen LH. Nutritional importance of animal source foods. J Nutr. 2003;133:3932S–3935S. - PubMed
Publication types
MeSH terms
LinkOut - more resources
Full Text Sources
