. 2022 Jun:253:119084.
doi: 10.1016/j.neuroimage.2022.119084. Epub 2022 Mar 9.

Using OPM-MEG in contrasting magnetic environments

Affiliations

Using OPM-MEG in contrasting magnetic environments

Ryan M Hill et al. Neuroimage. 2022 Jun.

Abstract

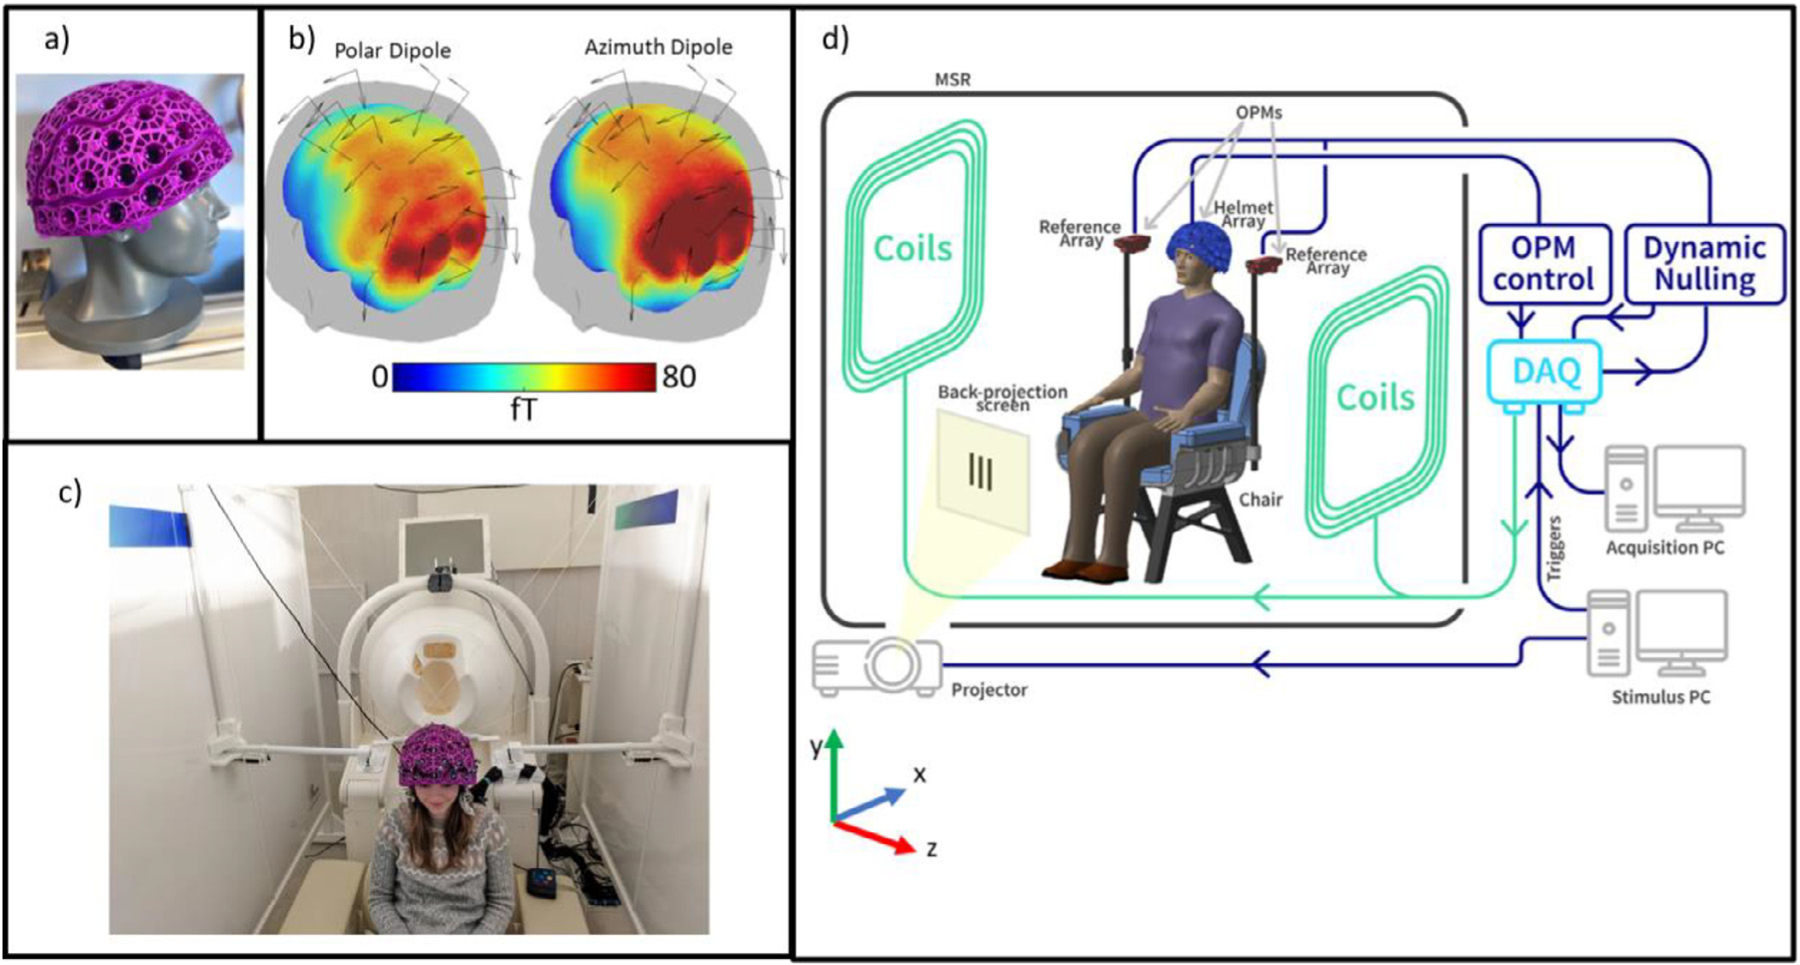
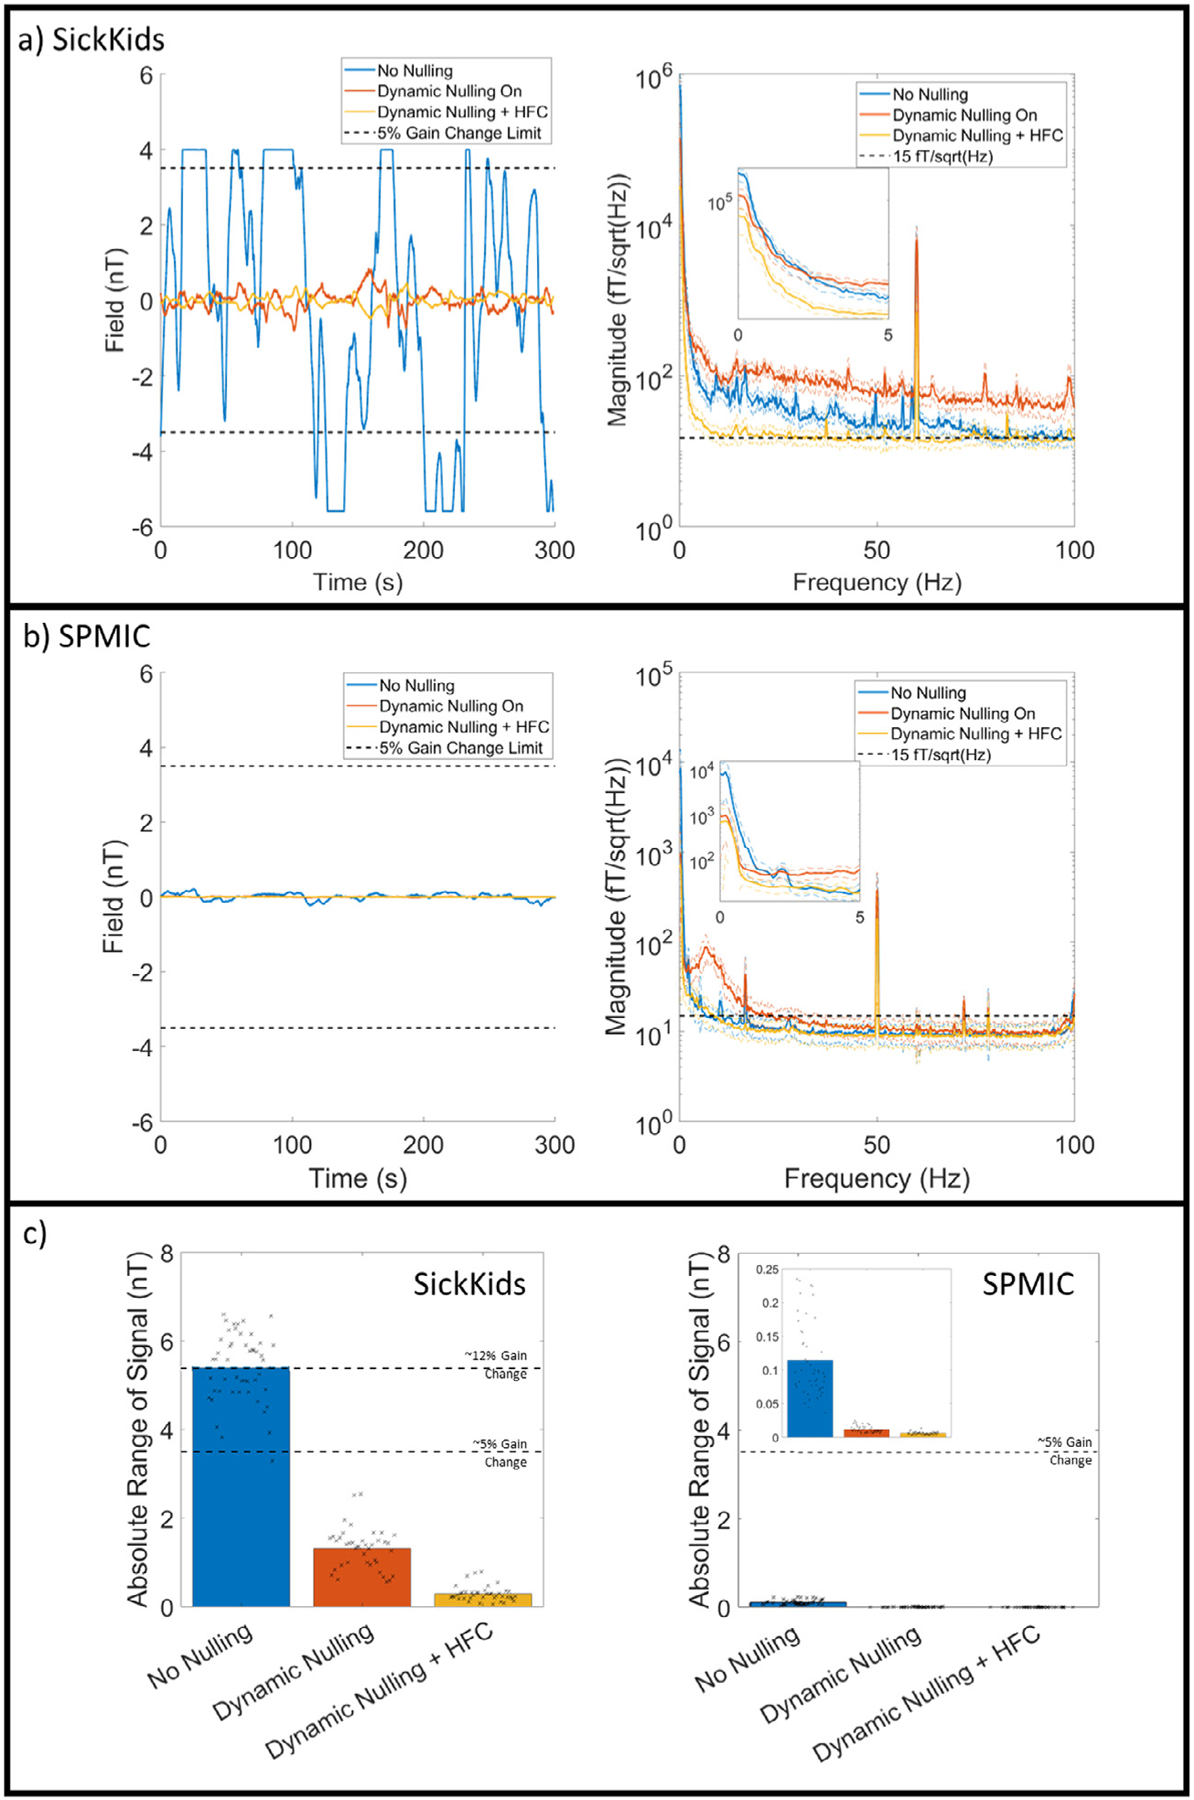
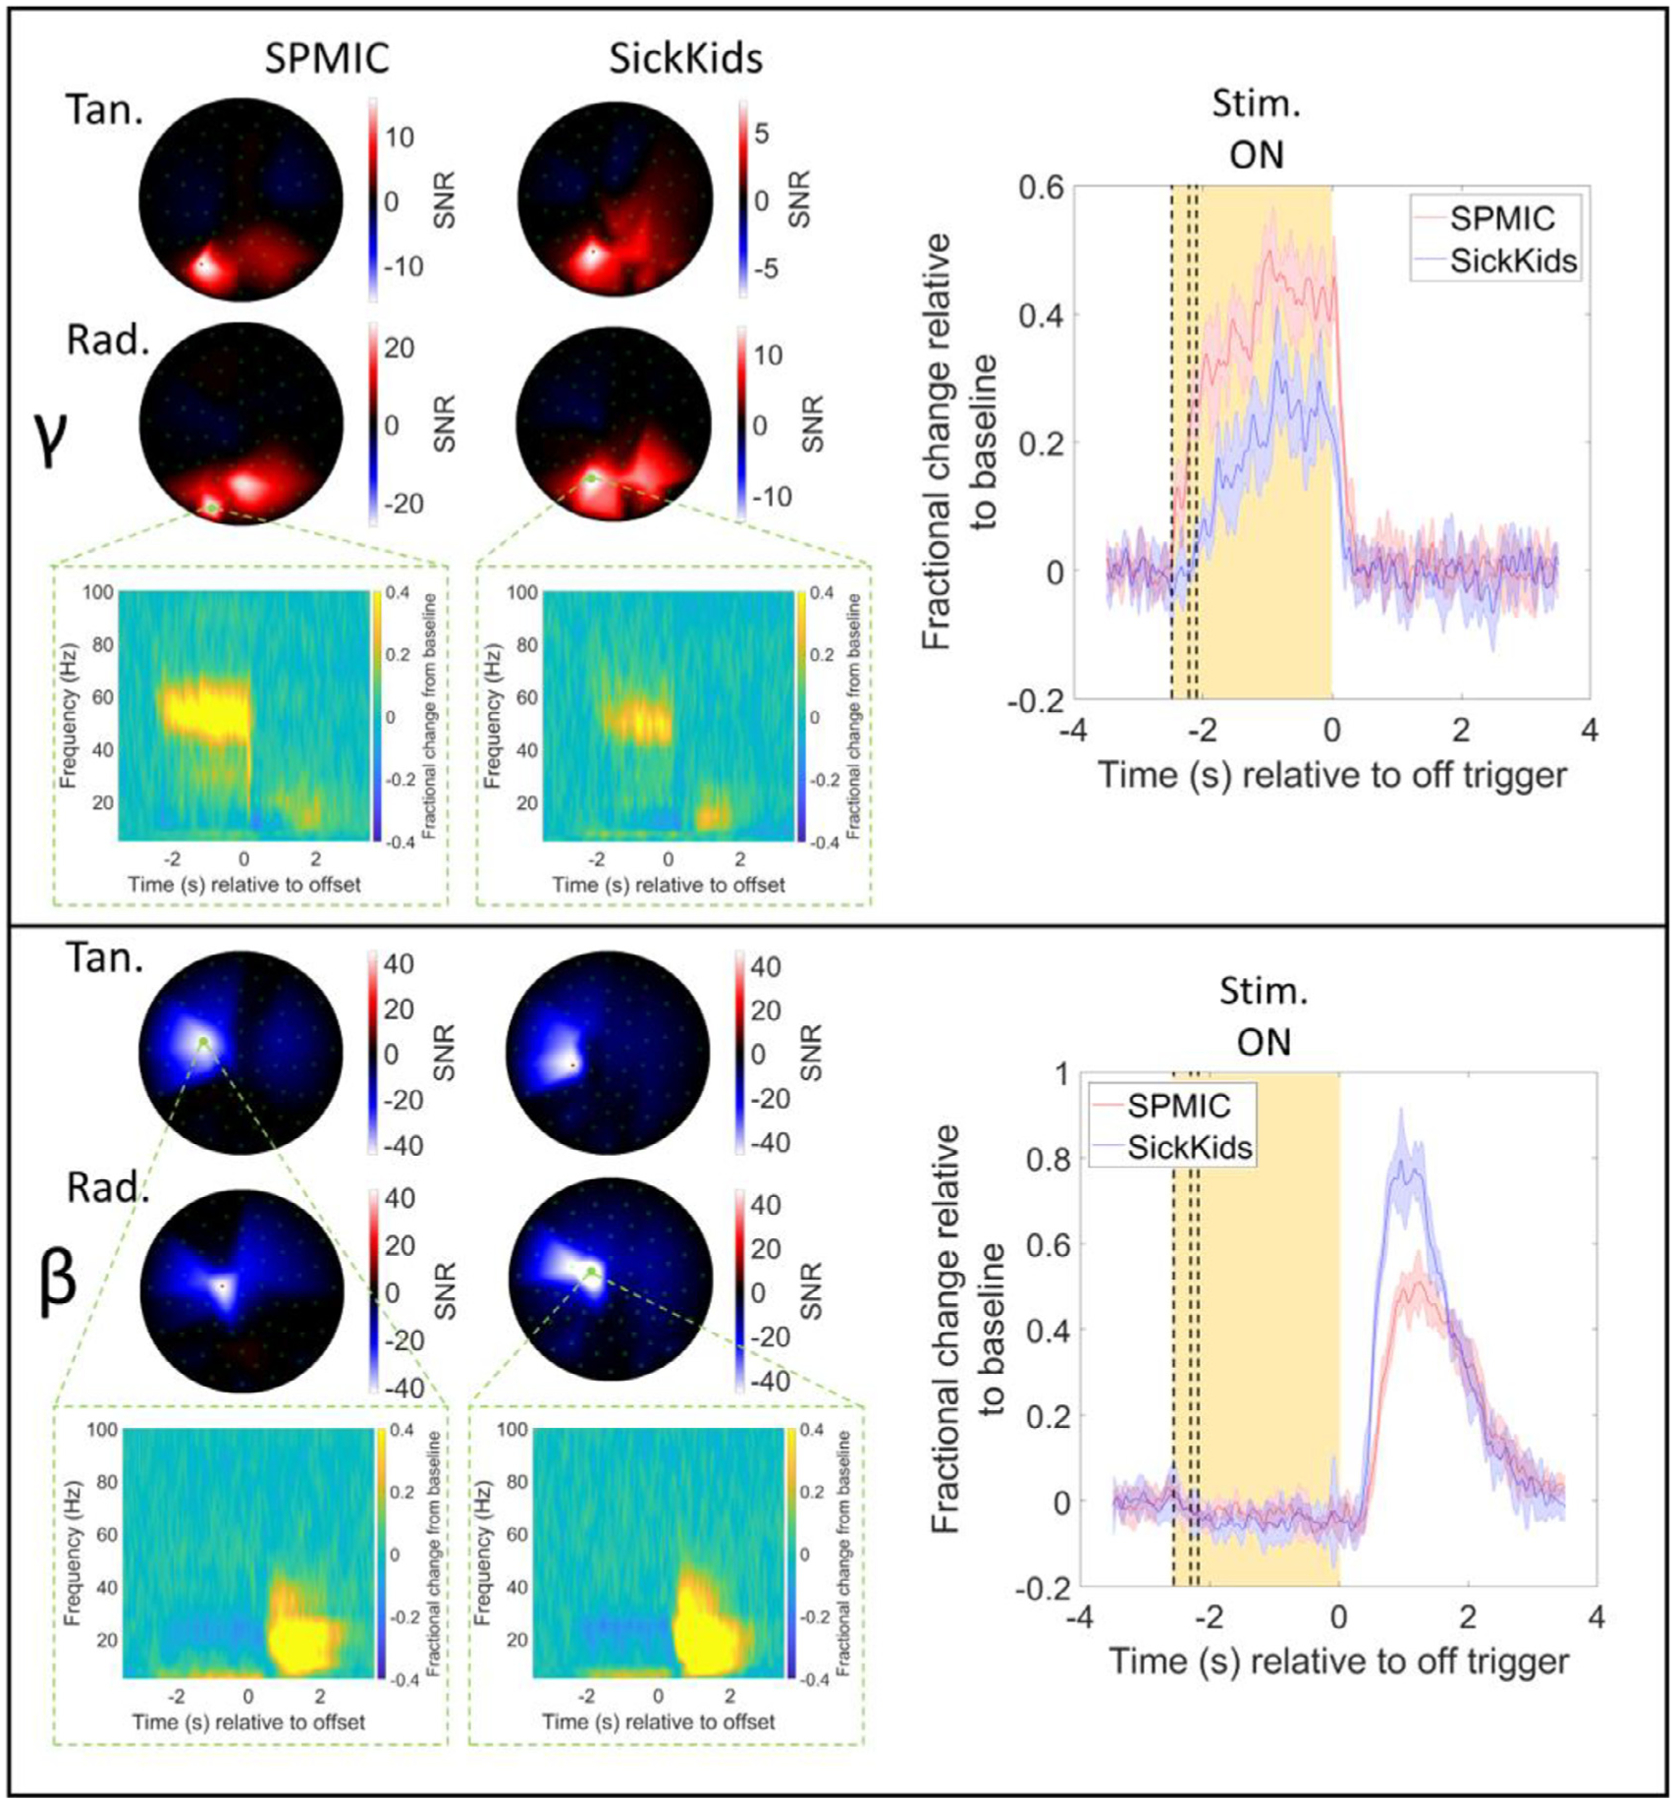
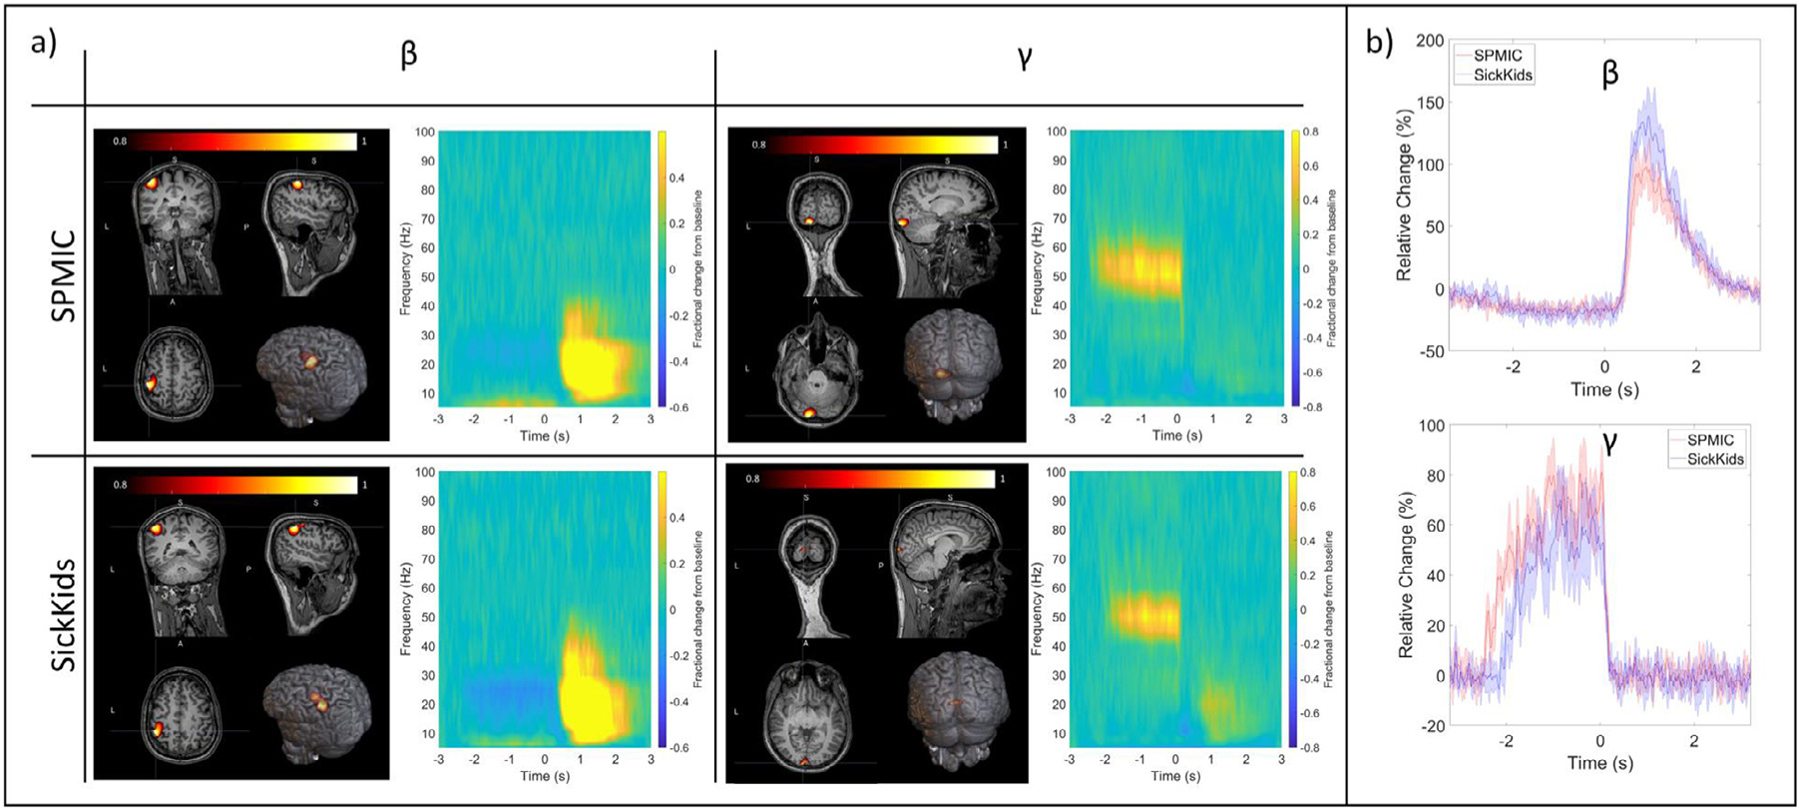
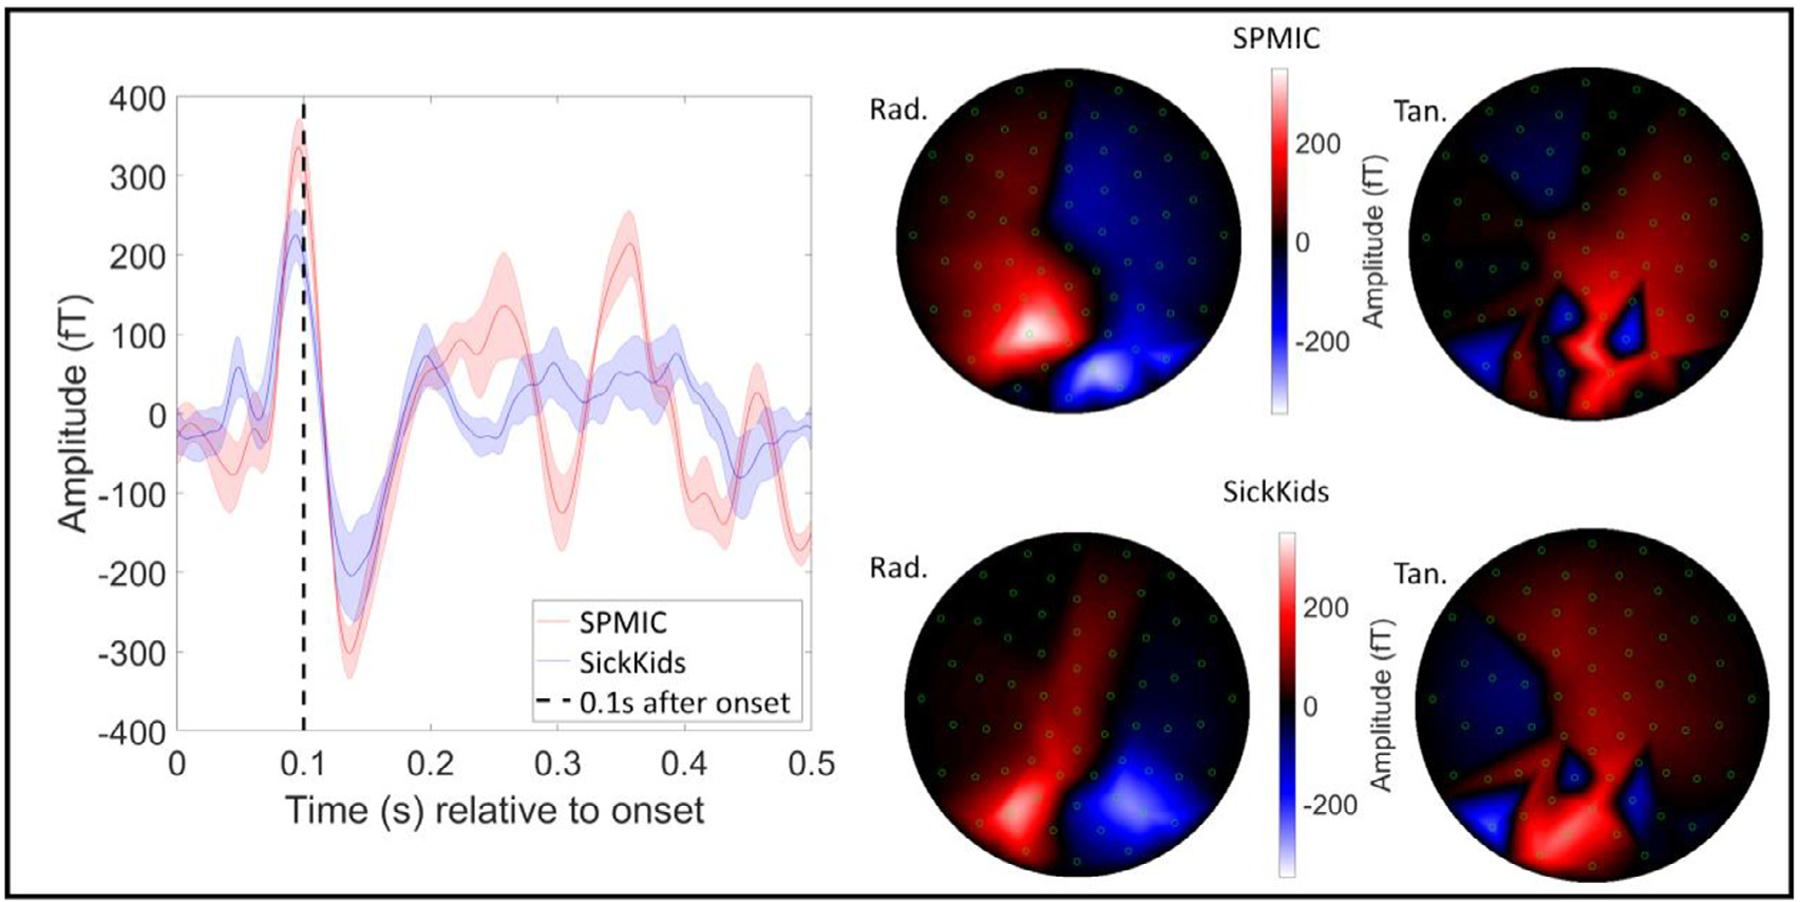
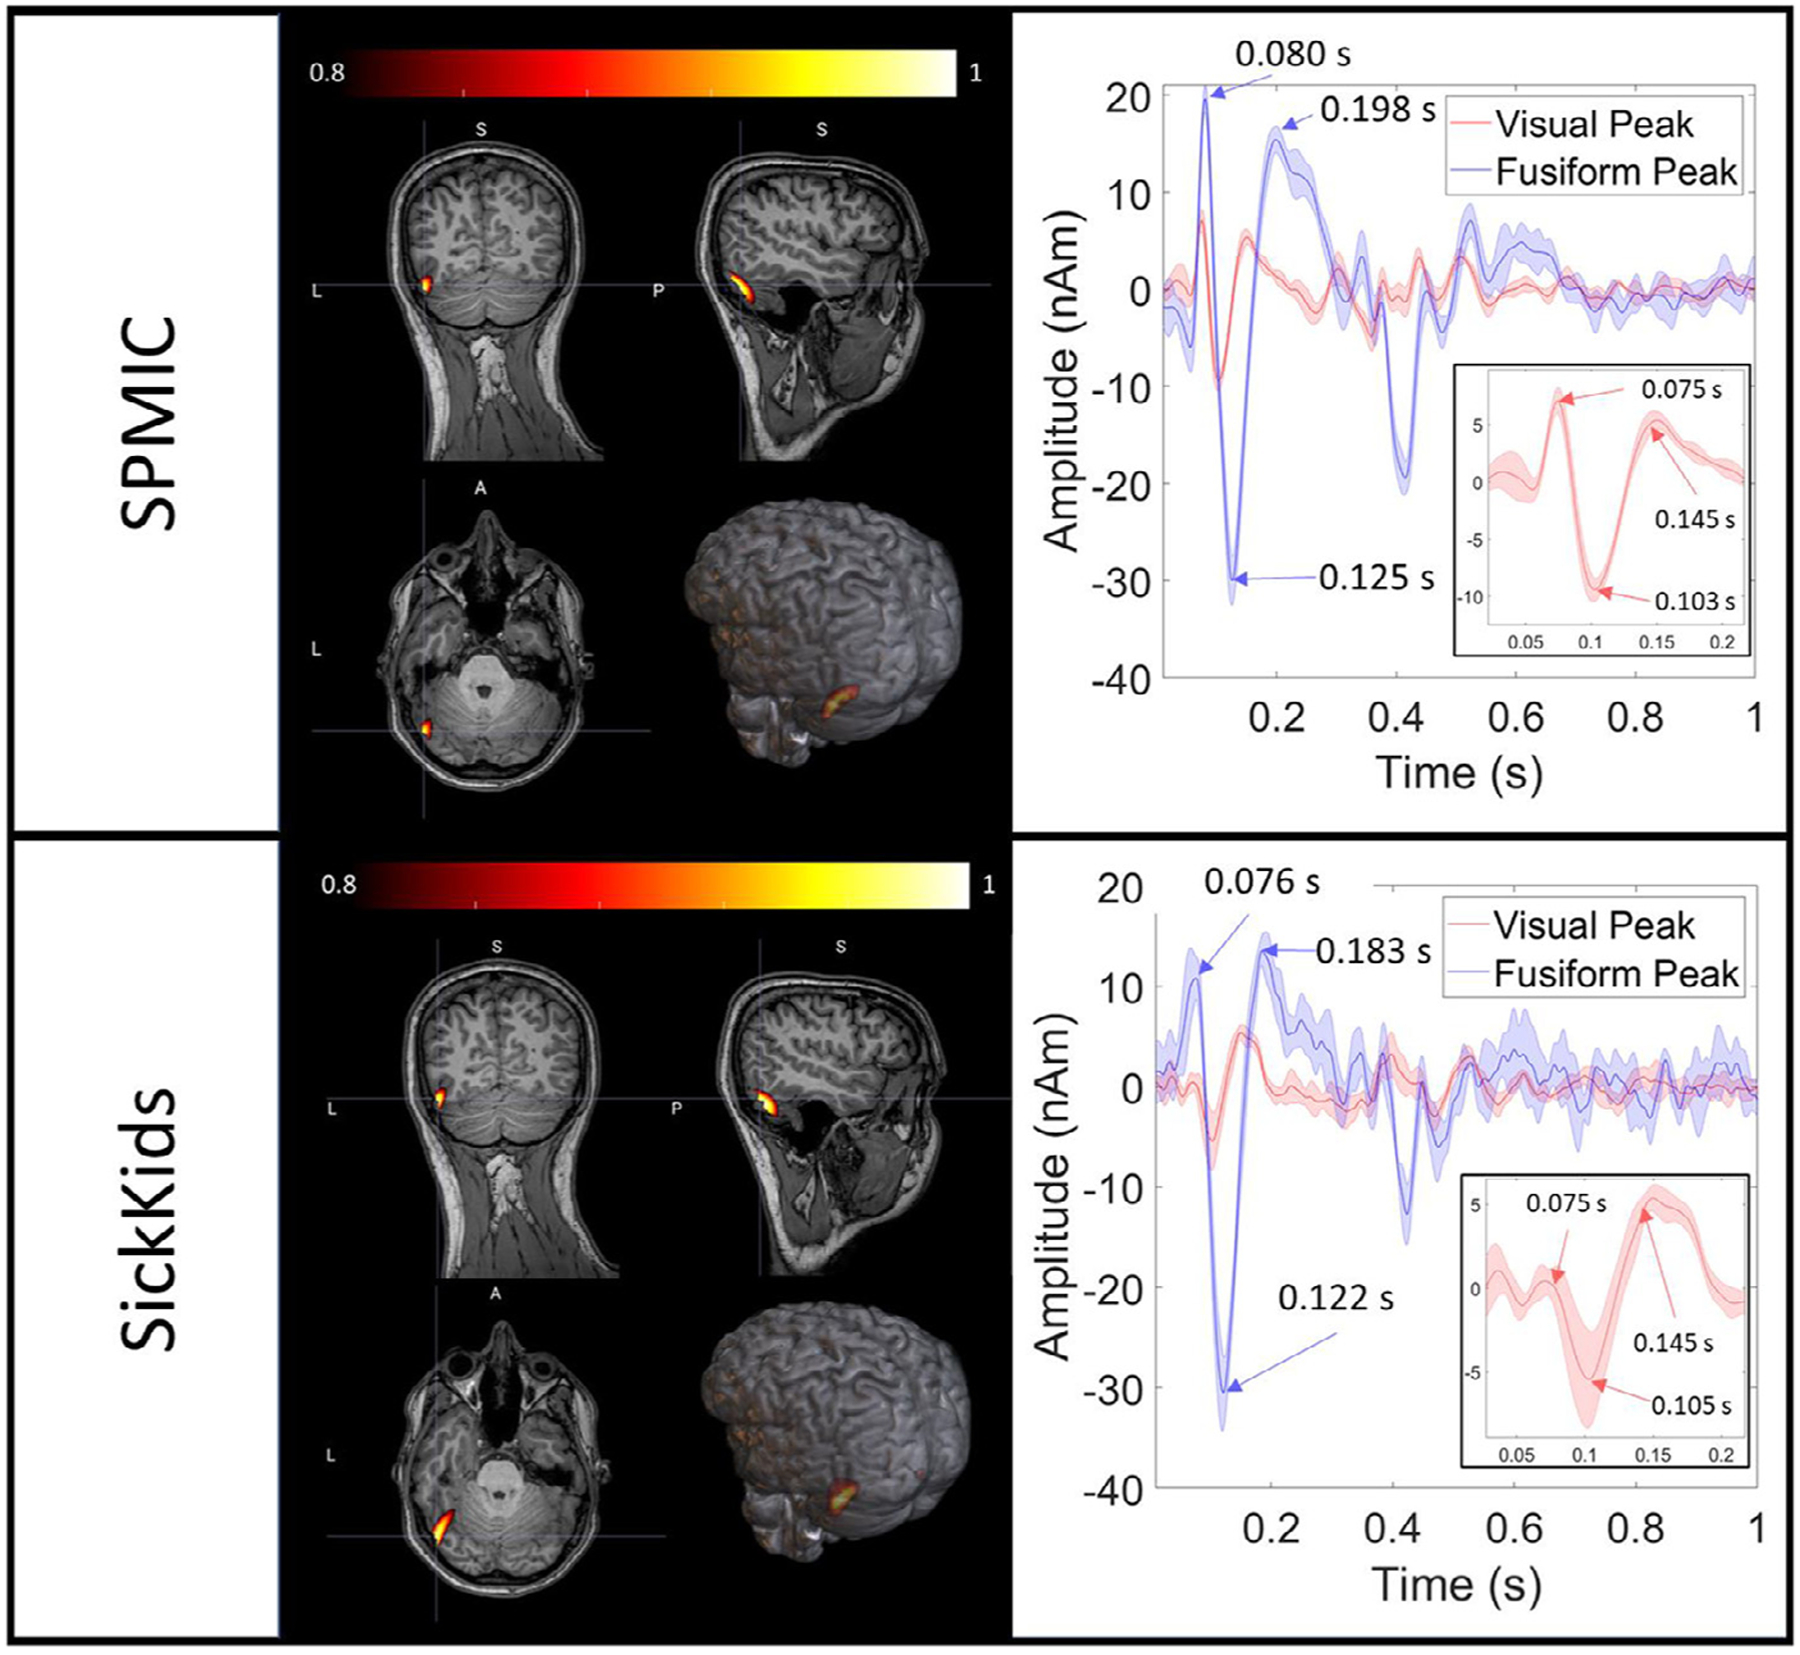
Magnetoencephalography (MEG) has been revolutionised by optically pumped magnetometers (OPMs). "OPM-MEG" offers higher sensitivity, better spatial resolution, and lower cost than conventional instrumentation based on superconducting quantum interference devices (SQUIDs). Moreover, because OPMs are small, lightweight, and portable they offer the possibility of lifespan compliance and (with control of background field) motion robustness, dramatically expanding the range of MEG applications. However, OPM-MEG remains nascent technology; it places stringent requirements on magnetic shielding, and whilst a number of viable systems exist, most are custom made and there have been no cross-site investigations showing the reliability of data. In this paper, we undertake the first cross-site OPM-MEG comparison, using near identical commercial systems scanning the same participant. The two sites are deliberately contrasting, with different magnetic environments: a "green field" campus university site with an OPM-optimised shielded room (low interference) and a city centre hospital site with a "standard" (non-optimised) MSR (higher interference). We show that despite a 20-fold difference in background field, and a 30-fold difference in low frequency interference, using dynamic field control and software-based suppression of interference we can generate comparable noise floors at both sites. In human data recorded during a visuo-motor task and a face processing paradigm, we were able to generate similar data, with source localisation showing that brain regions could be pinpointed with just ∼10 mm spatial discrepancy and temporal correlations of > 80%. Overall, our study demonstrates that, with appropriate field control, OPM-MEG systems can be sited even in city centre hospital locations. The methods presented pave the way for wider deployment of OPM-MEG.


Conflict of interest statement

Conflicts of interest V.S. is the founding director of QuSpin, the commercial entity selling OPM magnetometers. J.O. is an employee of QuSpin. E.B. and M.J.B. are directors of Cerca Magnetics Limited, a spin-out company whose aim is to commercialise aspects of OPM-MEG technology. E.B., M.J.B., R.B., N.H. and R.H. hold founding equity in Cerca Magnetics Limited.

Figures

Fig. 1.
Fig. 1.
System schematics. a) A lightweight generic helmet designed to fit ~95% of adults. b) OPM placement relative to the head. The coloured surface represents sensitivity to a dipole oriented in the polar (left) or azimuth (right) orientation; we ignore radial dipoles due to the relative insensitivity of MEG to dipoles in this orientation. c) Biplanar coils placed either side of the subject. d) schematic diagram of the Cerca Magnetics OPM-MEG system used at the two sites.
Fig. 2.
Fig. 2.
Interference rejection. a) SickKids empty room recording. Raw data for a single representative sensor are shown on the left for the No Nulling Recording (blue), Dynamic Nulling Recording (red), and the Dynamic Nulling Recording with Homogenous Field Correction (HFC) applied (yellow). A dashed line at 3.5 nT represents a gain change in the signal of 5%; if field increases above this line the sensor is non-operational. On the right, the power spectral density (PSD) of each recording is shown, with the inset showing the differences at low (< 5 Hz) frequencies. b) Identical to a) for the SPMIC site. c) Left: the average absolute range (i.e., the largest change from zero) for each recording for the SickKids site. The black dashed lines show the 5% and 12% gain change limits. In both plots, the black crosses show the values for each channel, and the bar the average across all channels. Right: The same plot for the SPMIC site. The inset image shows the same data with the y-axis rescaled.
Fig. 3.
Fig. 3.
Visuo-motor results (sensor-level). Upper panel: Sensor-level results for the gamma-band (35 – 60 Hz). Spatial topography of the signal-to-noise ratios (SNR) for each sensor averaged across all 5 runs is shown for each site (tangential-axis measurements on top, radial-axis on bottom). On the right, the trial-averaged envelope for the sensor with the highest SNR in the beta band is plotted, with shaded error bars showing the standard deviation across all 5 runs. The yellow shaded region shows the active window, with dashed lines showing the jittered durations of 2.1, 2.2, and 2.4 s. Results for each site are overlaid, SPMIC in red and SickKids in blue. Time-frequency spectrograms are also shown for the sensor with the highest SNR. Lower panel: Same as the upper panel but in the beta-band (13 – 30 Hz).
Fig. 4.
Fig. 4.
Visuo-motor results (source-level). a) The left and right columns show beta- and gamma-band results respectively. The upper and lower rows show data from the SPMIC and SickKids sites. In each case, a pseudo-t-statistical image, showing the spatial signature of oscillatory modulation (averaged over all 5 runs) is shown on the left, and a time-frequency spectrum for the locations of peak modulation on the right. b) The trial averaged oscillatory envelopes for the beta- (top) and gamma-band (bottom) with SPMIC shown in red, and SickKids in blue with shaded error bars showing the standard deviation across all 5 runs.
Fig. 5.
Fig. 5.
Face processing results (sensor-level). The trial-averaged response in the best sensor for all 5 runs at each site averaged over runs, with the standard deviation across runs shown by the shaded error bars. The dashed line shows 0.1 s after stimulus onset. The best sensor was determined by the range of the trial-averaged signal for each sensor in the 0.075 s < t < 0.175 s window. The field maps on the right show the field distribution at the peak of the average evoked response at 0.1 s (Z-axis (radial) measurements on the left, Y-axis (tangential) on the right).
Fig. 6.
Fig. 6.
Face processing results (source-level). For each site, the spatial signature of evoked power in the 0.075 s < t < 0.175 s window is shown contrasted against power in the 1.075 s < t < 1.175 s window. On the right, two trial-averaged evoked responses are displayed with the shaded error bars showing the standard deviation across runs. The red line corresponds to a time-course reconstructed in the primary visual area, and the blue line to the left fusiform. Note the differences between regions, but also the similarities across sites. Inset, the primary visual response is magnified.

References

    1. Alem O, Benison AM, Barth DS, Kitching J, Knappe S, 2014. Magnetoencephalography of epilepsy with a microfabricated atomic magnetrode. J. Neurosci 34 (43). doi:10.1523/JNEUROSCI.3495-14.2014. - DOI - PMC - PubMed
    1. Alem O, Mhaskar R, Jiménez-Martínez R, Sheng D, LeBlanc J, Trahms L, Sander T, Kitching J, Knappe S, 2017. Magnetic field imaging with microfabricated optically-pumped magnetometers. Opt. Express 25 (7). doi:10.1364/OE.25.007849. - DOI - PubMed
    1. Allred JC, Lyman RN, Kornack TW, Romalis M.v., 2002. High-sensitivity atomic magnetometer unaffected by spin-exchange relaxation. Phys. Rev. Lett 89 (13). doi:10.1103/PhysRevLett.89.130801. - DOI - PubMed
    1. Altarev I, Fierlinger P, Lins T, Marino MG, Nießen B, Petzoldt G, Reisner M, Stuiber S, Sturm M, Taggart Singh J, Taubenheim B, Rohrer HK, Schläpfer U, 2015. Minimizing magnetic fields for precision experiments. J. Appl. Phys 117 (23). doi:10.1063/1.4922671. - DOI
    1. Baillet S, 2017. Magnetoencephalography for brain electrophysiology and imaging. Nat. Neurosci 20 (3). doi:10.1038/nn.4504. - DOI - PubMed

Publication types