. 2022 May;103(1):115659.
doi: 10.1016/j.diagmicrobio.2022.115659. Epub 2022 Feb 12.

Lower persistence of anti-nucleocapsid compared to anti-spike antibodies up to one year after SARS-CoV-2 infection

Affiliations

Lower persistence of anti-nucleocapsid compared to anti-spike antibodies up to one year after SARS-CoV-2 infection

Jan Van Elslande et al. Diagn Microbiol Infect Dis. 2022 May.

Abstract

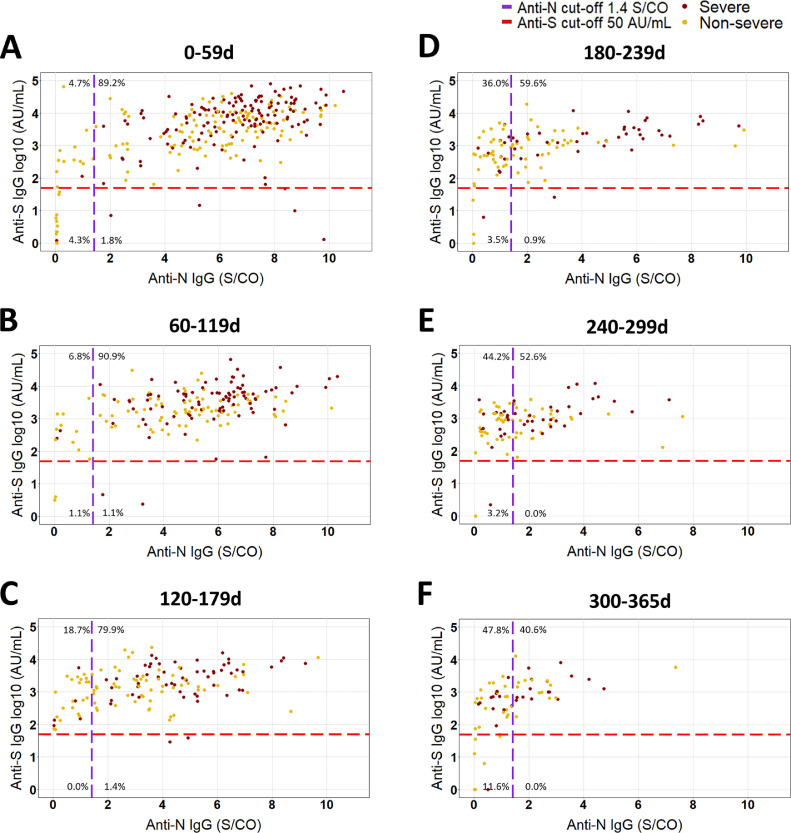
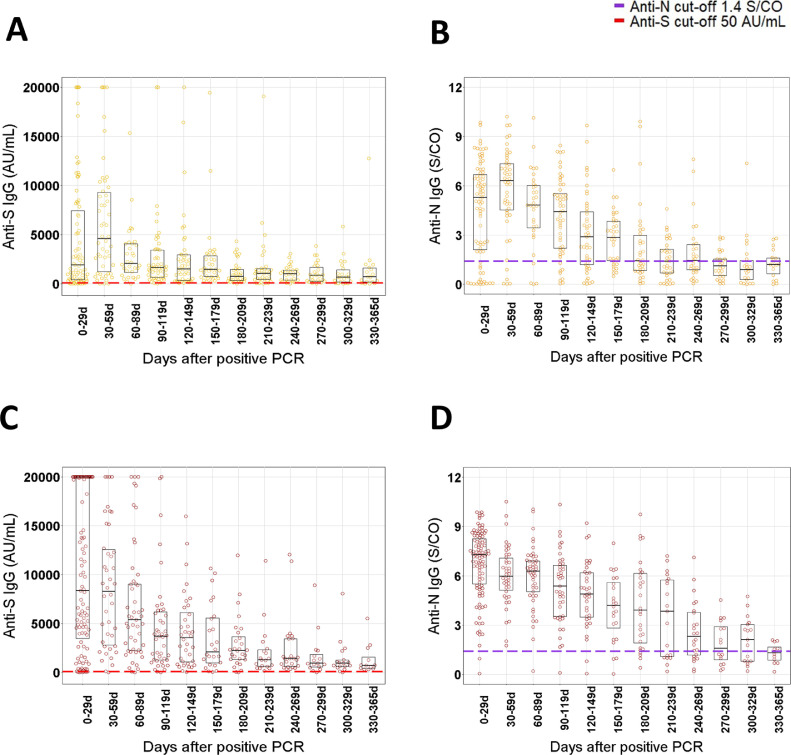
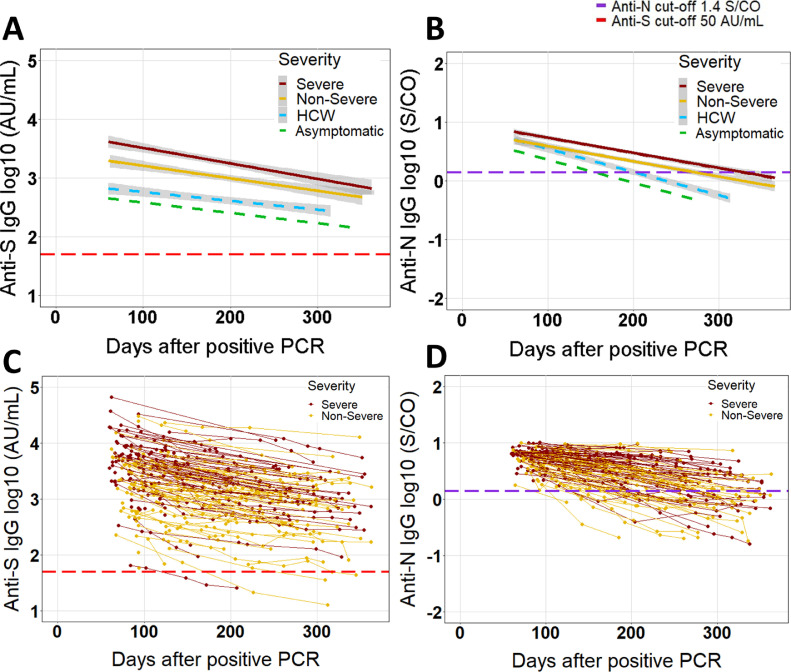
We retrospectively compared the long-term evolution of IgG anti-spike (S) and anti-nucleocapsid (N) levels (Abbott immunoassays) in 116 non-severe and 115 severe SARS-CoV-2 infected patients from 2 university hospitals up to 365 days post positive RT-PCR. IgG anti-S and anti-N antibody levels decayed exponentially up to 365 days after a peak 0 to 59 days after positive RT-PCR. Peak antibody level/cut-off ratio 0 to 59 days after positive RT-PCR was more than 70 for anti-S compared to less than 6 for anti-N (P < 0.01). Anti-S and anti-N were significantly higher in severe compared to non-severe patients up to 180 to 239 days and 300 to 365 days, respectively (P < 0.05). Despite similar half-lives, the estimated time to 50% seronegativity was more than 2 years for anti-S compared to less than 1 year for anti-N in non-severe and severe COVID-19 patients, due to the significantly higher peak antibody level/cut-off ratio for anti-S compared to anti-N.

Keywords: COVID-19; COVID-19 testing; IgG; Immunoassay; Nucleocapsid; SARS-CoV-2; Serological Testing; Spike.


Conflict of interest statement

Declaration of competing interests Dr. Vermeersch reports personal fees from Roche, outside the submitted work. Dr. Lagrou reports personal fees and nonfinancial support from Pfizer, personal fees and nonfinancial support from MSD, personal fees from SMB Laboratoires, personal fees from Gilead, and personal fees from FUJIFILM Wako, outside the submitted work. The other authors state no conflicts of interests.

Figures

Fig 1
Fig. 1
Correlation between anti-S (log10) and anti-N (linear) antibody levels per 60 day time window after positive RT-PCR in non-severe and severe COVID-19 patients. (A) 0 to 59d (n = 278 samples, 231 patients), (B) 60 to 119d (176 samples, 152 patients), (C) 120 to 179d (139 samples, 110 patients), (D) 180 to 239d (114 samples, 83 patients), (D) 240 to 299d (95 samples, 77 patients), (F) 300 to 365d (69 samples, 56 patients). The proportion of samples in each quadrant is depicted as a percentage of total samples per window. All available results of non-severe and severe COVID-19 patients included in this study are shown.
Fig 2
Fig. 2
Beeswarm plots of the IgG anti-S and IgG anti-N results per 30 day time window after positive RT-PCR in non-severe (A−B, yellow) and severe (C−D, red) COVID-19 patients. Boxplots show the P25, median and P75 of antibody levels per 30 day time window. Dashed red and violet lines represent the manufacturer's cut-offs for positivity for anti-S (50 AU/mL) and anti-N (1.4 S/CO). Results for IgG anti-S higher than 20.000 AU/mL are shown as 20.000 AU/mL. Number of patients per 30 day window (severe/non-severe): 0 to 29d: n = 103/83, 30 to 59d: n = 42/50, 60 to 89d: n = 49/32, 90 to 119d: n = 43/52, 120 to 149d: n = 36/45, 150 to 179d: n = 24/34, 180 to 209d: n = 28/34, 210 to 239d: n = 19/33, 240 to 269d: n = 24, 270 to 299d: n = 16/29, 300 to 329d: n = 17/22, 330 to 365d: n = 12/18. d = day.
Fig 3
Fig. 3
Longitudinal evolution of log10 IgG anti-S and anti-N antibody levels (log10) in patients who tested positive at least once ≥60 days after RT-PCR. (A−B) simple linear regression (antibody level ∼ days after positive RT-PCR) with 95% confidence band (grey zone). No confidence band is shown for the asymptomatic patients given the small size. For comparison, the dashed lightblue line with 95% confidence band shows the results of simple linear regression in health care workers (HCW) from a previous study . (C−D) results of individual non-severe and severe COVID-19 patients are shown as dots connected by lines. Dashed red and violet lines represent the manufacturer's cut-offs for positivity for anti-S (50 AU/mL) and anti-N (1.4 S/CO). Analysis performed with 589 samples from 214 patients for anti-S and 538 samples from 188 patients for anti-N.

Similar articles

Cited by

References

    1. Anand SP, Prévost J, Nayrac M, Beaudoin-Bussières G, Benlarbi M, Gasser R, et al. Longitudinal analysis of humoral immunity against SARS-CoV-2 Spike in convalescent individuals up to 8 months post-symptom onset. Cell Reports Med. 2021;2 doi: 10.1016/J.XCRM.2021.100290. - DOI - PMC - PubMed
    1. Sherina N, Piralla A, Du L, Wan H, Kumagai-Braesch M, Andréll J, et al. Persistence of SARS-CoV-2 specific B- and T-cell responses in convalescent COVID-19 patients 6-8 months after the infection. Med. 2021;2:281–295. doi: 10.1016/j.medj.2021.02.001. e4. - DOI - PMC - PubMed
    1. L'Huillier AG, Meyer B, Andrey DO, Arm-Vernez I, Baggio S, Didierlaurent A, et al. Antibody persistence in the first 6 months following SARS-CoV-2 infection among hospital workers: a prospective longitudinal study. Clin Microbiol Infect. 2021 doi: 10.1016/j.cmi.2021.01.005. - DOI - PMC - PubMed
    1. Dan JM, Mateus J, Kato Y, Hastie KM, Faliti CE, Ramirez SI, et al. Immunological memory to SARS-CoV-2 assessed for greater than six months after infection. Science (80-) 2020;371:eabf4063. doi: 10.1101/2020.11.15.383323. - DOI - PMC - PubMed
    1. Gaebler C, Wang Z, Lorenzi JCC, Muecksch F, Finkin S, Tokuyama M, et al. Evolution of antibody immunity to SARS-CoV-2. Nature. 2021;591:639–644. doi: 10.1038/S41586-021-03207-W. - DOI - PMC - PubMed