Incidence and Prevalence of Coronavirus Disease 2019 Within a Healthcare Worker Cohort During the First Year of the Severe Acute Respiratory Syndrome Coronavirus 2 Pandemic
- PMID: 35279023
- PMCID: PMC8992269
- DOI: 10.1093/cid/ciac210
Incidence and Prevalence of Coronavirus Disease 2019 Within a Healthcare Worker Cohort During the First Year of the Severe Acute Respiratory Syndrome Coronavirus 2 Pandemic
Abstract
Background: Preventing severe acute respiratory syndrome coronavirus 2 (SARS-CoV-2_ infections in healthcare workers (HCWs) is critical for healthcare delivery. We aimed to estimate and characterize the prevalence and incidence of coronavirus disease 2019 (COVID-19) in a US HCW cohort and to identify risk factors associated with infection.
Methods: We conducted a longitudinal cohort study of HCWs at 3 Bay Area medical centers using serial surveys and SARS-CoV-2 viral and orthogonal serological testing, including measurement of neutralizing antibodies. We estimated baseline prevalence and cumulative incidence of COVID-19. We performed multivariable Cox proportional hazards models to estimate associations of baseline factors with incident infections and evaluated the impact of time-varying exposures on time to COVID-19 using marginal structural models.
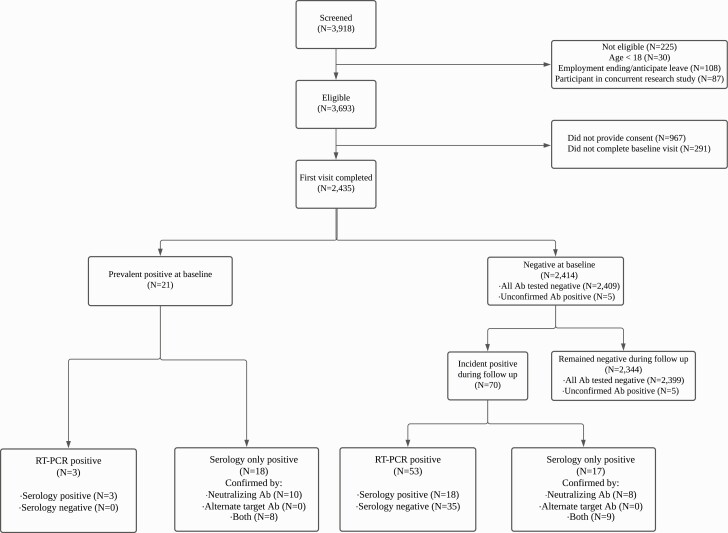
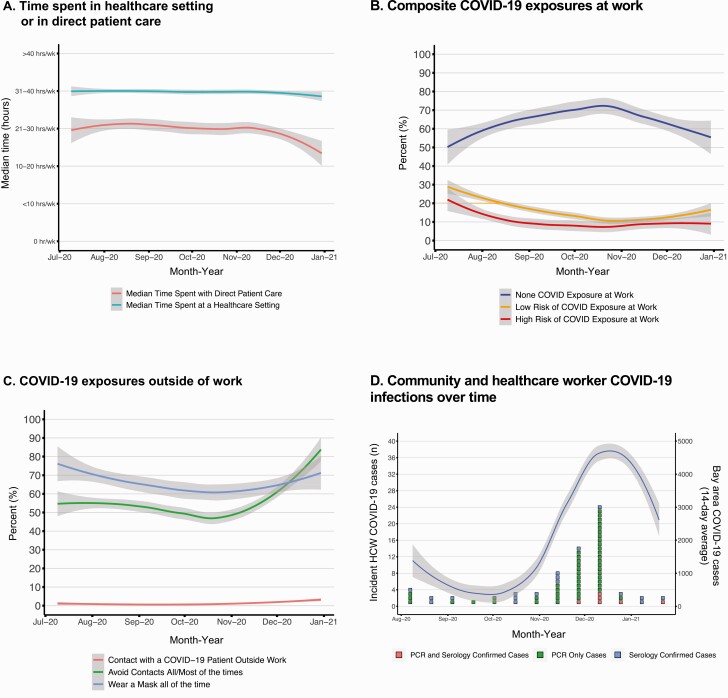
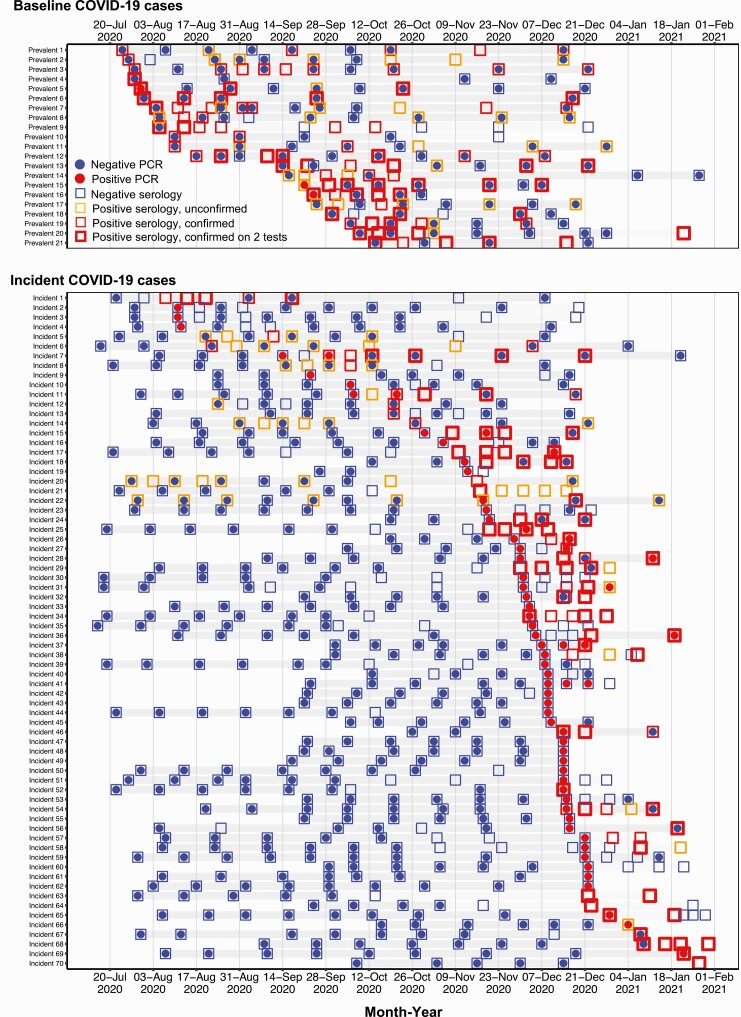
Results: A total of 2435 HCWs contributed 768 person-years of follow-up time. We identified 21 of 2435 individuals with prevalent infection, resulting in a baseline prevalence of 0.86% (95% confidence interval [CI], .53%-1.32%). We identified 70 of 2414 incident infections (2.9%), yielding a cumulative incidence rate of 9.11 cases per 100 person-years (95% CI, 7.11-11.52). Community contact with a known COVID-19 case was most strongly correlated with increased hazard for infection (hazard ratio, 8.1 [95% CI, 3.8-17.5]). High-risk work-related exposures (ie, breach in protective measures) drove an association between work exposure and infection (hazard ratio, 2.5 [95% CI, 1.3-4.8). More cases were identified in HCWs when community case rates were high.
Conclusions: We observed modest COVID-19 incidence despite consistent exposure at work. Community contact was strongly associated with infections, but contact at work was not unless accompanied by high-risk exposure.
Keywords: COVID-19; SARS-CoV-2; healthcare personnel; healthcare worker.
© The Author(s) 2022. Published by Oxford University Press for the Infectious Diseases Society of America.
Conflict of interest statement
Potential conflicts of interest . S. B. D. has received coronavirus disease 2019 (COVID-19) research funding from Gilead and the National Institutes of Health (NIH) and has served as a consultant to and received non–COVID-19 research funding from Genentech, Basilea, and the NIH. G. W. R. has received grant funding from the Centers for Disease Control and Prevention and the California Department of Public Health, has served as a consultant regarding adverse events for Moderna, and has provided expert declarations and depositions for the California Department of Justice. Y. M. has received funding from Pfizer (grants C3671008 and C4591007), the NIH (grants U54 MD010724, U54 MD010724-05S1, R21AI148810, P30AG059307, and 000522211-022), the Bill & Melinda Gates Foundation (grant OPP1113682), and the Chan Zuckerberg Foundation (grant 12089sc); has served as an advisor for and received payment or honoraria from the American Academy of Pediatrics; and has served on a data safety monitoring board for Pfizer. All other authors report no potential conflicts. All authors have submitted the ICMJE Form for Disclosure of Potential Conflicts of Interest. Conflicts that the editors consider relevant to the content of the manuscript have been disclosed.
Figures