. 2022 Mar 12;41(1):95.
doi: 10.1186/s13046-022-02304-6.

Inhibition of the mitochondrial protein Opa1 curtails breast cancer growth

Affiliations

Inhibition of the mitochondrial protein Opa1 curtails breast cancer growth

Margherita Zamberlan et al. J Exp Clin Cancer Res. .

Abstract

Background: Mitochondrial fusion and fission proteins have been nominated as druggable targets in cancer. Whether their inhibition is efficacious in triple negative breast cancer (TNBC) that almost invariably develops chemoresistance is unknown.

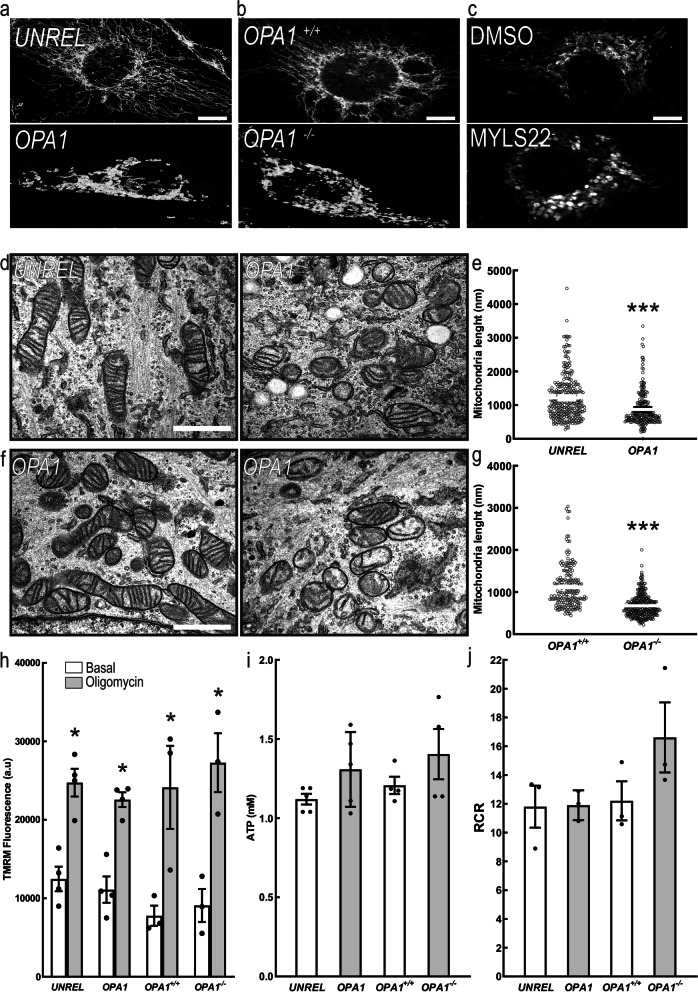
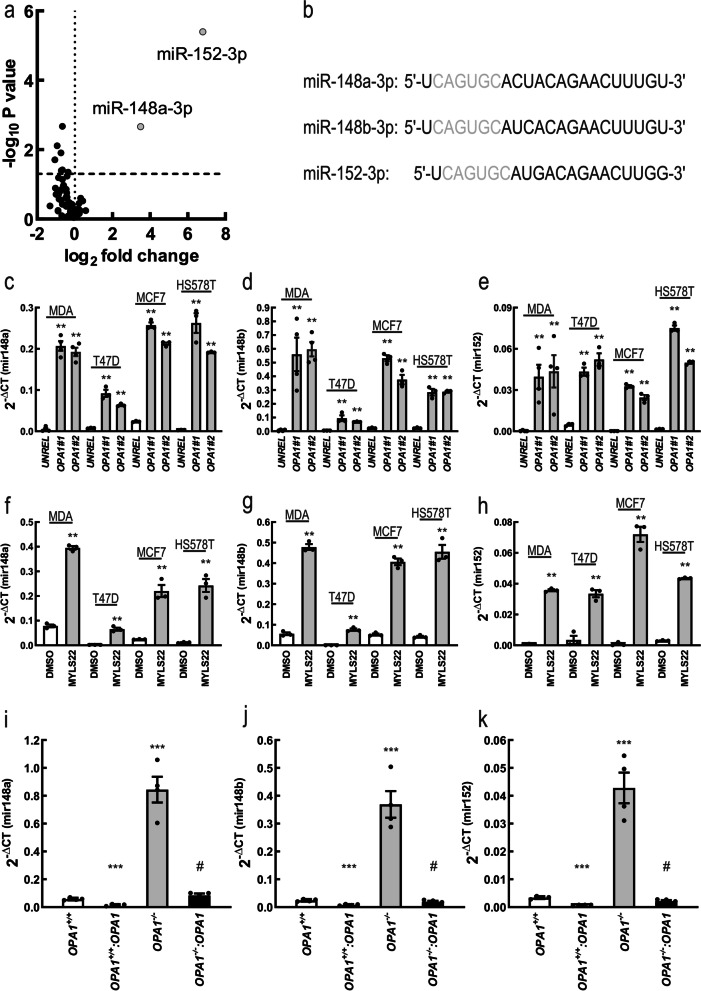
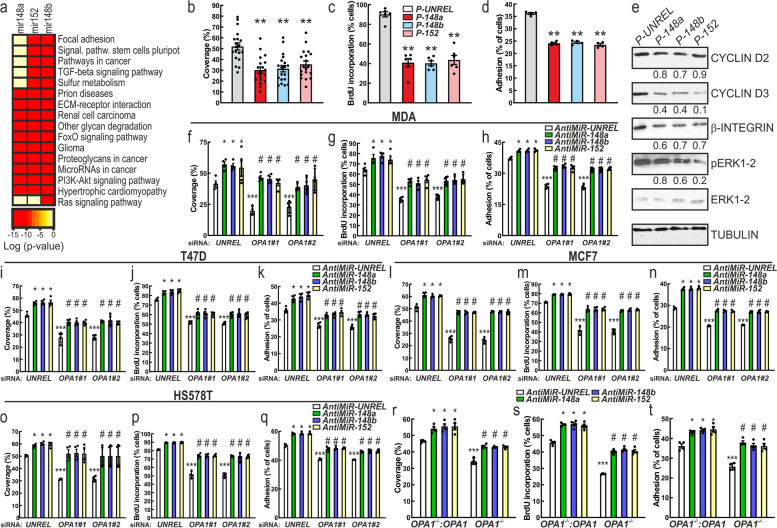
Methods: We used a combination of bioinformatics analyses of cancer genomic databases, genetic and pharmacological Optic Atrophy 1 (OPA1) inhibition, mitochondrial function and morphology measurements, micro-RNA (miRNA) profiling and formal epistatic analyses to address the role of OPA1 in TNBC proliferation, migration, and invasion in vitro and in vivo.

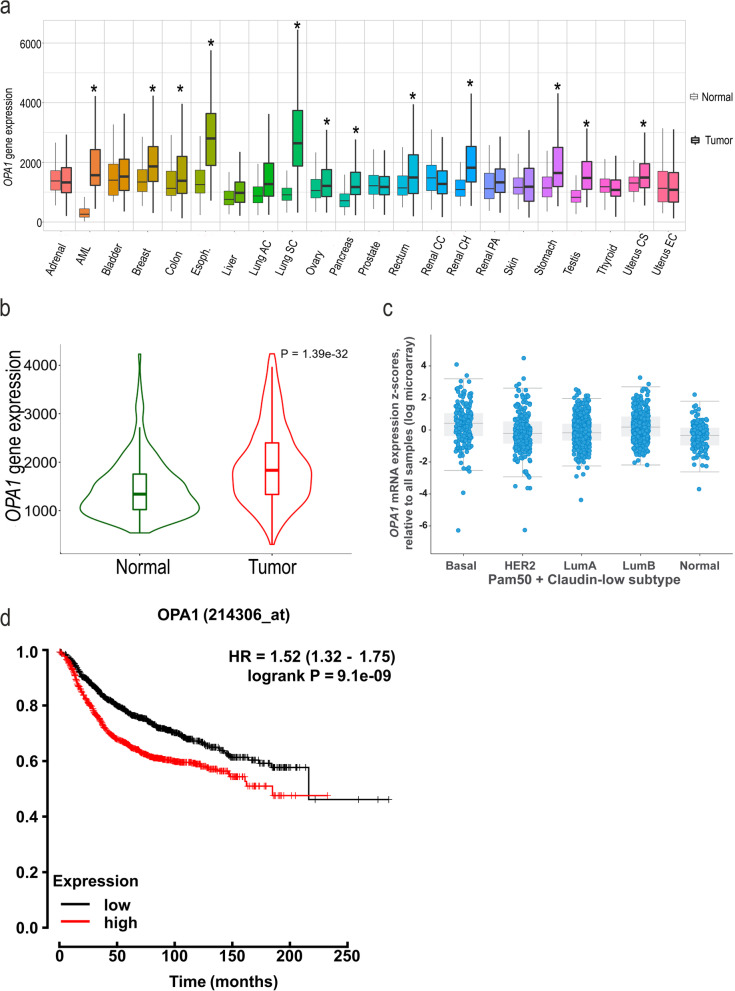
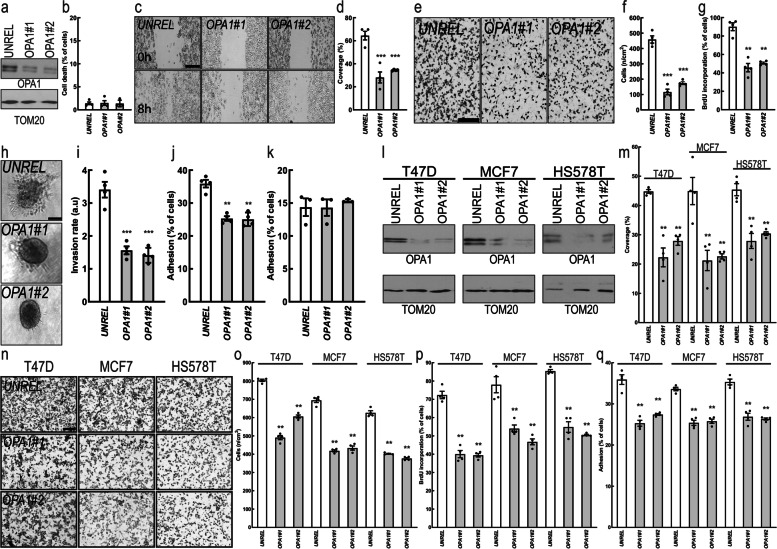
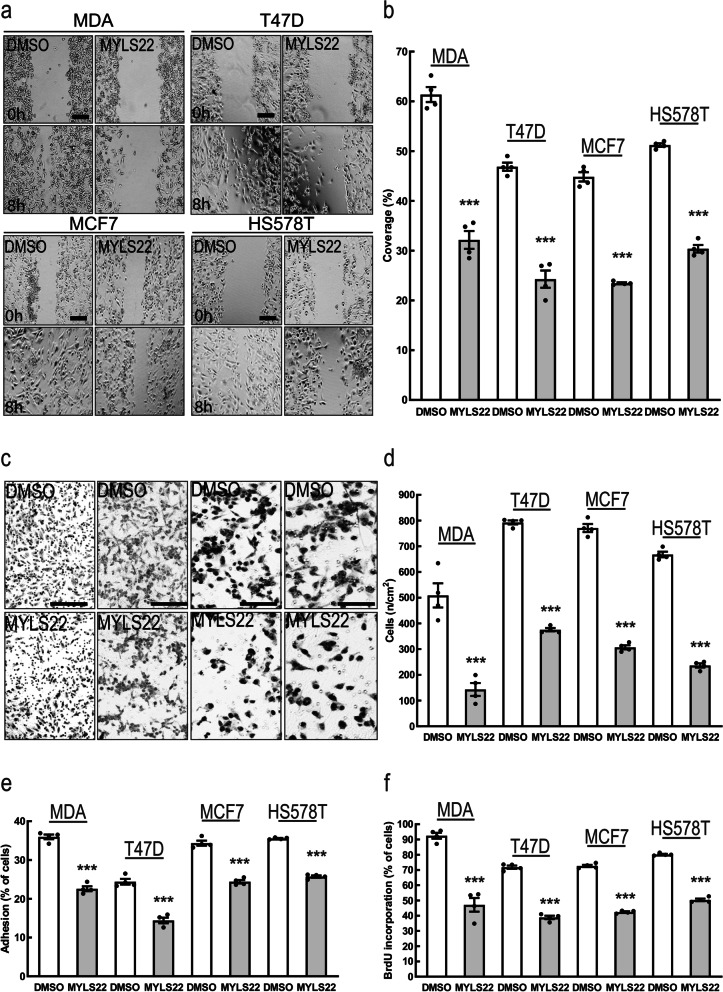
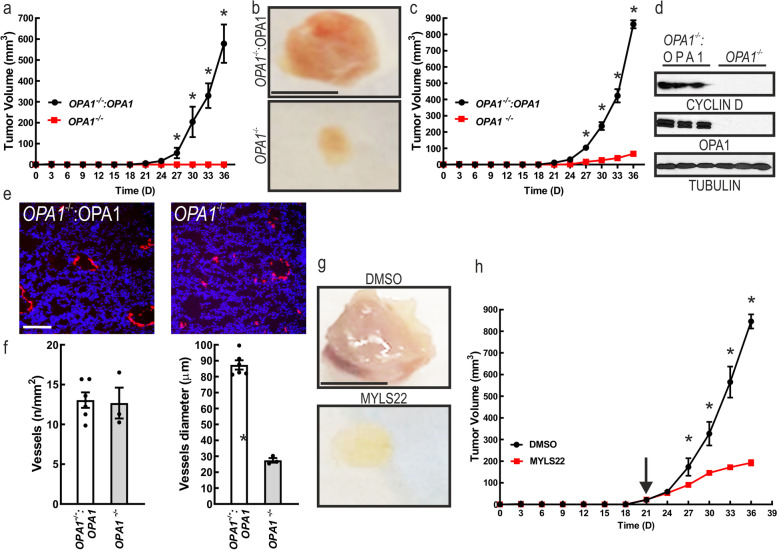
Results: We identified a signature of OPA1 upregulation in breast cancer that correlates with worse prognosis. Accordingly, OPA1 inhibition could reduce breast cancer cells proliferation, migration, and invasion in vitro and in vivo. Mechanistically, while OPA1 silencing did not reduce mitochondrial respiration, it increased levels of miRNAs of the 148/152 family known to inhibit tumor growth and invasiveness. Indeed, these miRNAs were epistatic to OPA1 in the regulation of TNBC cells growth and invasiveness.

Conclusions: Our data show that targeted inhibition of the mitochondrial fusion protein OPA1 curtails TNBC growth and nominate OPA1 as a druggable target in TNBC.


Conflict of interest statement

LS is an inventor in the PCT/EP2019/068846 on MYLS22 as an anticancer drug. All other authors declare no competing interest.

Figures

Fig. 1
Fig. 1
OPA1 is overexpressed in breast cancer tissue. a TNM plot of the OPA1 expression across all tissues in available normal and tumor RNA sequencing data (n = 15,648 normal, 40,442 tumor samples, *P < 0.05). Data are resorted from https://tnmplot.com. b Violin plot of OPA1 expression in breast invasive carcinoma from RNA sequencing data available. Data are resorted from https://tnmplot.com. c OPA1 mRNA expression in breast cancer type from METABRIC data using cbioportal (n = 1904 tumors). Tumors have been classified into five molecular intrinsic subtypes: Basal-like, HER2-enriched, Luminal A, Luminal B and Normal-like using the PAM 50 signature. d Kaplan-Meier survival curve for breast cancer patients stratified according to high (Q4) or low (Q1) OPA1 levels. Data are resorted from Kaplan-Meier Plotter (http://kmplot.com). (Affymetrix id: 214306_at); n = 4934; Status: all. Follow up threshold: all
Fig. 2
Fig. 2
OPA1 is required for breast cancer cells hallmarks in vitro. a MDA-MB-231 cells were transfected with the indicated siRNA and lysed after 72 h. Equal amounts of proteins were separated by SDS-PAGE and immunoblotted with the indicated antibodies. b Quantification of apoptosis rate in MDA-MB-231 transfected with the indicated siRNA for 72 h determined by annexin V/propidium iodide label by flow cytometry. n = 4 independent experiments. c MDA-MB-231 cells were transfected with the indicated siRNA and after 72 h a scratch-wound assay was performed. Representative brightfield images were acquired at the indicated time points. Scale bar: 250 μm. d Quantification of cell migration after 6 h in n = 4 independent experiments as in (b). ***: p < 0.0001. e Representative brightfield images of MDA-MB-231 cells transfected with the indicated siRNA in a Boyden chamber. Scale bar: 250 μm. f Quantification of cell migration in a Boyden chamber after 6 h in experiments as in (d). n = 4 independent experiments. ***: p < 0.0001. g Quantification of MDA-MB-231 proliferation upon transfection with the indicated siRNA determined by BrdU incorporation. n = 4 independent experiments. **: p < 0.001. h Representative brightfield images of MDA-MB-231 spheroïds transfected with the indicated siRNA. Scale bar: 250 μm. i Quantification of cell invasion after 6 h in experiments as in (h). n = 4 independent experiments. ***: p < 0.0001. j Quantification of cell adhesion on fibronectin for 1 h of MDA-MB-231 transfected with the indicated siRNA for 72 h. n = 4 independent experiments. ***: p < 0.001. k Quantification of cell adhesion on gelatin for 1 h of MDA-MB-231 cells transfected with the indicated siRNA for 72 h. n = 3 independent experiments. l Equal amounts of protein from breast cancer T47D, MCF7 and HS578T cells transfected for 72 h with the indicated siRNA were separated by SDS-PAGE and immunoblotted with the indicated antibodies. m Quantification of migration after 6 h in a scratch wound assay of T47D, MCF7 and HS578T cells transfected with the indicated siRNA for 72 h. n = 4 independent experiments. **: p < 0.001. n Representative brightfield images of T47D, MCF7 and HS578T cells transfected for 72 h with the indicated siRNA in a Boyden chamber 6 h after induction of migration. Scale bar: 250 μm. o Quantification of cell migration in experiments as in (n). n = 4 independent experiments. **: p < 0.001. p Quantification of proliferation of T47D, MCF7 and HS578T transfected with the indicated siRNA determined by BrdU incorporation. n = 4 independent experiments. **: p < 0.001. q Quantification of cell adhesion on fibronectin for 1 h of T47D, MCF7 and HS578T cells transfected with the indicated siRNA for 72 h. n = 4 independent experiments. **: p < 0.001
Fig. 3
Fig. 3
Pharmacological OPA1 Inhibition reduces breast cancer hallmarks in vitro. a Representative brightfield images acquired at the indicated time points of MDA-MB-231, T47D, MCF7 and HS578T cells incubated with MYLS22 (50 μM) or DMSO for 6 h in a scratch-wound assay. Scale bar: 250 μm. b Quantification of cell migration of MDA-MB-231, T47D, MCF7 and HS578T incubated with MYLS22 (50 μM) or DMSO, after 6 h in experiments as in (a). n = 4 independent experiments. ***: p < 0.0001. c Representative brightfield images of MDA-MB-231,T47D, MCF7 and HS578T incubated with MYLS22 (50 μM) or DMSO for 6 h in a Boyden chamber. Scale bar: 200 μm. d Quantification of cell migration of MDA-MB-231,T47D, MCF7 and HS578T, incubated with MYLS22 (50 μM), after 6 h in experiments as in (w). n = 4 independent experiments. ***: p < 0.0001. e Quantification of MYLS22- (50 μM) or DMSO-preincubated MDA-MB-231,T47D, MCF7 and HS578T adhesion on fibronectin for 1 h in presence of MYLS22 (50 μM) or DMSO. n = 4 independent experiments. ***: p < 0.0001. f) Quantification of MDA-MB-231,T47D, MCF7 and HS578Tproliferation incubated with MYLS22 (50 μM) for 24 h and determined by BrdU incorporation. n = 4 independent experiments. ***: p < 0.0001
Fig. 4
Fig. 4
Genetic or pharmacological OPA1 inhibition curtails tumor growth. a Growth curves of orthotopically implanted 5 × 104 MDA-MB-231 cells of the indicated genotype at day 0 in 6-week-old mice of the indicated genotype. n = 6. *: p < 0.05. b Representative photographs of breast adenocarcinoma removed after 35 days from orthotopically implants of 5 × 104 MDA-MB-231 cells mixed with 50 μl of matrigel in 6-week-old mice of the indicated genotype. Scale bar: 0.5 cm. c Growth curves of orthotopically implanted 5 × 104 MDA-MB-231 mixed with 50ul of Matrigel cells with the indicated genotype at day 0 in 6-week-old mice of the indicated genotype. n = 8 Opa1wt and 8 Opa1Crispr mice. *: p < 0.05. d Equal amounts of proteins from breast adenocarcinoma harvested from mice 35 days after implantation with the indicated genotype were separated by SDS-PAGE and immunoblotted with the indicated antibodies. e Representative CD31 immunofluorescence (red) showing blood vessels in MDA-MB-231 in experiments as in A. Scale bar: 100 μm. f Quantification of the number of tumor blood vessels in experiments as in (d). g Quantification of tumor blood vessels diameter in experiments as in (d). *:P < 0.05. h Representative photographs of breast adenocarcinomas removed after 35 days from orthotopically implants of 5 × 104 MDA-MB-231 cells mixed with 50 μl Matrigel in 6-week-old mice treated as indicated. Scale bar: 0.5 cm. i Growth curves of orthotopically implanted 5 × 104 MDA-MB-231 cells in 6-week-old mice treated as indicated. The arrow indicates the beginning of the treatment. n = 6. *: p < 0.05
Fig. 5
Fig. 5
OPA1 ablation does not affect mitochondrial metabolism of breast cancer cells in vitro. Representative confocal images of mitochondrial morphology in MDA-MB-231 transfected with the indicated siRNA for 72 h and stained for TOM20. Scale bar: 30 μm. a Representative confocal images of mitochondrial morphology in MDA-MB-231 with the indicated genotype and stained for TOM20. Scale bar: 30 μm. b Representative confocal images of mitochondrial morphology in MDA-MB-231 treated 24 h with MYLS22 (50 μM) or DMSO and stained for TOM20. Scale bar: 30 μm. c Representative EM images of MDA-MB-231 transfected for 72 h with the indicated siRNA. Scale bar: 500 nm. d Quantification of mitochondrial length in experiments as in (d). n = 240 mitochondria/condition from 3 independent experiments. *** p < 0.001. e Representative EM images of MDA-MB-231 with the indicated genotype. Scale bar: 500 nm. f Quantification of mitochondrial length in experiments as in (f). n = 200 mitochondria/condition from 3 independent experiments. *** p < 0.001. g Quantitative analysis of mitochondrial TMRM fluorescence in MDA-MB-231 transfected with the indicated siRNA for 72 h; MDA-MB-231 OPA1+/+ and MDA-MB-231 OPA1−/−. Where indicated, cells were treated with the TMRM (0.5 nM), the ATP synthase inhibitor oligomycin (2 μg/mL) and the uncoupler FCCP (2 μM). Data represents mean ± SEM, n = 4. *: p < 0.05. h Total ATP levels were measured in MDA-MB-231 transfected with the indicated siRNA for 72 h; MDA-MB-231 OPA1+/+ and MDA-MB-231 OPA1−/−. n = 5 independent experiments. i Quantification of respiratory control ratio (RCR) calculated as State 3/ State 4 of MDA-MB-231 transfected with the indicated siRNA for 72 h; MDA-MB-231 OPA1+/+ and MDA-MB-231 OPA1−/−
Fig. 6
Fig. 6
OPA1 ablation increases miR-148a, miR-148b and miR-152 expression level. a Volcano plot of differentially expressed miRNAs in MDA-MB-231 transfected for 72 h with siRNA against OPA1 or a non-relevant sequence (UNREL). Blue dots correspond to miRNAs significantly up-regulated in Opa1-ablated MDA-MB-231. n = 4 independent experiments. b miR-148/152 family. Mature human and mouse sequences for miR-148a, miR-148b and miR-152. Seed sequences are colored in red. c 2-Δct of mir148a levels determined by qRT-PCR in MDA-MB-231, T47D, MCF7, HS578T transfected as indicated for 72 h. n = 4 independent experiments. **: p < 0.001. d 2-Δct of mir148b levels determined by qRT-PCR in MDA-MB-231, T47D, MCF7, HS578T transfected as indicated for 72 h. n = 4 independent experiments. **: p < 0.001. e 2-Δct of mir152 levels determined by qRT-PCR in MDA-MB-231, T47D, MCF7, HS578T transfected as indicated for 72 h. n = 4 independent experiments. **: p < 0.001. f 2-Δct of mir148a levels determined by qRT-PCR in MDA-MB-231, T47D, MCF7, HS578T treated as indicated for 8 h. n = 4 independent experiments. **: p < 0.001. g 2-Δct of mir148b levels determined by qRT-PCR in MDA-MB-231, T47D, MCF7, HS578T treated as indicated for 8 h. n = 4 independent experiments. **: p < 0.001. h 2-Δct of mir152 levels determined by qRT-PCR in MDA-MB-231, T47D, MCF7, HS578T treated as indicated for 8 h. n = 4 independent experiments. **: p < 0.001. i 2-Δct of mir148a levels determined by qRT-PCR in MDA-MB-231 with the indicated genotype. n = 4 independent experiments. ***: p < 0.0001 #: p < 0.0001. j 2-Δct of mir148b levels determined by qRT-PCR in MDA-MB-231 with the indicated genotype. n = 4 independent experiments. ***: p < 0.0001 #: p < 0.0001. k 2-Δct of mir152 levels determined by qRT-PCR in MDA-MB-231 with the indicated genotype. n = 4 independent experiments. ***: p < 0.0001 #: p < 0.0001
Fig. 7
Fig. 7
OPA1 ablation inhibits breast cancer cells hallmarks by increasing miRNA 148a, 148b and 152 expression. a Heat map of the major pathways dysregulated by the change of the miRNA-148a, 148b and 152. Data are resorted from http://snf-515788.vm.okeanos.grnet.gr/#mirnas=hsa-miR-148a-3p;hsa-miR-148b-3p;hsa-miR-152-3p&methods=microT-CDS;microT-CDS;microT-CDS&selection=2. b Quantification of cell migration after 6 h of MDA-MB-231 transfected as indicated for 24 h. n = 19 independent experiments. **: p < 0.001. P-: miRNA mimic. c Quantification of proliferation of MDA-MB-231 transfected as indicated for 24 h determined by BrdU incorporation. n = 4 independent experiments. **: p < 0.001. P-: miRNA mimic. d Quantification of cell adhesion on fibronectin of MDA-MB-231 transfected as indicated for 24 h. n = 4 independent experiments. **: p < 0.001. P-: miRNA mimic. e Equal amounts of protein from breast cancer cells MDA-MB-231 transfected 24 h as indicated were separated by SDS-PAGE and immunoblotted with the indicated antibodies. Numbers above each panel represent densitometric quantification. P-: miRNA mimic. f-h Quantification of cell migration (f), proliferation (g) and adhesion (i) of MDA-MB-231 (transfected with the indicated siRNA for 72 h and indicated anti-miRNA for 24 h. n = 4 independent experiments. *: p < 0.05, ***: p < 0.0001 and #: p < 0.05. A-: Anti miRNA. i-k Quantification of migration (i), proliferation (j) and adhesion (k) of T47D transfected with the indicated siRNA for 72 h and indicated anti-miRNA for 24 h and determined by BrdU incorporation. n = 4 independent experiments. *: p < 0.05, ***: p < 0.0001 and #: p < 0.05. A-: Anti miRNA. l-n Quantification of cell migration (l), proliferation (m) and adhesion (n) of MCF7 transfected with the indicated siRNA for 72 h and indicated anti-miRNA for 24 h. n = 4 independent experiments. *: p < 0.05, ***: p < 0.0001 and #: p < 0.05. A-: Anti miRNA. o-q Quantification of cell migration (o), proliferation (p) and adhesion (q) of HS578T transfected with the indicated siRNA for 72h and indicated anti-miRNA for 24h. n=4 independent experiments. *: p < 0.05, ***: p < 0.0001 and #: p < 0.05. A-: Anti miRNA.  r Quantification of cell migration after 6 h of MDA-MB-231 with the indicated genotype and transfected as indicated for 24 h. n = 4 independent experiments. *: p < 0.05, ***: p < 0.0001 and #: p < 0.05. A-: Anti miRNA. s Quantification of proliferation of MDA-MB-231 with the indicated genotype and transfected as indicated for 24 h and determined by BrdU incorporation n = 4 independent experiments. *: p < 0.05, ***: p < 0.0001 and #: p < 0.05. A-: Anti miRNA. t Quantification of cell adhesion on fibronectin of MDA-MB-231 with the indicated genotype and transfected as indicated for 24 h. n = 4 independent experiments. *: p < 0.05, ***: p < 0.0001 and #: p < 0.05. A-: Anti miRNA

References

    1. Vagia E, Mahalingam D, Cristofanilli M. The Landscape of Targeted Therapies in TNBC. Cancers. 2020;12:916. - PMC - PubMed
    1. Yedjou CG, Sims J, Miele L. Health and racial disparity in breast cancer. 10.1007/978-3-030-20301-6_3. - PMC - PubMed
    1. Lehmann BD, et al. Identification of human triple-negative breast cancer subtypes and preclinical models for selection of targeted therapies. J Clin Invest. 2011;121:2750–2767. - PMC - PubMed
    1. Burstein MD, et al. Comprehensive genomic analysis identifies novel subtypes and targets of triple-negative breast cancer. Clin Cancer Res. 2015;21:1688–1698. - PMC - PubMed
    1. Liu YR, et al. Comprehensive transcriptome analysis identifies novel molecular subtypes and subtype-specific RNAs of triple-negative breast cancer. Breast Cancer Res. 2016;18(1):338. - PMC - PubMed