. 2022 Aug;44(4):2105-2128.
doi: 10.1007/s11357-022-00529-z. Epub 2022 Mar 12.

Immune phenotype of the CD4+ T cells in the aged lymphoid organs and lacrimal glands

Affiliations

Immune phenotype of the CD4+ T cells in the aged lymphoid organs and lacrimal glands

Claudia M Trujillo-Vargas et al. Geroscience. 2022 Aug.

Abstract

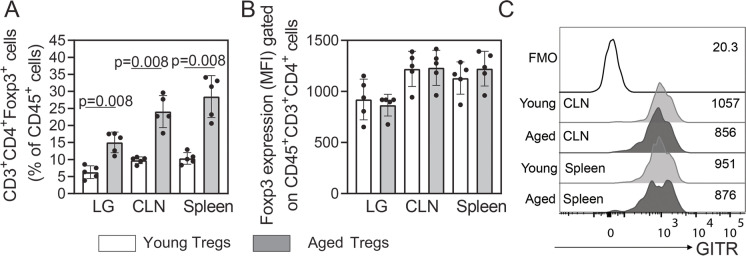
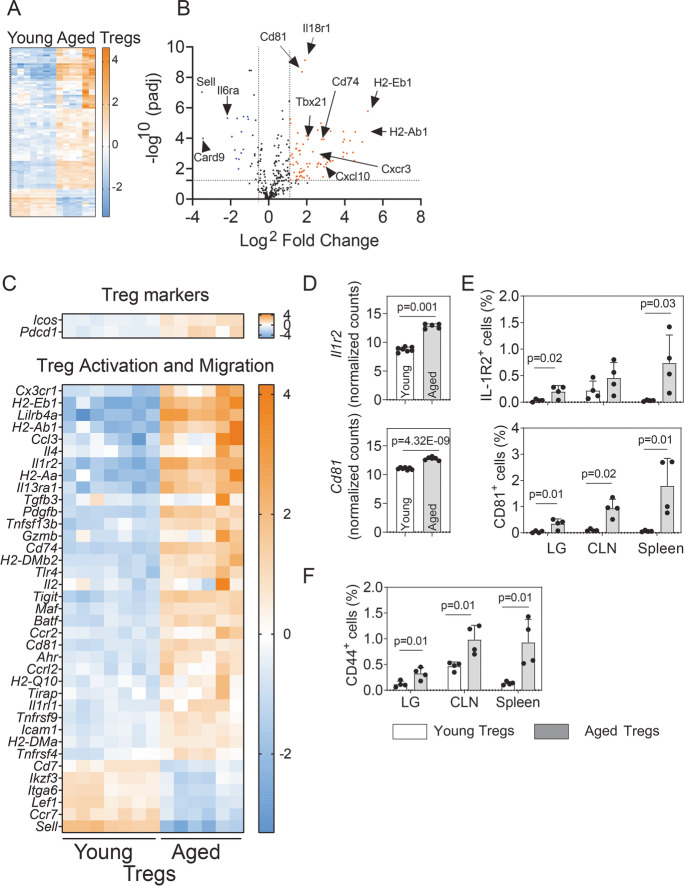
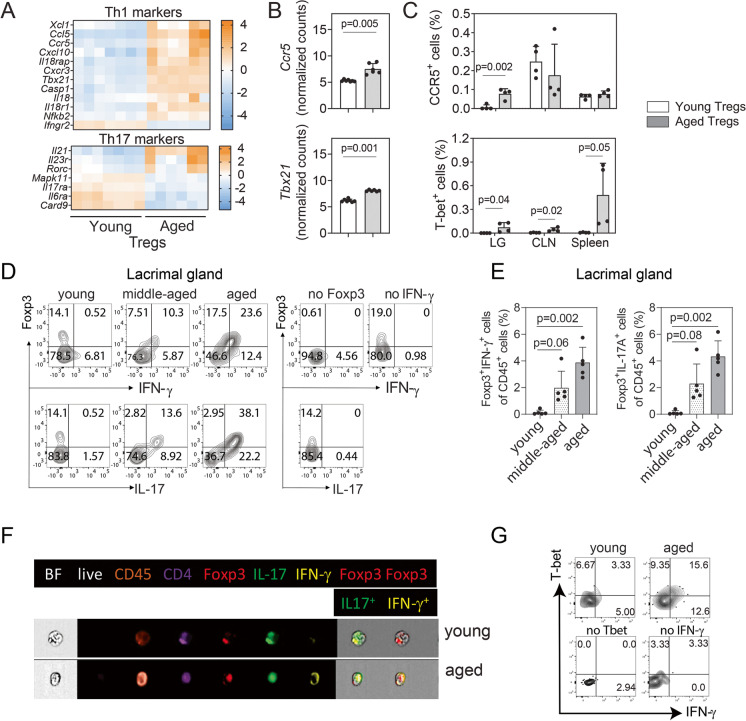
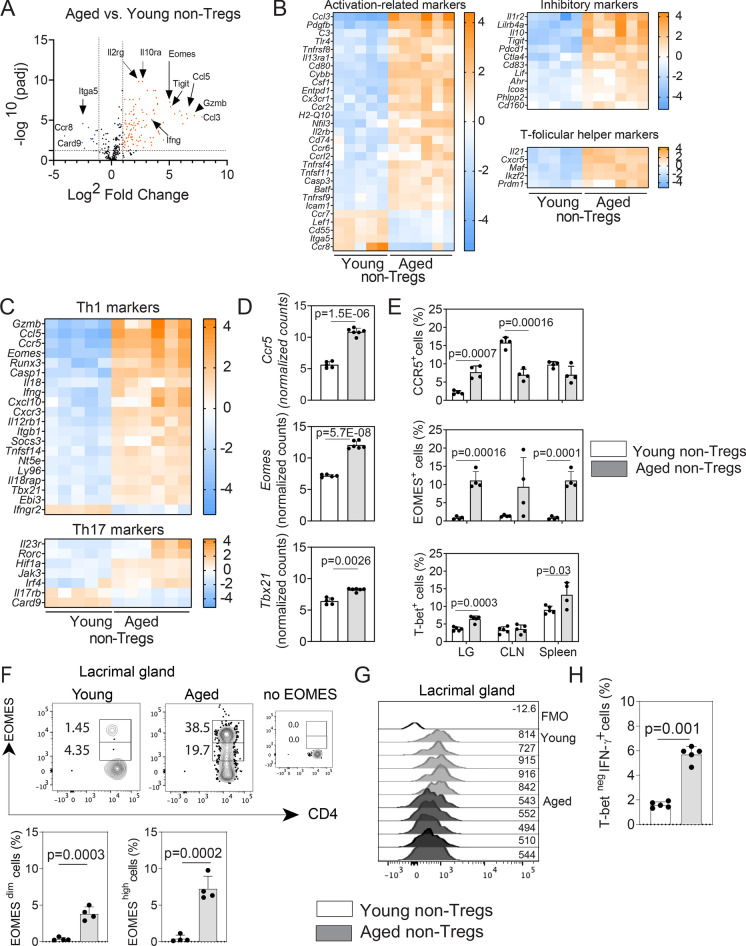
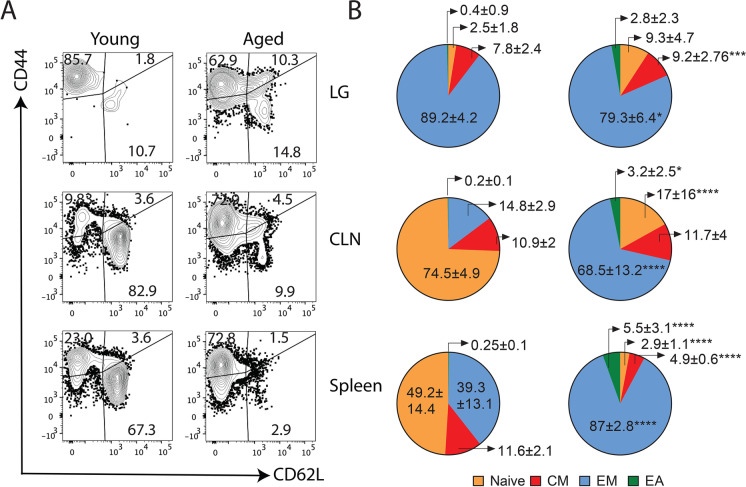
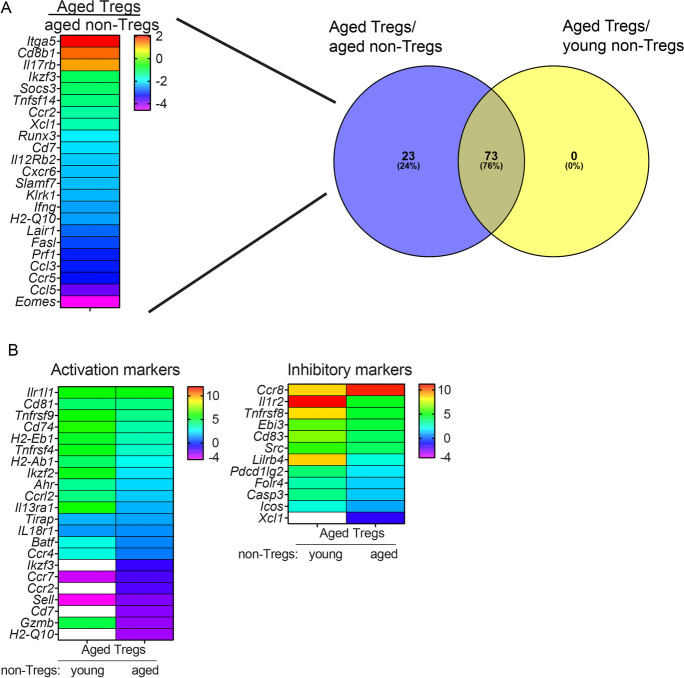
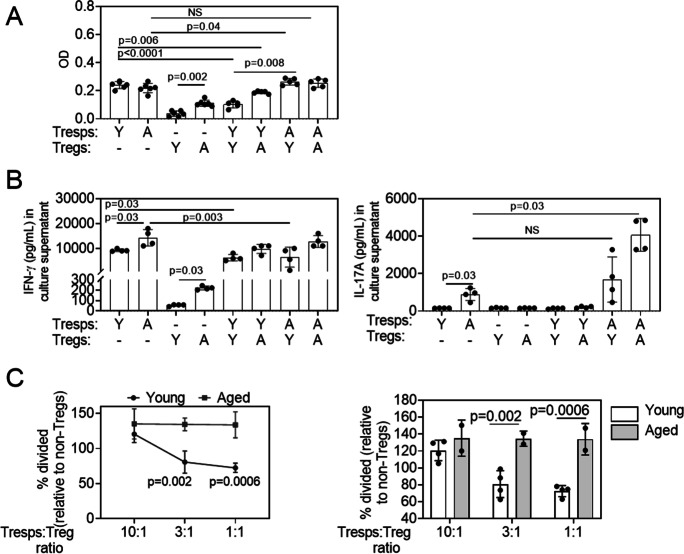
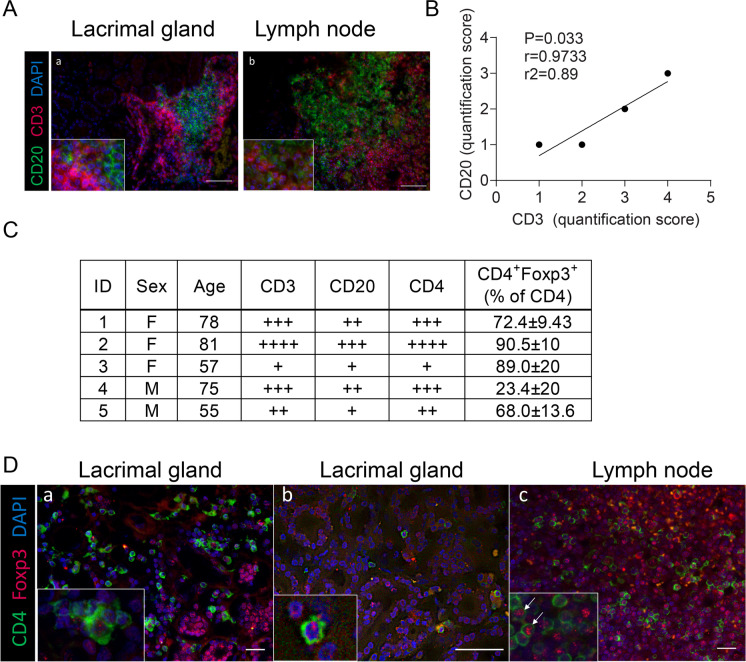
Aging is associated with a massive infiltration of T lymphocytes in the lacrimal gland. Here, we aimed to characterize the immune phenotype of aged CD4+ T cells in this tissue as compared with lymphoid organs. To perform this, we sorted regulatory T cells (Tregs, CD4+CD25+GITR+) and non-Tregs (CD4+CD25negGITRneg) in lymphoid organs from female C57BL/6J mice and subjected these cells to an immunology NanoString® panel. These results were confirmed by flow cytometry, live imaging, and tissue immunostaining in the lacrimal gland. Importantly, effector T helper 1 (Th1) genes were highly upregulated on aged Tregs, including the master regulator Tbx21. Among the non-Tregs, we also found a significant increase in the levels of EOMESmed/high, TbetnegIFN-γ+, and CD62L+CD44negCD4+ T cells with aging, which are associated with cell exhaustion, immunopathology, and the generation of tertiary lymphoid tissue. At the functional level, aged Tregs from lymphoid organs are less able to decrease proliferation and IFN-γ production of T responders at any age. More importantly, human lacrimal glands (age range 55-81 years) also showed the presence of CD4+Foxp3+ cells. Further studies are needed to propose potential molecular targets to avoid immune-mediated lacrimal gland dysfunction with aging.

Keywords: Aging; CD4+ T cells; Conventional T cells; Dry eye disease; Lacrimal gland; Lymphoid organs; Regulatory T cells; Sjögren’s syndrome; Transcriptome.


Conflict of interest statement

The authors declare no competing interests.

Figures

Fig. 1
Fig. 1
CD4+ Foxp3+ T cells accumulate in aged lacrimal gland as well as in lymphoid tissues. Single cell suspensions were obtained from the lacrimal gland (LG), ocular, and LG draining cervical lymph nodes (CLNs) and spleen of young and aged mice (n = 5 per group), to quantify A the percentages and B median fluorescence intensity (MFI) of alive CD45+CD3+CD4+ cells expressing Foxp3 intracellularly (Tregs). C The extracellular expression of GITR was also evaluated in Tregs from CLN and spleen cell suspensions by flow cytometry. Numbers at the right side of the histogram indicate the MFI of GITR. Values in the bars expressed as mean ± standard deviation. Statistical significance based on Mann–Whitney U test. The significant p value is indicated above the bars
Fig. 2
Fig. 2
Comparative analysis of expressed immune-related genes in aged versus young Tregs. RNA from sorted cells (n = 5–7 biological replicates/group; each replicate include the CLN and spleens from three mice) was isolated and subjected to NanoString® analysis. A The overall gene expression profile for the 547 molecular targets included in the panel is shown. B The volcano plot shows the magnitude of change of the lymphoid organ genes modulated by aging (log2 fold change) versus the adjusted p value (− log10). Some of the most significantly upregulated and downregulated genes are highlighted. The dotted line indicates a significance of 0.05. C Detailed analysis of significantly differentially expressed genes (DEGs) greater than twofold change associated with Treg function and activation. D Normalized counts of two upregulated DEGs (Il1r2, Cd81) from NanoString® analysis. p value indicates FDR from ROSALIND® software, calculated as described in the “Methods.” E, F Flow cytometry analysis of protein expression of Il1r2 and CD81 E and CD44 F in the lacrimal gland (LG), draining cervical lymph nodes (CLNs) and spleen in young (2–3 months) and aged (22–25 months) mice (n = 4 mice per group). Values in the bars expressed as mean ± standard deviation. Statistical significance based on the Mann–Whitney U test. The significant p value is indicated above the bars
Fig. 3
Fig. 3
Effector Tregs accumulate in the aged lacrimal glands as compared with lymphoid tissues. A Heatmap of the expression of Th1- and Th17-related genes was compared in young and aged lymphoid tissues. B Normalized counts of Ccr5 and Tbx21 in the analyzed samples together with C the flow cytometry analysis of the corresponding protein expression in the lacrimal gland (LG), draining cervical lymph node (CLN) and spleen (n = 4 animals per group). D Representative contour plots of cytokine-producing CD4+Foxp3+ lymphocytes in the lacrimal gland in mice at different time points by flow cytometry. E Cumulative data of all the samples analyzed (n = 5 animals per group). F The same parameters by live imaging are also shown (n = 3 animals per group). G Representative contour plots of the co-expression of Tbet and IFN-γ by flow cytometry in young and aged lacrimal glands (n = 4 animals per group). Values in the bars expressed as mean ± standard deviation. Statistical significance based on the Mann–Whitney U test. The significant p value is indicated above the bars
Fig. 4
Fig. 4
Aged non-Tregs exhibited an aberrant phenotype associated with activation, exhaustion, and signs of immunopathology. RNA from sorted non-Tregs (n = 5–7 biological replicates/group; each replicate includes the CLN and spleens from three mice) was isolated from the lymphoid organs of young and aged mice and subjected to NanoString® analysis. A Volcano plot denotes the distribution of the expressed genes according to the significance and the fold change expression, as compared to young and aged Tregs. Some of the most significant upregulated and downregulated genes are highlighted. The dotted line indicates a significance of 0.05. B, C Heatmaps of the differentially expressed genes (DEGs) associated with activation, inhibition, T follicular help and Th1/Th17 differentiation, and function. D Bar graphs depicting the normalized counts of Ccr5,  Eomes , and Tbx21 DEGs. p value indicates FDR from ROSALIND® software, calculated as described in the “Methods.” E Flow cytometry analysis of the corresponding protein expression in the lacrimal gland (LG), draining cervical lymph node (CLN) and spleen (n = 4 animals/group). F Histograms showing the EOMES expression pattern in young and aged non-Tregs in the lacrimal glands together with the flow cytometry analysis of the EOMESdim and EOMEShigh cells in the lacrimal gland by flow cytometry. G Histogram showing the expression of Tbet in non-Tregs. H Flow cytometry analysis showing Tbetneg/IFN-γ+ cells (n = 5 animals/group). Values in the bars expressed as mean ± standard deviation. Statistical significance based on the Mann–Whitney U test. The significant p value is indicated above the bars
Fig. 5
Fig. 5
Changes in the CD4+ T cell signature in the lacrimal gland as compared to those from lymphoid tissues. A Representative contour plot from the different populations of CD4+ T cells in the lacrimal gland (LG), draining cervical lymph nodes (CLNs) and spleen as measured by the expression of CD62 ligand (CD62L) and CD44. Numbers in the quadrants indicate the percentages of the different populations in alive CD45+CD3+CD4+ cells in young and aged mice. B Pie charts depicting the average of the different CD4+ T cell populations (naïve: CD62L+CD44neg, central memory (CM): CD62L+CD44+, effector memory (EM): CD62LnegCD44+, effector activated (EA): CD62LnegCD44low) from the different tissues (n = 5 animals/group) in young and aged mice. Numbers indicate the means ± standard deviation of the different populations. *p < 0.05, **p < 0.01, ***p < 0.001; ****p < 0.0001. Values expressed as mean ± standard deviation. Statistical significance based on the Mann–Whitney U test
Fig. 6
Fig. 6
Comparative multiplex analysis of the mRNA for immune-related genes in Tregs versus non-Tregs with aging. RNA was isolated from sorted Tregs and non-Tregs from a mixture of draining cervical lymph nodes (CLNs) and spleen of young and aged mice (n = 5–7 biological replicates/group) and subjected to NanoString® analysis using the immunology panel v2. A The number of differentially expressed genes (DEGs) in aged Tregs versus aged non-Tregs as compared to aged Tregs versus young non-Tregs is shown in a Venn diagram, depicting in the heatmap those that were only present in the aged pair. B DEGs either related to activation or inhibitory function are shown in the left and right heatmaps, respectively. White boxes indicate no statistical significance in that pair
Fig. 7
Fig. 7
Aged regulatory T cells do not suppress well in vitro, and aged T responders are overly active. A Cell proliferation was measured for young and aged CD4+CD25neg Tresponders (Tresps) and young and aged CD4+CD25+ Tregs using the colorimetric WST-1 Cell Proliferation Reagent. Tregs and Tresps were cultured at a 1:1 ratio for 72 h in a plate previously coated with CD3/CD28 as described in the “Methods.” Bar graphs show means ± SD of data combined from two independent experiments (four to five mice were pooled/age/experiment). One-way ANOVA followed by Dunnett’s multiple comparison test. B The production of IFN-γ and IL-17A was determined in culture supernatants by the Luminex assay. Co-culture supernatants were collected in triplicate from two independent experiments. Bar graphs show means ± SD of data combined from two independent experiments (four to five mice were pooled/age/experiment). The Mann–Whitney U test was used to compare specific pairs. NS = non-significant. C Cell proliferation was measured for CD4+ Tresponders in the presence of young and aged CD4+CD25+GITR+ Tregs or CD4+CD25negGITRneg non-Tregs using Violet Tracer staining followed by flow cytometry. Tregs/non-Tregs and Tresponders were cultured at different ratios for 72 h in a plate previously coated with anti-CD3 antibody as described in the “Methods.” The percentage of cell division was calculated based on the Tresponder proliferation. Data are shown both as suppression curves and bar graphs. Two-way ANOVA followed by Sidak’s multiple comparison test
Fig. 8
Fig. 8
Aged human lacrimal glands have infiltration with CD3+, CD20+, and CD4+Foxp3+ cells. A Representative merged image of human lacrimal gland (a) and lymph node (b) immunostained with anti-CD3 (T cells, red) and anti-CD20 (B cells, green) antibodies with DAPI nuclear counterstaining (blue). B Spearman’s correlation of T and B cell infiltration scores. r coefficient of correlation, r2 coefficient of determination. C Demographics of lacrimal glands used and the corresponding infiltration scores, as described in the “Methods.” D Representative merged images of human lacrimal gland (a, b) and lymph node (c) immunostained with anti-CD4 (green) and Foxp3 (red) antibodies with DAPI nuclear counterstaining (blue). Magnification 400-fold and in the small squares, magnification 600-fold; scale bar = 50 µm

References

    1. Turner VM, Mabbott NA. Ageing adversely affects the migration and function of marginal zone B cells. Immunology. 2017;151(3):349–362. - PMC - PubMed
    1. Márquez EJ, Chung CH, Marches R, Rossi RJ, Nehar-Belaid D, Eroglu A, et al. Sexual-dimorphism in human immune system aging. Nat Commun. 2020;11(1):751. - PMC - PubMed
    1. Chung HY, Kim DH, Lee EK, Chung KW, Chung S, Lee B, Seo AY, Chung JH, Jung YS, Im E, Lee J, Kim ND, Choi YJ, Im DS, Yu BP. Redefining chronic inflammation in aging and age-related diseases proposal of the senoinflammation concept. Aging Dis. 2019;10(2):367–382. - PMC - PubMed
    1. Neyt K, Perros F, GeurtsvanKessel CH, Hammad H, Lambrecht BN. Tertiary lymphoid organs in infection and autoimmunity. Trends Immunol. 2012;33(6):297–305. - PMC - PubMed
    1. Ligon MM, Wang C, DeJong EN, Schulz C, Bowdish DME, Mysorekar IU. Single cell and tissue-transcriptomic analysis of murine bladders reveals age- and TNFα-dependent but microbiota-independent tertiary lymphoid tissue formation. Mucosal Immunology. 2020;13(6):908–918. - PMC - PubMed

Publication types

Substances