. 2022 Feb;10(4):190.
doi: 10.21037/atm-22-366.

Identification of key biomarkers and immune infiltration in renal interstitial fibrosis

Affiliations

Identification of key biomarkers and immune infiltration in renal interstitial fibrosis

Zhanhong Hu et al. Ann Transl Med. 2022 Feb.

Abstract

Background: Renal interstitial fibrosis (RIF) is the common final pathway that mediates almost all progressive renal diseases. However, the underlying mechanisms of RIF have not been fully elucidated. Therefore, the current study aimed to explore the etiology of RIF and identify the key targets and immune infiltration patterns of RIF.

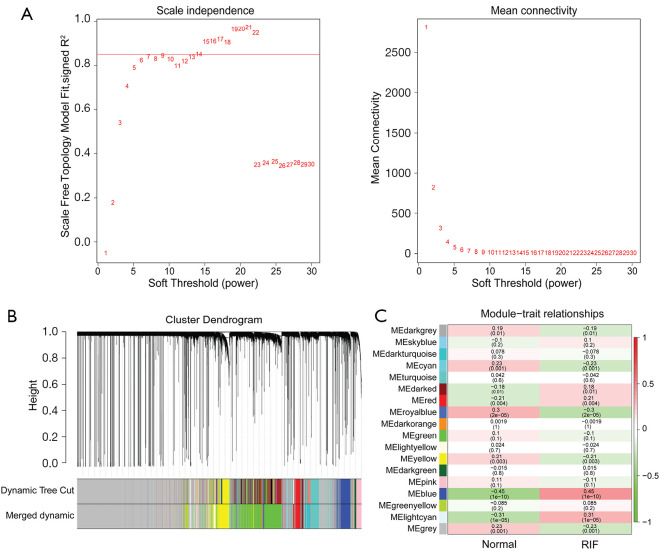
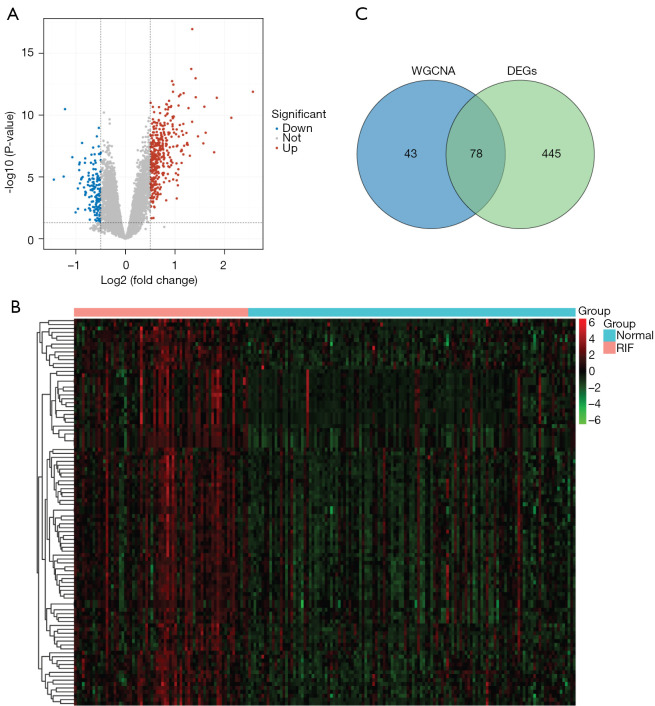
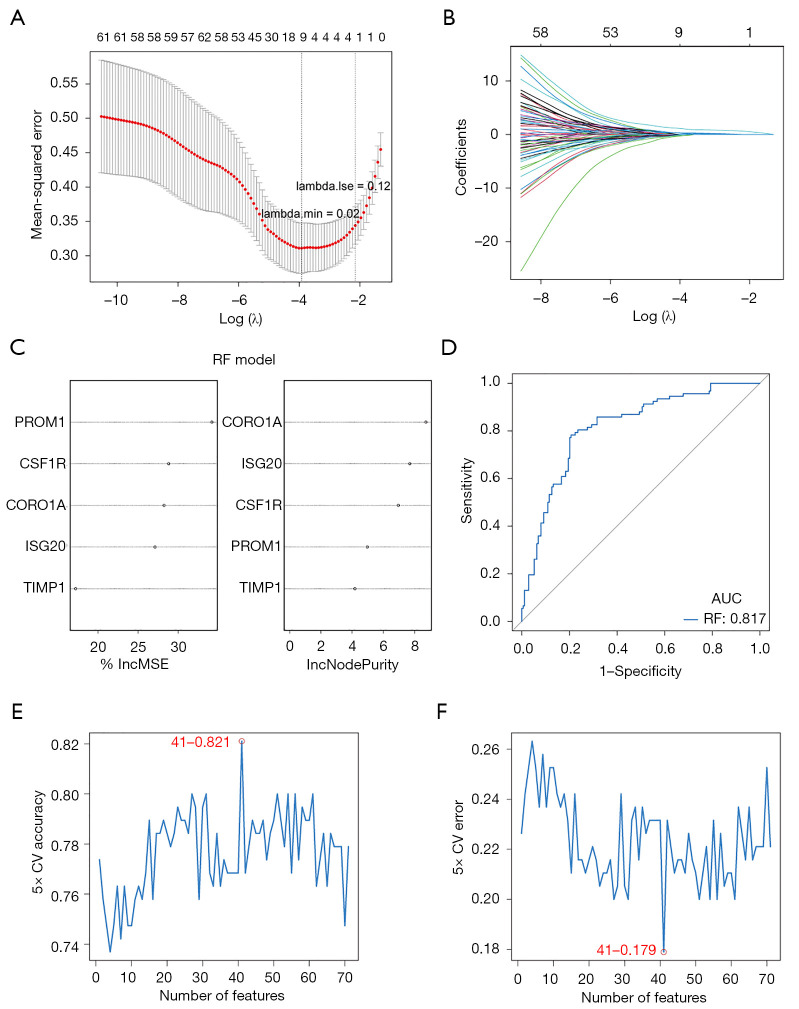
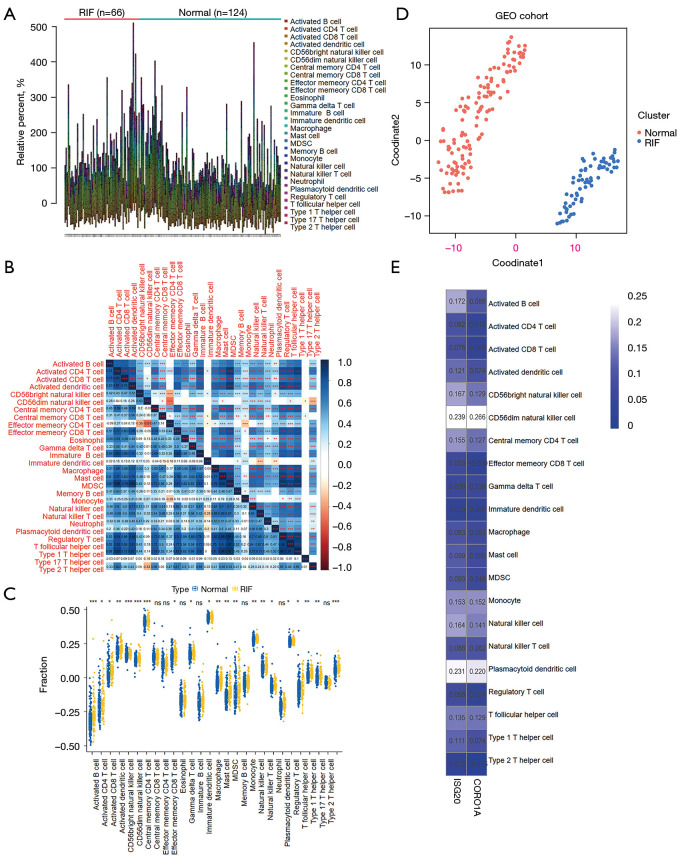
Methods: Ribonucleic acid (RNA)-seq data of RIF and normal samples were downloaded from the Gene Expression Omnibus (GEO) database. Weighted gene co-expression network analysis (WGCNA) was performed to screen relevant modules associated with RIF. Differentially expressed genes (DEGs) between the RIF and normal samples were identified using the limma package. Machine learning methods were used to identify hub gene signatures related to RIF. Further biochemical approaches including quantitative polymerase chain reaction (qPCR), immunoblotting and immunohistochemistry experiments were performed to verify the hub signatures in the RIF samples. Single sample gene set enrichment analysis (ssGSEA) was used to analyze the proportions of 28 immune cells in RIF and normal samples.

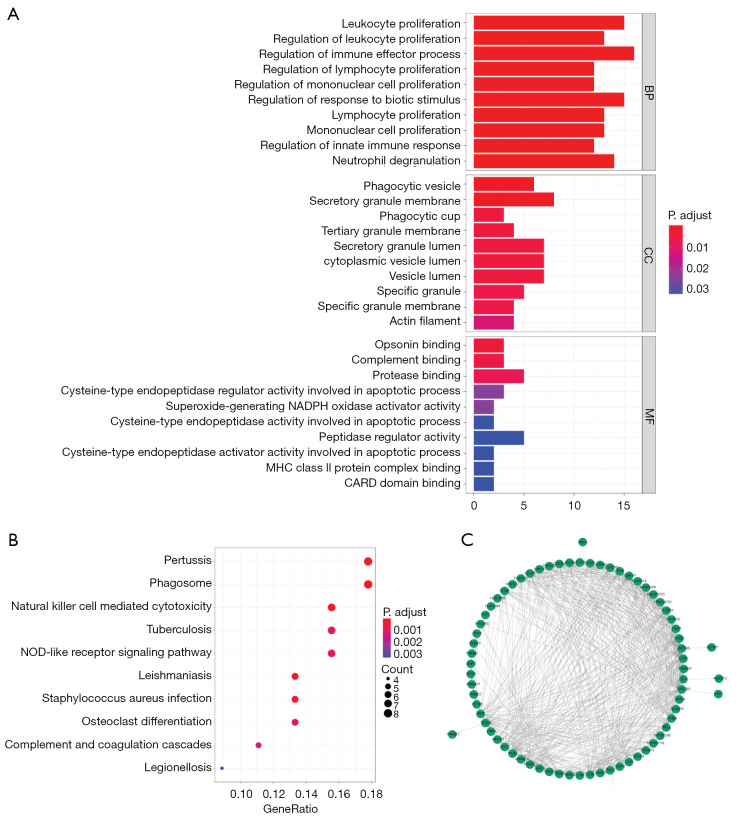
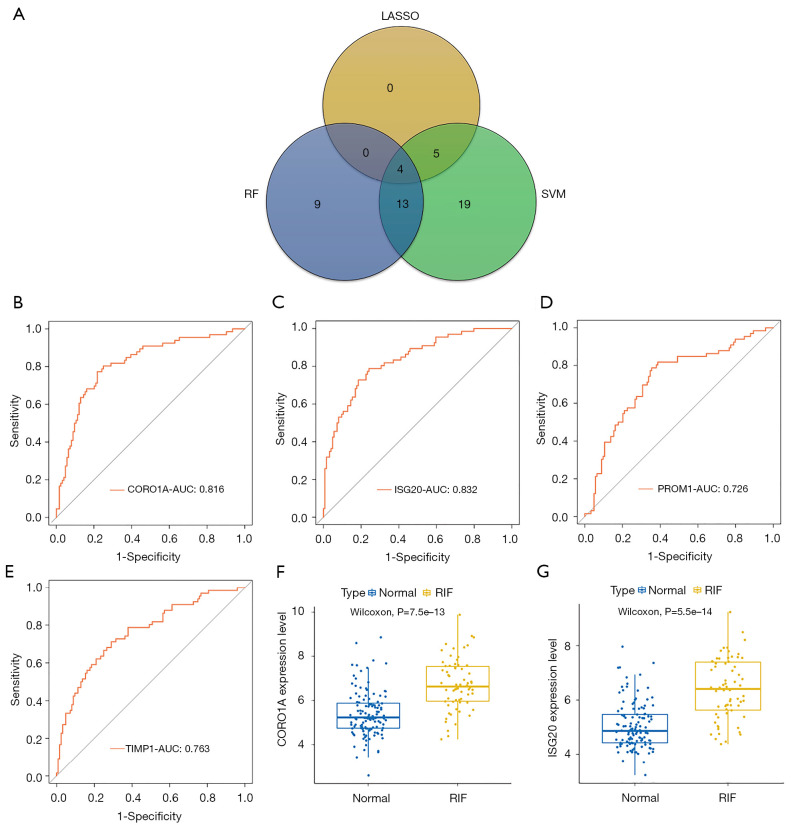
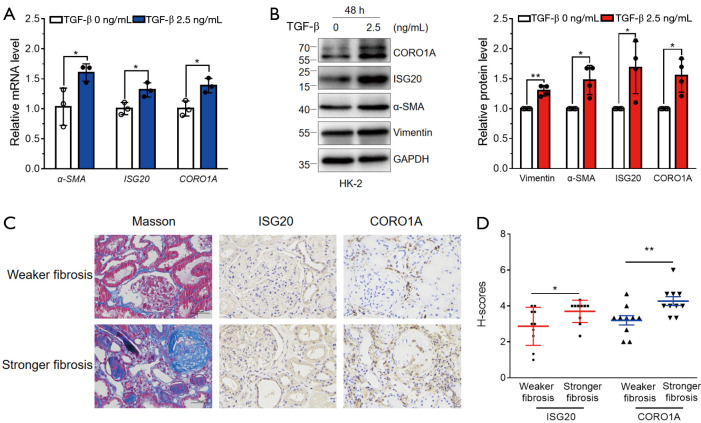
Results: WGCNA showed 121 RIF-related genes. A total of 523 DEGs were found between the RIF and normal samples. By overlapping these genes, we obtained 78 RIF-related genes, which were mainly enriched in Gene Ontology (GO) and Kyoto Encyclopedia of Genes and Genomes (KEGG) pathways associated with immunity and inflammation. Integrative analysis of machine learning methods showed prominin 1 (PROM1), tryptophan aspartate-containing coat protein (CORO1A), interferon-stimulated exonuclease gene 20 (ISG20), and tissue inhibitor matrix metalloproteinase 1 (TIMP1) as hub gene signatures in RIF. Further, receiver operating curve (ROC) curves implied the diagnostic role of ISG20 and CORO1A in RIF. The expression levels of ISG20 and CORO1A were significantly higher in fibrotic tubular cells and renal tissues based on biochemical approaches. The immune microenvironment was found to be markedly altered in the RIF samples, as 21 differentially infiltrated immune cells (DIICs) were found between RIF and normal samples.

Conclusions: This study is the first to find that ISG20 and CORO1A are key biomarkers and to examine the landscape of immune infiltration in RIF. Our findings provide novel insights into the mechanisms and treatment of patients with RIF.

Keywords: CORO1A; ISG20; Renal interstitial fibrosis (RIF); immune infiltration; machine learning.


Conflict of interest statement

Conflicts of Interest: All authors have completed the ICMJE uniform disclosure form (available at https://atm.amegroups.com/article/view/10.21037/atm-22-366/coif). The authors have no conflicts of interest to declare.

Figures

Figure 1
Figure 1
Identification of the key modules associated with RIF. (A) Determination of soft-threshold power via WGCNA. Analysis of the scale-free index and mean connectivity for various soft threshold powers (β) was performed. (B) Identification of the gene co-expression modules via hierarchical cluster analysis. Each branch of the tree diagram represents genes, and genes clustered into the same module are assigned the same module color. (C) Heatmap of the correlation between the module eigengenes and clinical traits of RIF. The Pearson correlation coefficient between the module eigengenes and sample traits were calculated, and modules with |cor| >0.3 and P value <0.05 were considered as key modules related to RIF. RIF, renal interstitial fibrosis; WGCNA, weighted gene co-expression network analysis.
Figure 2
Figure 2
Identification of candidate key genes in RIF. (A) Volcano plot of DEGs. Volcano plot illustrates the DEGs between normal and RIF samples. Red and blue dots above the dashed curves represent proteins significantly upregulated or downregulated in RIF, with fold change >2. (B) Heatmap of the top 100 DEGs. Each row represents a gene, and each column represents a sample. The red and green colors of the tile indicate high or low expression, respectively. (C) Venn diagrams of RIF-related DEGs. A Venn diagram was used to identify genes shared between WGCNA and DEGs. The blue circle indicates genes from WGCNA, and the green circle indicates DEGs. RIF, renal interstitial fibrosis; WGCNA, weighted gene co-expression network analysis; DEG, differentially expressed gene.
Figure 3
Figure 3
Functional analysis of candidate key genes in RIF. (A,B) GO annotation and KEGG pathway enrichment analysis of key genes. The top 10 enriched GO BP, CC, and MF terms (A) as well as KEGG (B) pathways were analyzed. (C) PPI network analysis of the key genes in RIF. A PPI network between the 78 RIF-related DEGs was constructed using the STRING database (http://www.string-db.org/) and visualized using Cytoscape software. BP, biological process; CC, cell component; MF, molecular function; NADPH, nicotinamide adenine dinucleotide phosphate; MHC, major histocompatibility complex; CARD, caspase recruitment domain; NOD, nucleotide oligomerization domain; GO, Gene Ontology; KEGG, Kyoto Encyclopedia of Genes and Genomes; PPI, protein-protein interaction; RIF, renal interstitial fibrosis; DEG, differentially expressed gene.
Figure 4
Figure 4
Selection of the hub gene signatures by machine learning. (A) Tuning parameter selection in the LASSO model. The mean-squared error is plotted against log (λ), where λ is the tuning parameter. Mean-squared error values are shown, with error bars representing SE. The dotted vertical lines are drawn at the optimal values by minimum criteria and 1-SE criteria. (B) LASSO coefficient profiles of key genes in RIF. The coefficients are plotted against log (λ). (C) Identification of the relative important variables via RF. The importance of variables was assessed based on an increase in mean squared error (%IncMSE) and increase in node purity (IncNodePurity), respectively. (D) Evaluation of the RF model through the ROC. The ROC of the RF model showed its good performance, with AUC of 0.817. (E,F) Identification of relative important variables by deleting SVM-generated eigenvectors in conjunction with 5-fold cross-validation. The accuracy (E) and error (F) of 5-fold cross-validation were plotted against number of features, respectively, which showed that the number of features was set at 41, with the highest accuracy (0.821) and lowest error (0.179). LASSO, least absolute shrinkage and selection operator; RIF, renal interstitial fibrosis; RF, random forest; ROC, receiver operating curve; SVM, support vector machine.
Figure 5
Figure 5
Identification of ISG20 and CORO1A as key biomarkers of RIF. (A) Venn diagrams of key biomarkers shared by LASSO, RF, and SVM-RFE. PROM1, CORO1A, ISG20, and TIMP1 were identified as hub signatures in RIF selected by LASSO, RF, and SVM-RFE. (B-E) Evaluation of the diagnostic value of the hub signatures through the ROC. The AUCs of CORO1A, ISG20, PROM1, and TIMP1 were 0.816, 0.832, 0.726, and 0.763, respectively. (F,G) Validation of the expression of diagnostic biomarkers in GSE22459 and GSE76882. The expression levels of CORO1A (F) and ISG20 (G) were markedly elevated in RIF samples compared with normal samples. LASSO, least absolute shrinkage and selection operator; RF, random forest; SVM-RFE, support vector machine-recursive feature elimination; RIF, renal interstitial fibrosis; ROC, receiver operating curve; AUC, areas under the curve.
Figure 6
Figure 6
Validation of the expression of CORO1A and ISG20 in fibrotic tubular cells and renal tissue. (A) CORO1A and ISG20 mRNA expression in TGF-β-stimulated HK-2 cells. HK-2 cells were stimulated with TGF-β (0 and 2.5 ng/mL) for 48 h. Relative mRNA level of α-SMA, ISG20, and CORO1A in the above cells was measured by qPCR. α-SMA was used as a fibrosis marker induced by TGF-β. Mean ± SDs were obtained from three technical replicates. Student’s t-test (two-sided), *, P<0.05. (B) CORO1A and ISG20 protein expression in TGF-β-stimulated HK-2 cells. HK-2 cells were stimulated with TGF-β (0 and 2.5 ng/mL) for 48 h. Cell lysates from the above cells were immunoblotted against Vimentin, α-SMA, ISG20, CORO1A, and GAPDH. Vimentin and α-SMA were used as fibrosis markers induced by TGF-β, and GAPDH was used as a loading control. Mean ± SDs are depicted and P value was calculated using Student’s t-test (two-sided) with data from four biological replicates. *, P<0.05; **, P<0.01. (C,D) CORO1A and ISG20 protein expression in fibrotic renal tissue. Renal tissues from CKD patients with different degree of fibrosis were stained for CORO1A and ISG20 by immunohistochemistry. Representative images of Masson staining and immunohistochemistry staining for CORO1A and ISG20 in renal tissues (C). Scale bar: 50 mm. The expression level of CORO1A and ISG20 (D) in renal tissues with different degrees of fibrosis. Student’s t-test (two-sided), *, P<0.05; **, P<0.01. TGF-β, transforming growth factor-β; α-SMA, α-smooth muscle actin; CKD, chronic kidney disease.
Figure 7
Figure 7
Identification of potential drugs for the treatment of RIF. A chemical-diagnostic biomarker network was constructed based on potential chemicals targeting ISG20 and CORO1A, and their interactions. The red and blue lines represent the respective increasing or decreasing effects of the chemicals (with chemical IDs in the ellipse) on the expression of target genes (with gene names in the ellipse). RIF, renal interstitial fibrosis.
Figure 8
Figure 8
Distribution of immune cells in RIF. (A) The infiltration levels in RIF and normal samples. The ssGSEA algorithm in “GSVA” R package was employed to calculate the infiltration levels of 28 immune cell types in 66 samples with RIF and 124 normal samples from the GSE22459 and GSE76882 datasets. (B) Correlation heatmap of 28 types of immune cells. The numbers in the lower left quarter represent the correlation coefficient between row-defining immune cells and column-defining immune cells, while the statistical significance is highlighted in the upper right quarter. Pearson rank correlation test, *, P<0.05; **, P<0.01; ***, P<0.00. (C) Comparisons of immune cell infiltration between RIF and normal samples. Wilcoxon test, *, P<0.05; **, P<0.01; ***, P<0.001; ns, not significant. (D) Distribution of the cohort differentially infiltrated immune cells (DIICs). t-SNE method was applied to cluster and visualize the distribution of DIICs in the GEO cohort. (E) Correlations between DIICs and diagnostic biomarkers. The numbers in the frame represent the Spearman correlation coefficient between each DIIC and ISG20 or CORO1A. RIF, renal interstitial fibrosis; DIIC, differentially infiltrated immune cell; GEO, Gene Expression Omnibus.

Similar articles

Cited by

References

    1. Ammirati AL. Chronic Kidney Disease. Rev Assoc Med Bras (1992) 2020;66 Suppl 1:s03-9. 10.1590/1806-9282.66.s1.3 - DOI - PubMed
    1. Ruiz-Ortega M, Rayego-Mateos S, Lamas S, et al. Targeting the progression of chronic kidney disease. Nat Rev Nephrol 2020;16:269-88. 10.1038/s41581-019-0248-y - DOI - PubMed
    1. Ke B, Zhu N, Luo F, Xu Y, Fang X. Targeted inhibition of endoplasmic reticulum stress: New hope for renal fibrosis (Review). Mol Med Rep 2017;16:1014-20. 10.3892/mmr.2017.6762 - DOI - PMC - PubMed
    1. Humphreys BD. Mechanisms of Renal Fibrosis. Annu Rev Physiol 2018;80:309-26. 10.1146/annurev-physiol-022516-034227 - DOI - PubMed
    1. Wang W, Shen J, Qi C, et al. The key candidate genes in tubulointerstitial injury of chronic kidney diseases patients as determined by bioinformatic analysis. Cell Biochem Funct 2020;38:761-72. 10.1002/cbf.3545 - DOI - PubMed