Marsdenia tenacissima Extract Induces Autophagy and Apoptosis of Hepatocellular Cells via MIF/mToR Signaling
- PMID: 35280512
- PMCID: PMC8916871
- DOI: 10.1155/2022/7354700
Marsdenia tenacissima Extract Induces Autophagy and Apoptosis of Hepatocellular Cells via MIF/mToR Signaling
Abstract
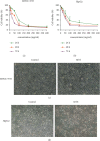
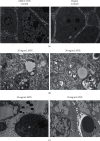
Hepatocellular carcinoma (HCC) seriously endangers humans. In traditional Chinese medicine, Marsdenia tenacissima (MTE) has anti-inflammatory, antiasthmatic, antihypertensive, and anticancer effects. This study reveals the antiproliferative effect of MTE on the HCC cells in vitro and provides a theoretical basis for the development and clinical application of anti-HCC agents. Methods. MHCC-97H and HepG2 cells were cultured in vitro and exposed to various concentrations and durations of MTE, and an MTT assay was used to detect the effects of MTE on cell proliferation. Transmission electron microscopy revealed the morphological changes in the two cell lines after MTE stimulation. The MTE effects on the apoptosis and cell cycle distribution of the cell lines were detected by flow cytometry. Western blotting and qRT-PCR were used to detect target gene expression at the protein and mRNA levels, respectively. Results. MTE reduced the viability of the MHCC-97H and HepG2 cells in a dose- and time-dependent manners (P < 0.05). Autophagic vesicles and apoptotic bodies were found in the MHCC-97H and HepG2 cells after MTE incubation, and the Annexin V-PI assay showed that the apoptotic rates of the cell lines increased with increasing MTE concentration (P < 0.05). Autophagy inducer rapamycin promoted the MTE-induced apoptotic rates of the cell lines, whereas autophagy inhibitor chloroquine inhibited the apoptotic rates. More cells in the S phase were found in the two cell lines after MTE treatment (P < 0.05). After MTE incubation, MIF, CD47, and beclin-1 protein levels significantly increased. Furthermore, in the MTE group, Akt, mTOR, and caspase3 expressions decreased; however, LC 3 expression increased, which was significantly different from the control group (P < 0.05). Conclusions. MTE inhibited proliferation and induced autophagy, apoptosis, and S phase cell cycle arrest in the MHCC-97H and HepG2 cells. These effects might be related to the activation of MIF and mTOR signaling inhibition.
Copyright © 2022 Shuai Lin et al.
Conflict of interest statement
The authors declare no conflicts of interest.
Figures


Similar articles
-
Marsdenia tenacissima extract induces apoptosis and suppresses autophagy through ERK activation in lung cancer cells.Cancer Cell Int. 2018 Sep 27;18:149. doi: 10.1186/s12935-018-0646-4. eCollection 2018. Cancer Cell Int. 2018. PMID: 30275772 Free PMC article.
-
Marsdenia Tenacissima Extract Inhibits Proliferation and Promotes Apoptosis in Human Ovarian Cancer Cells.Med Sci Monit. 2018 Sep 9;24:6289-6297. doi: 10.12659/MSM.909726. Med Sci Monit. 2018. PMID: 30196309
-
Marsdenia tenacissima extract disturbs the interaction between tumor-associated macrophages and non-small cell lung cancer cells by targeting HDGF.J Ethnopharmacol. 2022 Nov 15;298:115607. doi: 10.1016/j.jep.2022.115607. Epub 2022 Aug 13. J Ethnopharmacol. 2022. PMID: 35973634
-
Marsdenia tenacissima extract induces G0/G1 cell cycle arrest in human esophageal carcinoma cells by inhibiting mitogen-activated protein kinase (MAPK) signaling pathway.Chin J Nat Med. 2015 Jun;13(6):428-37. doi: 10.1016/S1875-5364(15)30036-4. Chin J Nat Med. 2015. PMID: 26073339
-
Oral and injectable Marsdenia tenacissima extract (MTE) as adjuvant therapy to chemotherapy for gastric cancer: a systematic review.BMC Complement Altern Med. 2019 Dec 12;19(1):366. doi: 10.1186/s12906-019-2779-y. BMC Complement Altern Med. 2019. PMID: 31830977 Free PMC article.
Cited by
-
Targeting the mTOR Pathway in Hepatocellular Carcinoma: The Therapeutic Potential of Natural Products.J Inflamm Res. 2024 Dec 6;17:10421-10440. doi: 10.2147/JIR.S501270. eCollection 2024. J Inflamm Res. 2024. PMID: 39659752 Free PMC article. Review.
-
Therapeutic Effects of Natural Products on Liver Cancer and Their Potential Mechanisms.Nutrients. 2024 May 27;16(11):1642. doi: 10.3390/nu16111642. Nutrients. 2024. PMID: 38892575 Free PMC article.
-
Determination of Tenacissoside G, Tenacissoside H, and Tenacissoside I in Rat Plasma by UPLC-MS/MS and Their Pharmacokinetics.Int J Anal Chem. 2023 Sep 28;2023:4747771. doi: 10.1155/2023/4747771. eCollection 2023. Int J Anal Chem. 2023. PMID: 37810909 Free PMC article.
-
Marsdenia tenacissima enhances immune response of tumor infiltrating T lymphocytes to colorectal cancer.Front Immunol. 2023 Aug 15;14:1238694. doi: 10.3389/fimmu.2023.1238694. eCollection 2023. Front Immunol. 2023. PMID: 37649480 Free PMC article.
References
-
- Ronot M., Bouattour M., Wassermann J., et al. Alternative response criteria (Choi, European association for the study of the liver, and modified Response Evaluation Criteria in Solid Tumors [RECIST]) versus RECIST 1.1 in patients with advanced hepatocellular carcinoma treated with sorafenib. The Oncologist . 2014;19(4):394–402. doi: 10.1634/theoncologist.2013-0114. - DOI - PMC - PubMed
-
- Asafo-Agyei K. O., Samant H. Hepatocellular Carcinoma . Treasure Island, FL, USA: StatPearls Publishing LLC.; 2020. - PubMed
LinkOut - more resources
Full Text Sources
Research Materials
Miscellaneous

